Intel - The bottom is in!🔮Intel ( NASDAQ:INTC ) forms a clear bottom:
🔎Analysis summary:
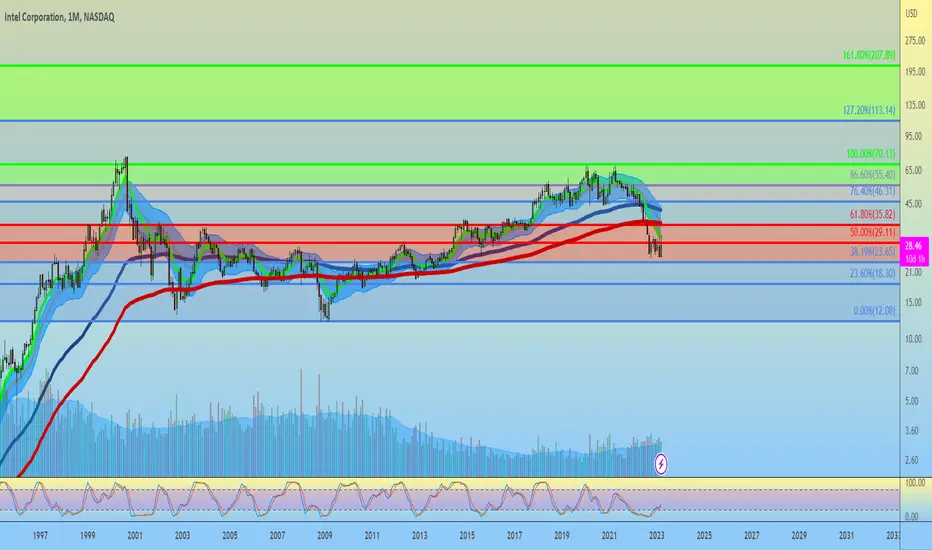
After a consolidation of about three decades, Intel is now creating a strong bottom formation. With the retest of a major horizontal support area, Intel is respecting clear market structure. Quite likely therefore that Intel will soon start its next major higher timeframe bullrun.
📝Levels to watch:
$25
SwingTraderPhil
SwingTrading.Simplified. | Investing.Simplified. | #LONGTERMVISION
INTC trade ideas

$INTC - Best in the sector against Trump tariffsIntel is a semiconductor technology giant, renowned for its x86 processors that dominate the CPU segment, top revenue in Q2 2025 came from PC chips (Client Computing Group, ~$7.9B) and server/AI chips (Data Center & AI, ~$3.9B) . Other revenue includes foundry services ($4.4B) and legacy businesses ($1.1B).
But, for the last 4 years the company has experienced one disaster after another:
- Loss of Market Share & Intensified Competition vs AMDs Ryzen and NVIDIA AI GPUs has been major drivers for last 4 years of decline.
- Gross margin dropped to around 38–39% in 2024—a steep fall from pre‑pandemic levels above 60%, while NVIDIA maintained margins above 75%.
- Intel perpetually lagged in transitioning to advanced nodes (7 nm, 5 nm), resulting in costly delays and reduced competitiveness .
- Credit rating downgrade: In August 2025, Fitch downgraded Intel’s credit rating from BBB+ to BBB (negative outlook) due to weak demand and deteriorating profitability . S&P had already downgraded Intel to BB+, and Moody's also cut its rating in 2024 .
Recent events and price action show its time for a buy at these prices.
- Spin-off of Network & Edge (NEX) group: Intel announced the spin-off of its Network and Edge Group (NEX) into an independent entity focused on critical communications and networks, seeking external investors while retaining a major stake .
- Workforce reduction and factory cancellations: Intel confirmed layoffs of ~24,000 employees (~15% of workforce) and cancellation of chip plant projects in Germany and Poland . New CEO Lip-Bu Tan plans to cut the headcount to ~75,000 by year-end 2025 .
- Executive departures and internal reorganization: Three corporate VPs (Kaizad Mistry, Ryan Russell, Gary Patton) announced retirement from manufacturing operations amid deep restructuring . Intel also cut its manufacturing capacity planning and engineering teams as part of an efficiency-driven reorganization .
- Recent key products/services: Intel launched new Xeon 6 CPUs for AI workloads (e.g. Xeon 6776P) and is preparing Panther Lake CPUs (PCs) for 2025 . It also began 18A node production in Arizona and sold part of its Mobileye stake (~$922M) to boost liquidity .
Price/sales: Intel (0.80), AMD (10.3), NVIDIA (29.6), QCOM (3.68)
Wrap-Up
Intel's last four years have been marked by a series of structural, competitive, and strategic challenges—ranging from manufacturing delays to margin erosion and intense pressure from rivals like AMD and NVIDIA. Yet, the tide may be turning. With decisive actions like major cost-cutting initiatives, new AI-focused products, and progress in advanced node production, Intel is signaling a strategic pivot. Trading at a deep discount relative to peers based on the price-to-sales ratio, the stock reflects much of the past negativity. For investors seeking a long-term turnaround play in the semiconductor sector, now could be the moment to re-evaluate Intel’s potential.
Let’s see if this chip giant can turn the corner. Cheers!
Pablin
$INTC looks good for at trade to the upside? Targeting $34+?If we look at the chart, we can see INTC failed the breakdown of an H&S, retested the trendline breakout and seems to be heading higher.
Failed breakdowns are usually the most bullish patterns.
I could see the possibility of a large move here to go back and retest the $34 region, or potentially even go higher ($40+) if we can surpass that resistance.
Being price fell so quickly from March until now, I can see a sharp move higher (maybe on some news?).
Let's see what happens over the coming weeks.
CryptoWolfy - Why you should all buy $Intel right now🔍 Why Intel Is a Good Buy Right Now
1. Strategic Leadership & Restructuring
Intel’s new CEO, Lip-Bu Tan, has initiated a bold turnaround strategy focused on financial discipline and operational efficiency 1.
The company is cutting unnecessary capital expenditures and streamlining its foundry operations, aiming to become a more agile and focused organization 2.
2. AI & Chip Innovation
Intel is investing heavily in AI accelerators and energy-efficient chips, positioning itself to compete with NVIDIA and AMD in emerging AI workloads 3.
Its Xeon 6 CPUs are already being used in NVIDIA’s DGX B300 systems, showing early traction in high-performance computing 2.
3. Domestic Manufacturing Advantage
With most of its chip-making facilities in the United States, Intel is better positioned to weather geopolitical tensions compared to competitors like TSMC and Samsung, which have exposure to China 3.
4. Financial Discipline & Cost Optimization
Intel is targeting $17 billion in non-GAAP operating expenses for 2025 and has already reduced its workforce by 15% 2.
It’s consolidating operations and slowing construction in less strategic areas to align spending with demand.
📈 Why Intel Could Rebound to $50–$60
1. Historical Valuation & Recovery Potential
Intel traded at $60 just a few years ago. A return to that level would require a combination of revenue growth, margin recovery, and improved investor sentiment 4.
2. Revenue Growth Scenario
If Intel can grow revenues by 12% annually, it could reach $65 billion by 2026, up from $52 billion in 2024 4.
This growth would be driven by new chip launches like Lunar Lake and Arrow Lake, which use advanced 3nm processes from TSMC.
3. Margin Expansion & P/E Multiple
Improving margins and a return to profitability could justify a higher price-to-earnings (P/E) multiple, potentially pushing the stock toward the $50–$60 range 4.
4. Analyst Optimism
Some analysts have set price targets as high as $62, reflecting a potential 200%+ upside from current levels 3.
Intel (INTC) Stock Price Rises 7% Amid White House RumoursIntel (INTC) Stock Price Rises 7% Amid White House Rumours
Intel (INTC) stock price surged more than 7% yesterday, making it the top performer in the S&P 500 index. The rally came on the back of a report in Barron’s stating that the US government is in talks to acquire a stake in Intel:
→ Intel declined to comment on Barron's report.
→ White House spokesperson Kush Desai stated: “Discussion about hypothetical deals should be regarded as speculation unless officially announced by the Administration.”
Meanwhile, Bloomberg reported that the Trump administration is negotiating with Intel over a potential US government stake in the company – a move aimed at boosting domestic manufacturing and supporting Intel’s plans to build a new facility in Ohio.
The prospect of state backing for the American chipmaker triggered a sharp bullish impulse yesterday, which could extend into today. In pre-market trading, INTC shares are hovering around $25 – their highest level since March.
Technical Analysis of INTC Shares
Previously, when analysing the INTC chart, we highlighted the significance of the $20 level, which appeared to act as strong support from major market participants. This may have reflected expectations that the government would not abandon a strategically important US company during challenging times – particularly in the context of technological rivalry with China.
For months, INTC shares had been in a downtrend (as shown by the 100- and 200-period moving averages). However, yesterday’s sharp rally now appears capable of reversing that trend:
→ Lower highs and lows at points A, B, and C had suggested a lower low at point D. Indeed, the price came close to setting it after a disappointing quarterly earnings report on 24 July, which led to a large bearish gap at the market open on 25 July.
→ Today, we may see the price break above point C’s high, signalling a potential end to the bearish market structure.
Candlestick analysis this week highlights strong bullish momentum:
→ On Monday (indicated by an upward arrow), trading opened with a bullish gap. However, sellers became active near the upper boundary of the aforementioned bearish gap (marked with a rightward arrow), causing the candle to close with a long upper wick – a sign of weakness.
→ The next two sessions demonstrated that buying pressure persisted – on Tuesday, the stock opened with a bullish gap and rose steadily throughout the day, with Wednesday’s strong candle further confirming buyer activity.
→ Yesterday, the price confidently broke through resistance at $22.25, moving towards the $23.75 level, which could be breached today.
→ The RSI indicator is now at its highest level since February.
The INTC share chart may be signalling that the prolonged bearish market, which began in 2021, is undergoing a significant shift in sentiment. This could mark the early stages of a rally – one that would be fundamentally justified if Intel does indeed secure government backing.
This article represents the opinion of the Companies operating under the FXOpen brand only. It is not to be construed as an offer, solicitation, or recommendation with respect to products and services provided by the Companies operating under the FXOpen brand, nor is it to be considered financial advice.
Intel in Trouble or Ready for Redemption?There is growing potential for QUALCOMM Incorporated to acquire Intel.
I now believe that this development has advanced enough to warrant a fresh look at the stock
Qualcomm recently approached Intel about a takeover. According to WSJ , Qualcomm has expressed interest in acquiring Intel, which, if realized, would mark one of the most significant deals in recent history
Initially, this seemed like a long shot, with limited details emerging from the report. However, QCOM has continued to pursue the idea. Also QCOM has been in contact with Chinese antitrust regulators over the past month about this potential deal and is waiting until after the US presidential election to decide on making a formal offer. Since the election is just less than a month away, I believe this acquisition is becoming more of a possibility that investors should factor into their assessment of INTC. If a deal goes through, it’s likely that the acquisition will come at a premium to the current stock price, creating an opportunity for significant short term gains for investors
There is always a chance that no deal will occur. In that case, potential investors should evaluate whether the stock is worth holding as a long-term investment. My outlook here is not optimistic, and I’ll delve into INTC's competitive position, as indicated by its latest inventory data, in the next section
Given these two potential scenarios, I am upgrading my rating from "Sell" to "Hold." In summary, the possibility of QCOM acquiring INTC introduces a major upside catalyst that I hadn’t accounted for in my previous analysis. This potential acquisition helps offset some of the concerns about INTC as a standalone company.
Unlike many financial metrics that can be interpreted in different ways, inventory levels are more straightforward. He also explained that inventory trends can provide early indicators of business cycles. For cyclical industries, rising inventories can signal overproduction as demand wanes, while shrinking inventories can indicate strong demand
As shown in INTC’s most recent balance sheet, its inventory levels have generally been on the rise. For instance, in December 2014, inventory was valued at $ 4.273 billion, while the most recent figures show an increase to $ 11.244 billion. In some cases, rising inventory can signal business growth with increasing demand and production capacity, which was true for Intel in the early part of the last decade.
When inventory growth exceeds the pace of business growth, it becomes a red flag. In this scenario, rising inventory suggests weakened competitiveness and declining market position—an issue that Intel currently faces, in my opinion. The following chart helps illustrate this point, showing a comparison of days of inventory outstanding (DIO) for Intel and NVIDIA over the last five years, from 2020 to 2024. DIO is a measure of how many days it takes a company to sell its inventory
Given Intel's inventory buildup and declining competitive edge, I find its current valuation multiples hard to justify. Specifically, the chart highlights a comparison of price-to-earnings (P/E) ratios between Intel, NVIDIA, and AMD. Focusing on non-GAAP earnings estimates for fiscal years FY1 through FY3, Intel is currently trading with the highest P/E ratio for FY1 at 87.7 almost twice the multiple of NVIDIA and AMD, which are at 46.29 and 46.25, respectively
That said, the outlook changes somewhat when considering the years further ahead. For instance, in FY2, NVIDIA’s expected P/E ratio rises to the highest at 32.77, compared to Intel's 20.02 and AMD's 29.02. However, I want to emphasize the substantial uncertainty in Intel's earnings forecasts. As shown in the next chart, the consensus estimates for Intel's earnings per share (EPS) in FY 2024 range from a low of $0.15 to a high of $0.31 (a more than twofold variation) and from a low of $0.65 to a high of $2.1 (an almost fourfold variation). Given such uncertainty, I believe investors should be cautious about relying too heavily on forward P/E ratios too far into the future.
Both Intel and NVIDIA have experienced significant fluctuations in DIO over the years. Notably, both companies saw a spike in 2023 due to the COVID pandemic, which disrupted global supply chains. As the disruption faded, both firms saw a recovery (ie, a reduction in DIO). the difference in recovery is striking. Intel's DIO peaked at over 150 days in 2023 and has since decreased to 125 days a modest reduction but still above its historical average of 114 days. In contrast, NVIDIA's DIO surged to over 200 days but has rapidly dropped to 76 days, which is not only below its four-year average of 97.9 days but also near its lowest level in four years.
I expect Intel to face increasing competitive pressure as rivals like NVIDIA and AMD roll out their next-generation chips, particularly NVIDIA’s Blackwell chips. I recommend potential investors keep a close eye on inventory data, as it can signal changes in competitive dynamics for the reasons discussed here.
In addition to inventory issues and valuation risks, Intel faces a few other specific challenges. A significant portion of Intel’s current product lineup is concentrated in certain segments, such as PCs, which I believe are nearing market saturation plus a large share of Intel’s revenue comes from China. Given the ongoing trade tensions between the US and China, this heavy reliance on China poses a considerable geopolitical risk. These factors may limit Intel’s ability to adapt to technological advancements and shifting geopolitical conditions
The potential for a QUALCOMM acquisition has emerged as a new major upside catalyst. While my outlook on Intel’s business remains pessimistic based on the latest inventory data, the acquisition possibility partially offsets these negatives, leading me to upgrade my rating from Sell to Hold or if you are risk taker like Me, load the dip

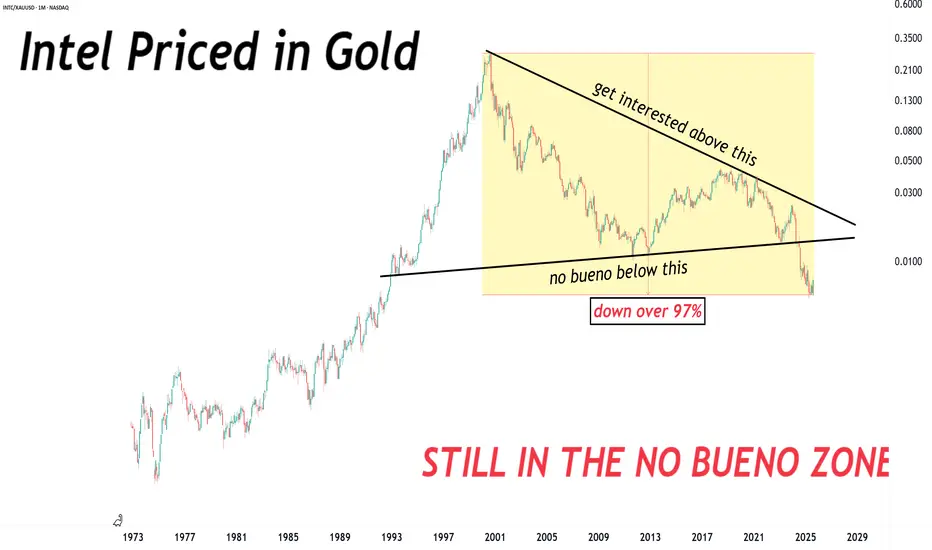
In real terms, Intel STILL in a massive down trend.In real terms, Intel STILL in a massive down trend.
Can take a while before anything playable morphs into existence.
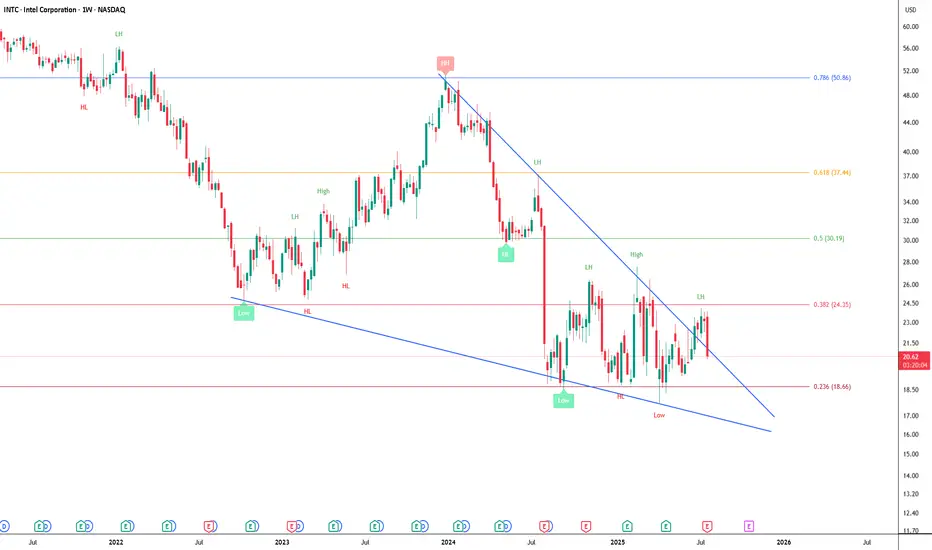
Intel Falling Wedge UpdateIntel Falling Wedge Pattern is not finished and still valid.
Failed to get above 0.382 so we could see $16-18, nice little gap to fill above the falling wedge trendline.
The pattern is valid on the weekly time scale.
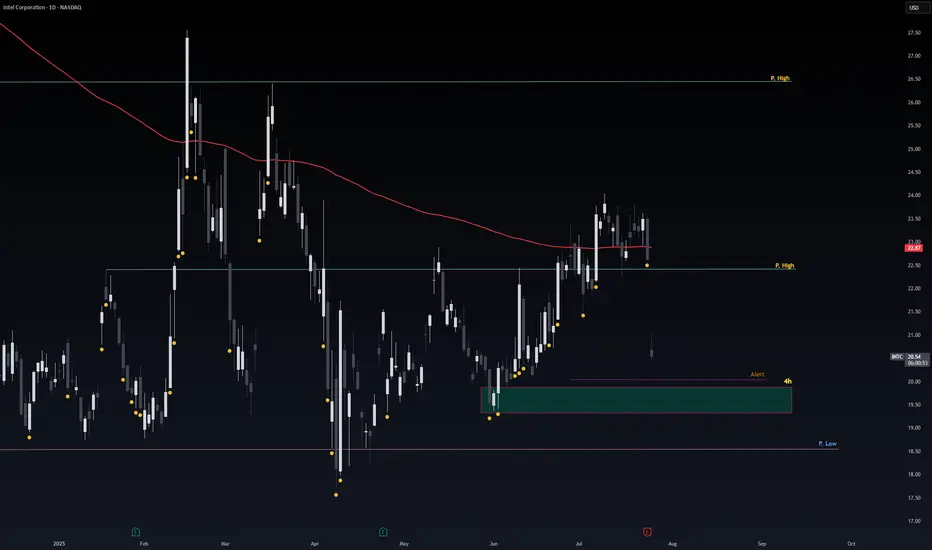
Safe Entry IntelThe 4h Green Zone is Safe & Strong Support for Intel.
If not respected the Pink Line is Second Strong support level.
Note: 1- Potentional of Strong Buying Zone:
We have two scenarios must happen at The Mentioned Zone:
Scenarios One: strong buying volume with reversal Candle.
Scenarios Two: Fake Break-Out of The Buying Zone.
Both indicate buyers stepping in strongly. NEVER Join in unless one showed up.
2- How to Buy Stock (safe way):
On 1H TF when Marubozu/Doji Candle show up which indicate strong buyers stepping-in.
Buy on 0.5 Fibo Level of the Marubozu/Doji Candle, because price will always and always re-test the
Intel: Still Not Cheap Enough?Intel has been falling for years, but some traders may think it’s still not cheap enough.
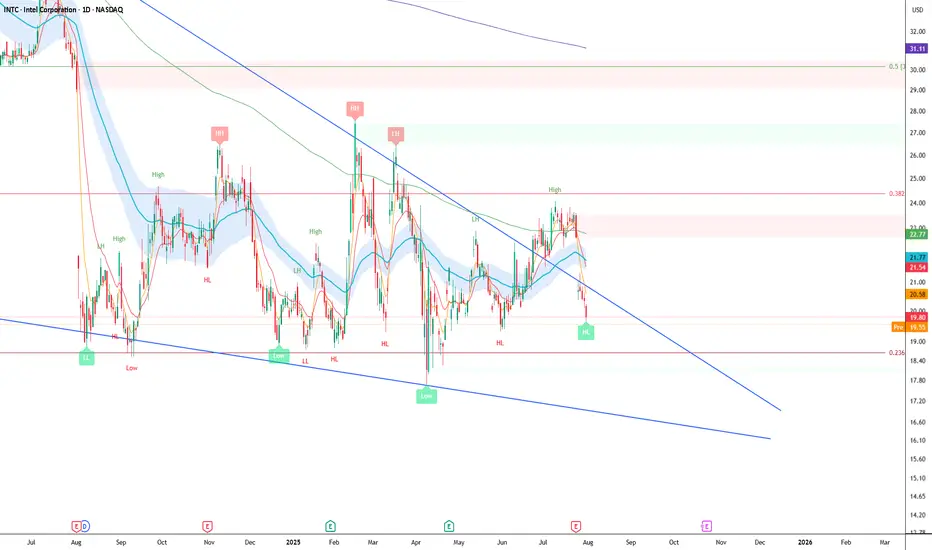
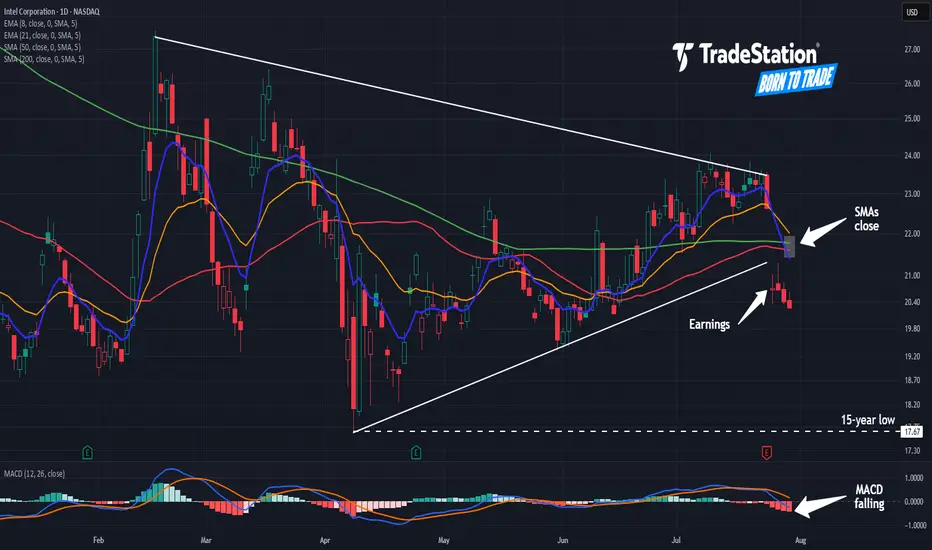
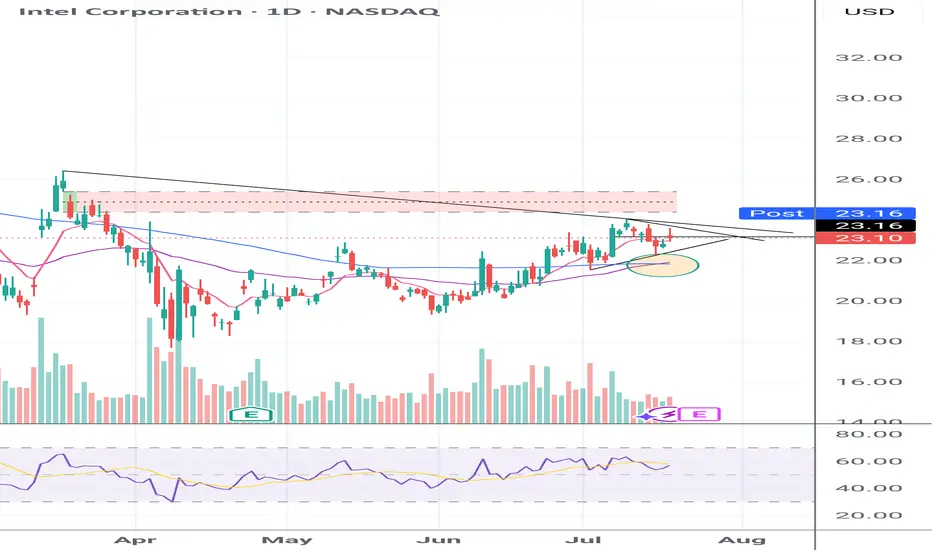
The first pattern on today’s chart is the series of higher lows since April, combined with lower highs since February. That converging range is a potential consolidation pattern.
Second, the chipmaker broke that range by gapping lower on Friday following a weak quarterly report.
Third, traders may eye $17.67 as the next important level. That April low was also the lowest price since August 2010.
Fourth, the 50-day simple moving average (SMA) inched toward the 200-day SMA this month but failed to cross above it. Is a longer-term bearish trend in effect?
Next, the 8-day exponential moving average (EMA) is below the 21-day EMA and MACD is falling. Both of those signals may be consistent with bearishness in the short term.
Finally, INTC is an active underlier in the options market. (Its average daily volume of about 350,000 contacts ranks 10th the S&P 500, according to TradeStation Data.) That could help traders take positions with calls and puts.
TradeStation has, for decades, advanced the trading industry, providing access to stocks, options and futures. If you're born to trade, we could be for you. See our Overview for more.
Past performance, whether actual or indicated by historical tests of strategies, is no guarantee of future performance or success. There is a possibility that you may sustain a loss equal to or greater than your entire investment regardless of which asset class you trade (equities, options or futures); therefore, you should not invest or risk money that you cannot afford to lose. Online trading is not suitable for all investors. View the document titled Characteristics and Risks of Standardized Options at www.TradeStation.com . Before trading any asset class, customers must read the relevant risk disclosure statements on www.TradeStation.com . System access and trade placement and execution may be delayed or fail due to market volatility and volume, quote delays, system and software errors, Internet traffic, outages and other factors.
Securities and futures trading is offered to self-directed customers by TradeStation Securities, Inc., a broker-dealer registered with the Securities and Exchange Commission and a futures commission merchant licensed with the Commodity Futures Trading Commission). TradeStation Securities is a member of the Financial Industry Regulatory Authority, the National Futures Association, and a number of exchanges.
Options trading is not suitable for all investors. Your TradeStation Securities’ account application to trade options will be considered and approved or disapproved based on all relevant factors, including your trading experience. See www.TradeStation.com . Visit www.TradeStation.com for full details on the costs and fees associated with options.
Margin trading involves risks, and it is important that you fully understand those risks before trading on margin. The Margin Disclosure Statement outlines many of those risks, including that you can lose more funds than you deposit in your margin account; your brokerage firm can force the sale of securities in your account; your brokerage firm can sell your securities without contacting you; and you are not entitled to an extension of time on a margin call. Review the Margin Disclosure Statement at www.TradeStation.com .
TradeStation Securities, Inc. and TradeStation Technologies, Inc. are each wholly owned subsidiaries of TradeStation Group, Inc., both operating, and providing products and services, under the TradeStation brand and trademark. When applying for, or purchasing, accounts, subscriptions, products and services, it is important that you know which company you will be dealing with. Visit www.TradeStation.com for further important information explaining what this means.
Intel looks to want $13Intel looks to be waiting below $24 resistance for $13 support. I wouldn't short it at it's current price, but I would be patient and wait for $13 if you're looking to buy. Good luck!

NVDA to save IntelThis may be one of the best entries you get to intel in your life time. NVDA just announced today that all of their new super computer systems are utilizing Intel chips alongside NVDA chips. This is going to push a huge surge in demand for Intel, and also help them get back on track with creating chips that the market/future market actually wants/needs.
This gives actual opportunity for Intel to turn the ship around and lead to years if not a decade of growth.
Hugely risky play. GL
Intel Failed to Get Above the 0.382When the CEO says he is cost cutting across the whole board, but discloses no plan for growth you get the pullback.
Made a LH on the weekly, but the daily still has a HL.
If it fails here, we could see $18 dollars or lower.
Falling Wedge Pattern is still valid.
To Frustration and Beyond! Welp... That Was That. And I Guess I Was Wrong.
(For now.)
Bears gonna bear, bulls gonna bull, and Intel’s still out here quietly building the Death Star while everyone’s chasing squirrel stocks hitting all-time highs. Yeah, we’re not mooning yet, but I still believe INTC will outpace most of the market on a YTD basis 2–3 years from now. Why settle for 50–100% gains when there’s a potential 200–400% monster comeback on deck? Even a smooth double to $50/share would dunk on most “safe” tech plays.
Analysis (a.k.a. my hopium-fueled thesis):
I’m still convinced this setup mirrors Pat Gelsinger’s 2023 run — but this time, without the rug-pull. Intel’s trimming the fat, locking in on its foundry moonshot, and going full Dragon Ball Z with a “laser focus” on margins and product execution. When they finally deliver a quarter with positive GAAP and non-GAAP EPS and beat expectations? That’s your ignition point for the mother of all squeezes. Until then, they’re still checking boxes and marching toward the target.
This sell-off? Overcooked.
I’m still holding, still in my leaps, and I’m not even thinking about touching that sell button until we fly past $70+.
Remember when people clowned AMD before Lisa Su pulled off the Zen-volution?
Yeah. Intel’s setting up for their own comeback tour. And I’ve got front-row seats. 🧠🚀📈
I'm still in it. Shares + Leaps....
You know the drill...
Disclaimer:
I am not a licensed financial advisor. The information provided in this content is for entertainment and informational purposes only, and should not be construed as financial or investment advice. All investments carry risk, and you should do your own research or consult with a qualified professional before making any financial decisions. Past performance is not indicative of future results. I may hold positions in the securities discussed.
INTC EARNINGS TRADE (07/24)
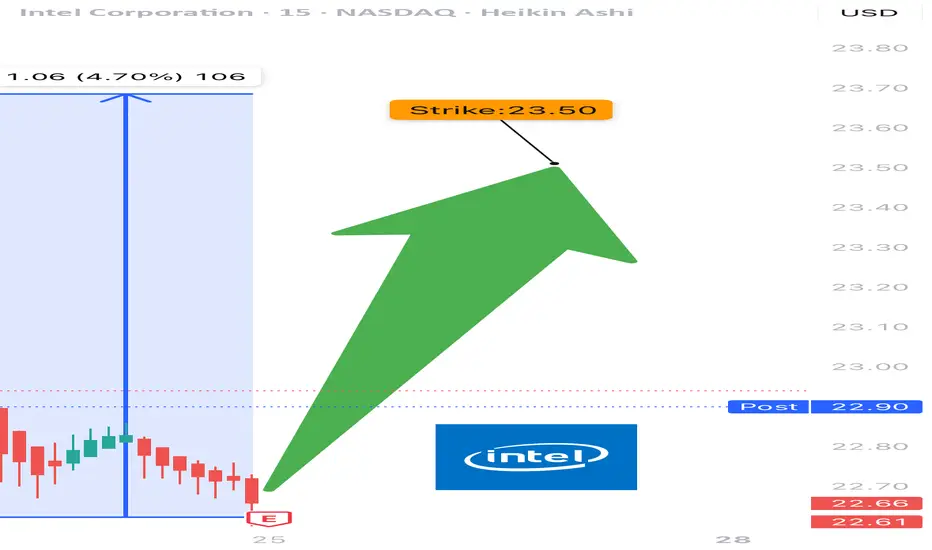
🚨 INTC EARNINGS TRADE (07/24) 🚨
🎧 Earnings drop after close — here’s the high-conviction setup 📊
🧠 Key Highlights:
• 💥 Surprise Beat Rate: 88%, avg surprise = 419%
• 📉 Margins: Ugly (-36% net margin) but improving sentiment
• 📈 Volume Surge + $24 resistance test = pre-earnings drift 🚀
• 🔎 Mixed options flow → cautious bulls leaning in
• 🎯 Sector: SEMI = 🔀 rotating hard, competition vs AMD/NVDA rising
💥 TRADE SETUP
🟢 Buy INTC $23.50 Call exp 7/25
💰 Entry: $0.59
🎯 Target: $1.18
🛑 Stop: $0.29
📈 Confidence: 75%
⏰ Entry: Before Earnings (Close 07/24)
📆 Earnings: Today After Market (AMC)
📊 Expected Move: 5%
⚠️ Play the earnings drift → gap up = profit. Miss = cut fast. Risk = defined. Reward = explosive.
#INTC #EarningsPlay #OptionsTrading #IntelEarnings #UnusualOptionsActivity #TechStocks #Semiconductors #TradingView #EarningsSeason #DayTrading #CallOptions
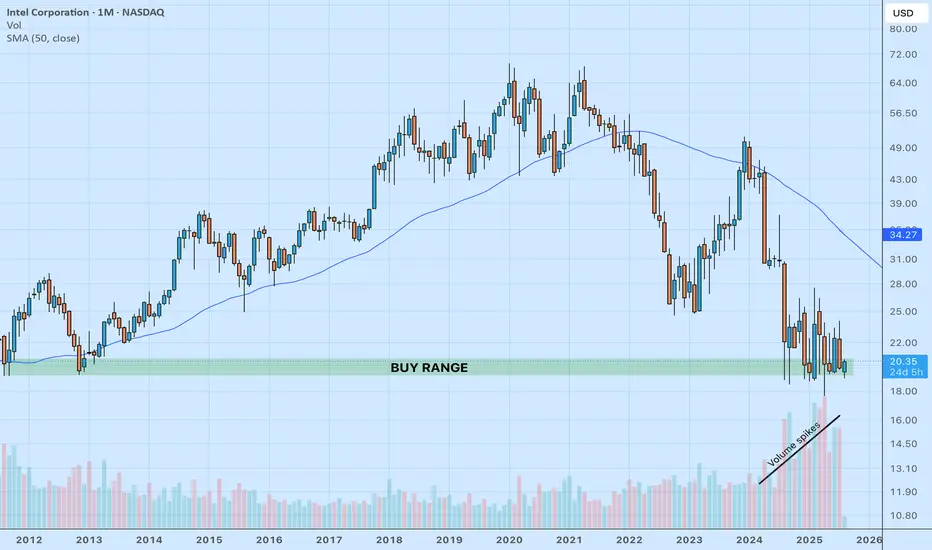
Intel to 40. A bet on America's chip when the chips are downIntel is an interesting stock. I made a bet on it this week. It’s very cheap trading at book value. Lots of bad news has destroyed this stock while other chip stocks are at all time highs. With a new CEO running the show and investing in next gen chip production, I think he turns it around.
I think it's at 40 within a year, and makes new all time highs after that.

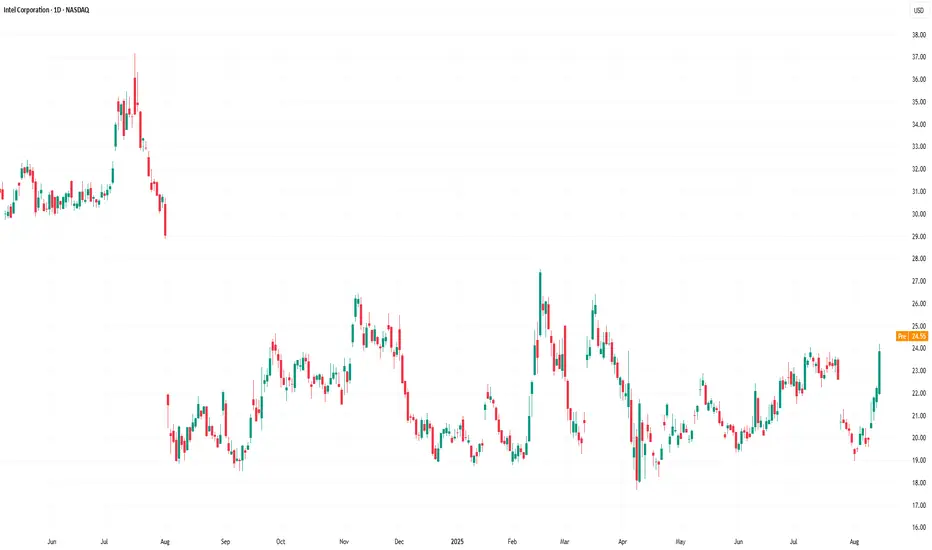
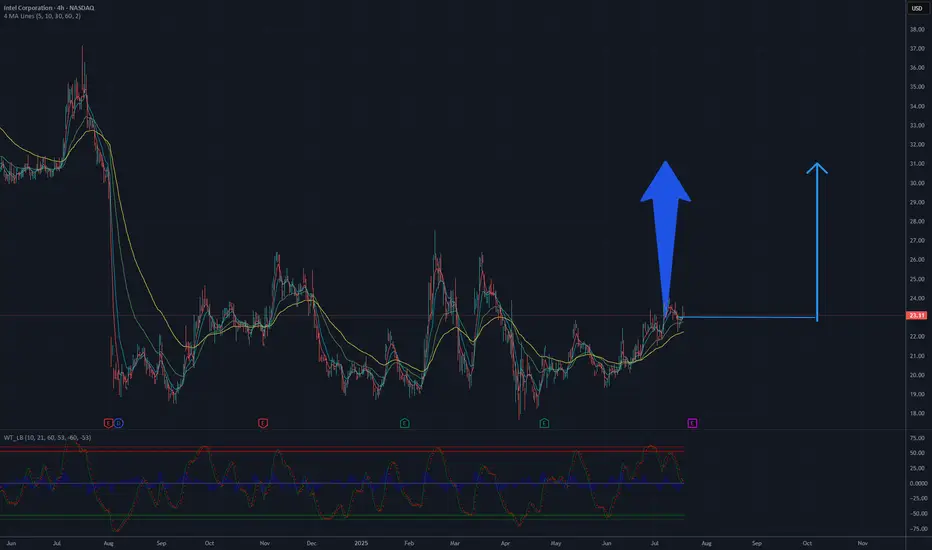
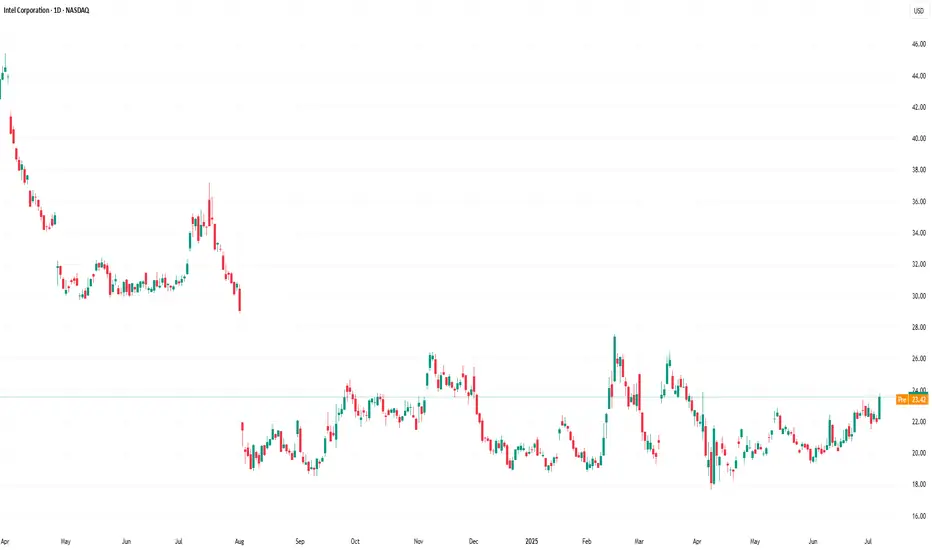
Is it a time for INTEL? 32 $ will be soon.The Intel Corporation (INTC) chart on NASDAQ illustrates the stock price dynamics from 2024 to July 2025. Initially, the price rose to a peak in the first half of 2024, followed by a significant decline, reaching its lowest point around 24 USD by the end of 2024. Since then, the price has been consolidating in the 24-26 USD range, which may signal preparation for a potential rebound.
The moving averages (MA) on the chart suggest a gradual convergence of lines, indicating a possible turning point. Oscillators at the bottom of the chart, such as RSI, may indicate oversold conditions, supporting the hypothesis of an upward move. The 26 USD level acts as a strong support, and breaking above 28-30 USD could pave the way to 34 USD, a previous resistance level.
A potential rise to 34 USD is plausible if the price maintains momentum and breaks through the resistance with sufficient volume.
Potential TP: 32 USD
Bullish?Anyone have any thoughts? Im thinking 9/19 24C. Its looking primed and I just saw the short squeeze news, not that it could really mean anything, but what do yall think?
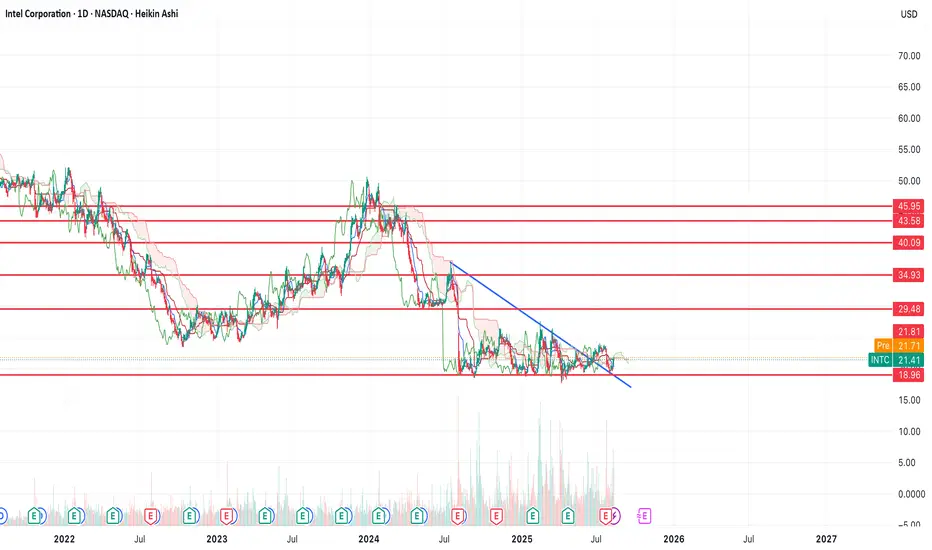
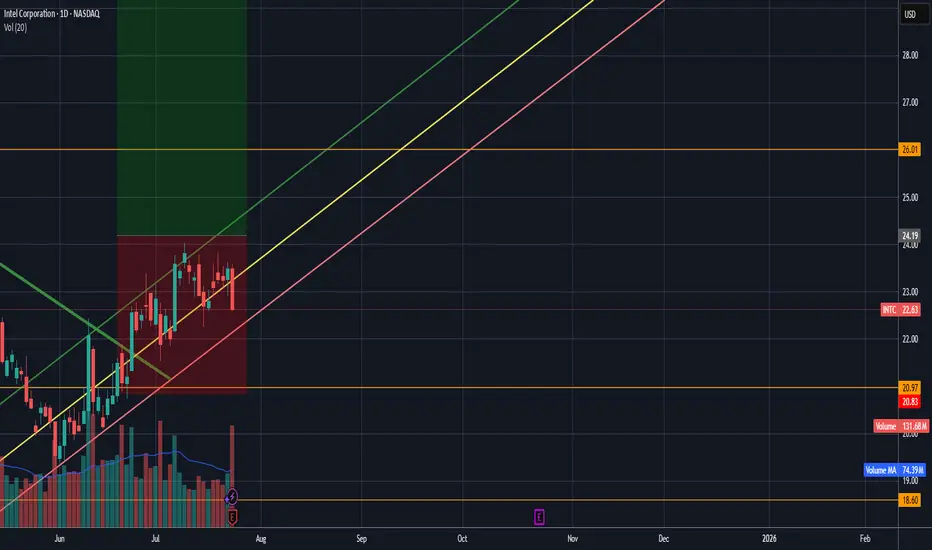
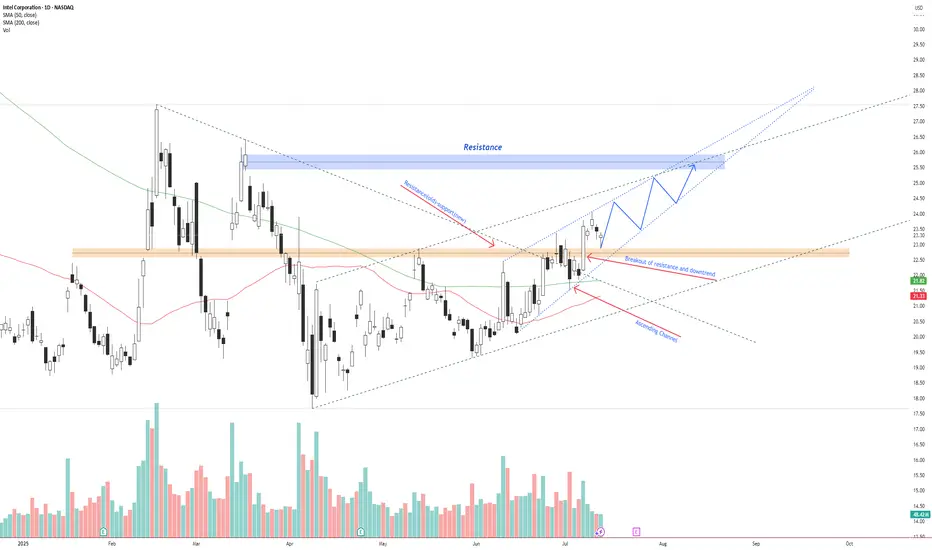
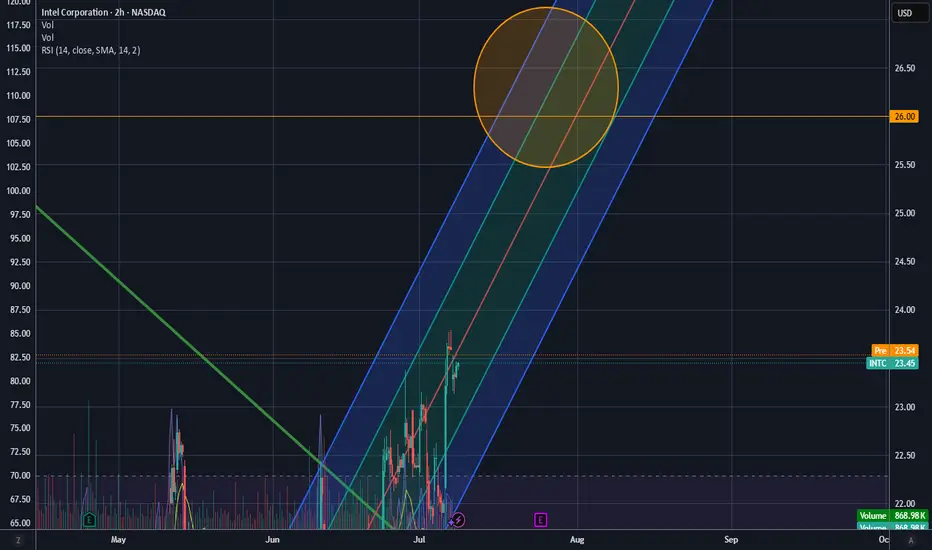
INTC – Breakout Confirmed, Bullish Continuation Inside AscendingIntel NASDAQ:INTC has broken above previous resistance and a descending trendline, confirming a bullish reversal.
Price is currently respecting an ascending channel and forming higher highs and higher lows. The breakout retest around $22.50 has held as new support.
If the current structure remains intact, price could continue toward the $26.00–$26.50 resistance zone. A breakout above this zone opens the door for a move toward $28+.
Key levels:
Support: $22.50 (previous resistance)
Resistance: $26.00–$26.50
Trend structure: Bullish channel
Volume supports the trend, and price is trading above both the 50 SMA and 200 SMA.
📌 Watching for a pullback and continuation move inside the channel.
This is not financial advice. Always do your own research.
I could be wrong.... but: Earnings breakout? Intel has certainly tested the patience of investors lately. That said, it’s in these moments — when sentiment turns and many walk away — that opportunity quietly builds. I’m maintaining my position, currently averaging around $24 per share alongside a sizable options exposure.
What makes this cycle feel different? It reminds me of Intel’s rally under Pat Gelsinger when the stock surged to $50, but this time the momentum seems more organic, driven by operational improvements and emerging tailwinds rather than speculative hype.
We’ll see how it plays out, but I’ve been meaning to put this out there: I’m still here, still holding, and watching this story unfold. Let’s go.
Intel Share Price Hits 3-Month High Without Clear CatalystIntel (INTC) Share Price Hits 3-Month High Without Clear Catalyst
Intel Corporation (INTC) stocks rose by over 7% yesterday, making them one of the top performers in the S&P 500 index (US SPX 500 mini on FXOpen). As a result, the stock price reached its highest level in three months.
What’s notable is the apparent lack of clear drivers behind the rally. According to Barron’s, the increase in INTC shares could have been triggered by a rating upgrade from Wall Street analysts or a corporate announcement – yet no such developments have occurred. "Nothing new or fundamental," says Mizuho managing director and technology specialist Jordan Klein.
At the same time, from a technical analysis perspective, the INTC price chart is showing significant developments. Examining these price movements may provide clues as to what’s fuelling the recent rise.
Technical analysis of INTC stocks
For many months, the share price had been confined within a downward channel. However, the psychological level of $20 acted as a strong support – repeated attempts by bears to push the price lower ultimately failed.
Bearish patterns in INTC’s chart may have led to a supply squeeze, as holders were given repeated reasons to sell (particularly against the backdrop of Nvidia’s success). Yet the bullish reversals near the $20 mark suggest that institutional interest was accumulating the stock at what was perceived to be a deeply discounted level – a characteristic sign of the Accumulation Phase in Wyckoff methodology.
It is this lack of available supply that could explain the sudden price rise in the absence of obvious news catalysts.
Since early summer, INTC shares have been making higher highs and higher lows, breaking upwards through the descending channel and beginning to form the early stages of a new bullish trend (highlighted in blue). Should fundamental catalysts emerge in the near term, they may serve as the spark to accelerate this nascent rally.
This article represents the opinion of the Companies operating under the FXOpen brand only. It is not to be construed as an offer, solicitation, or recommendation with respect to products and services provided by the Companies operating under the FXOpen brand, nor is it to be considered financial advice.
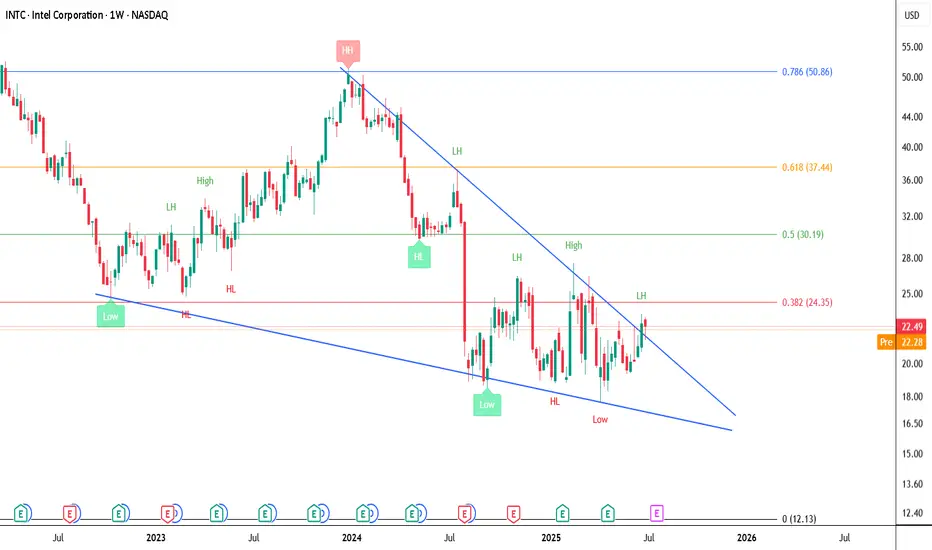
Intel Falling Wedge on the Weekly Time Frame.If we can hold and get above the 200 EMA on the weekly time frame then we can target the 0.382.
The main target would be the golden pocxket at 0.618.
The target is $50 located at the 0.786.
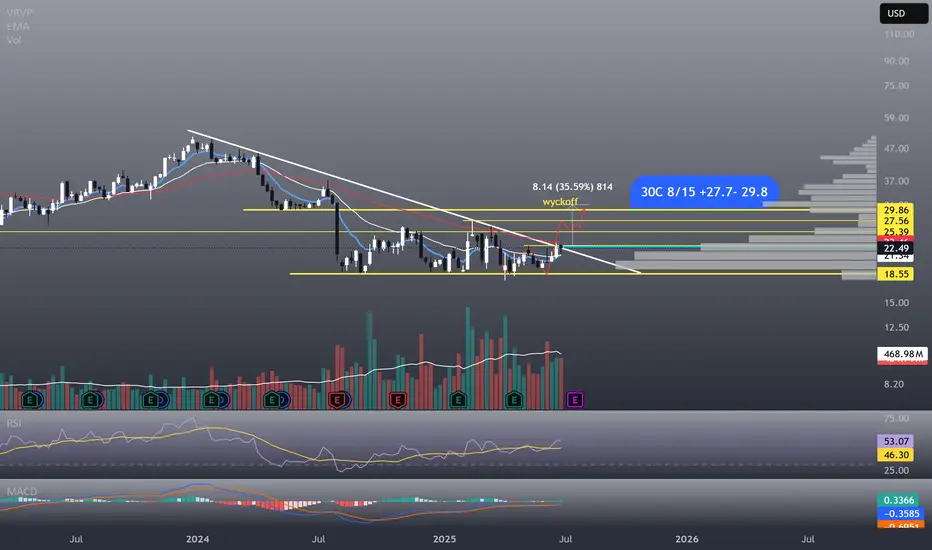
INTC wyckoff channel INTC technicals show its in a wyckoff channel with lots of accummulation over the past couple weeks-months; VPA confirms buyers are positioned already.
In case of a breakout it would look to close the gap, consolidate before continuing up.