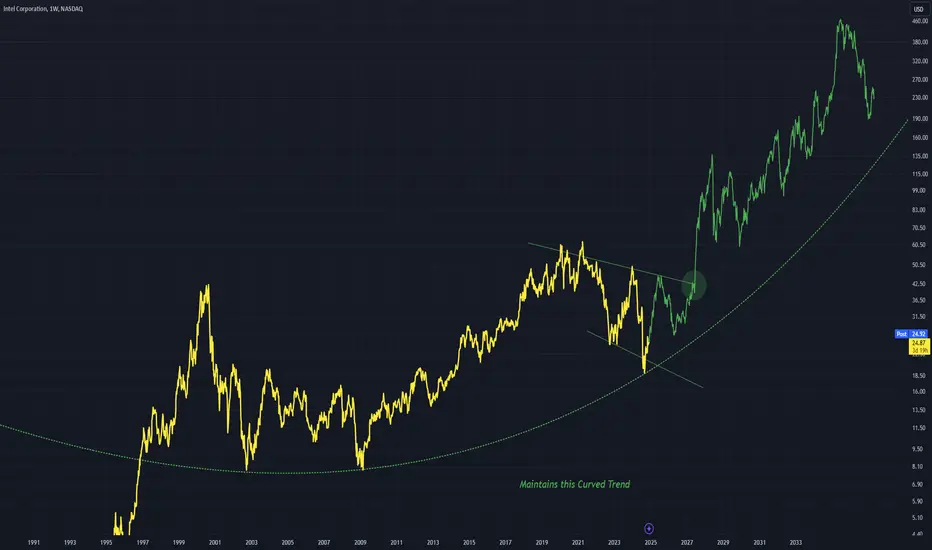
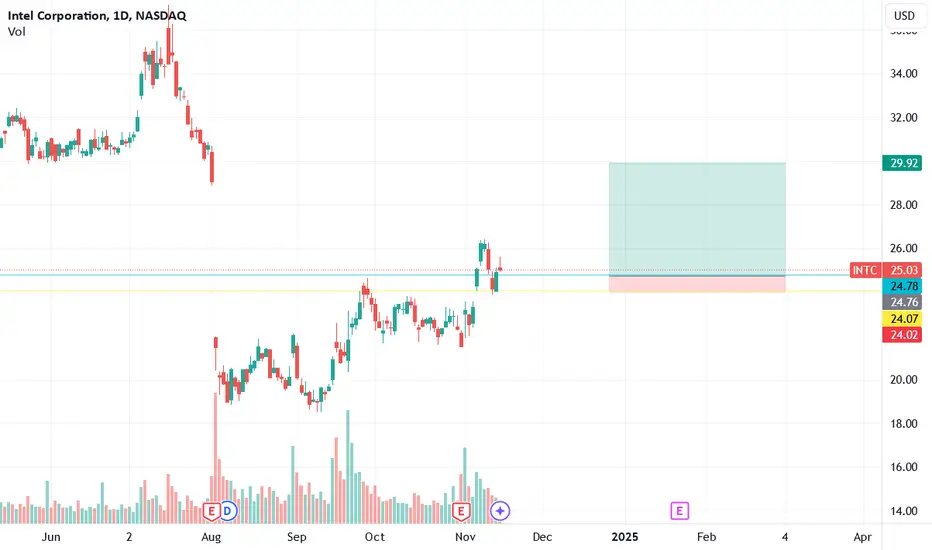
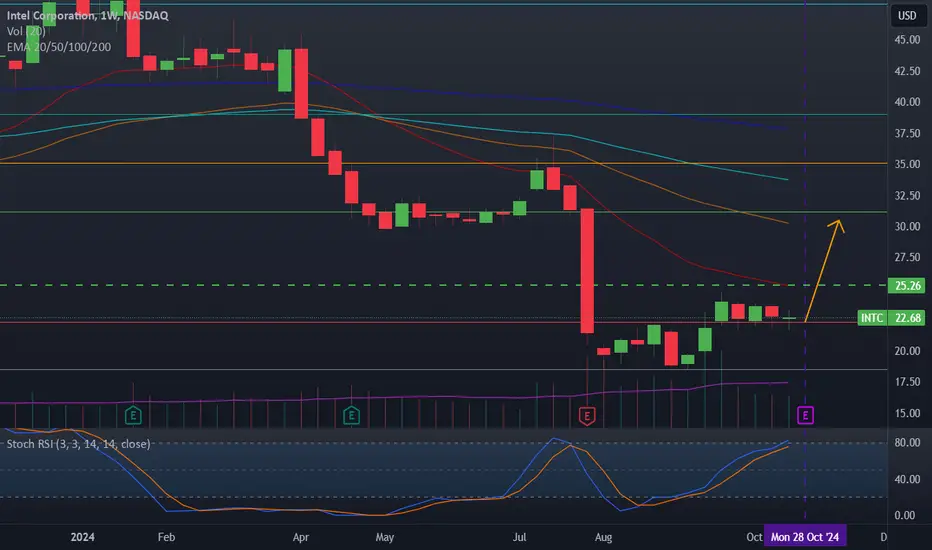
INTC - Short Term Bear MoveThe curved dotted line being touched by price right now is being tested to create this new curved up channel
If the green circle breaks to the upside this idea is good and the bulls are firmly in charge
Bullish on this Weekly timeframe
INTC trade ideas
Intel ValueWith Trump becoming president and Chinese US trade relations sure to to get heated, can't but help thinking that the abandoned chipmaker Intel still has a part to play in the future of chip production. Looking at $30 range retracement, options market currently is pricing $30 as fair value for a year from now, itm looks like best value on premium priced $30, although deep itm has slight discounts down to $28. Main thing is all premium even deep itm will not discount this stock as it is surely to rise over the next 12 months. Long itm leap calls $25c
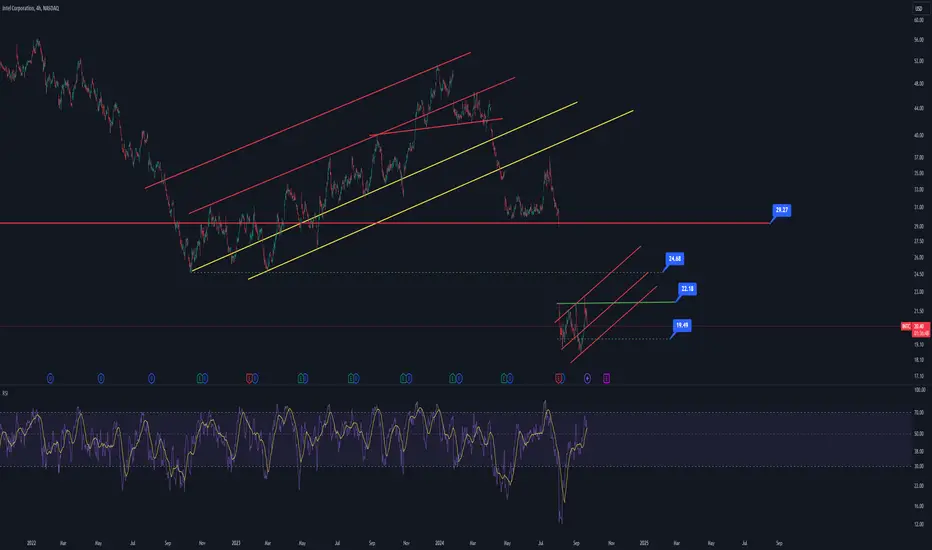
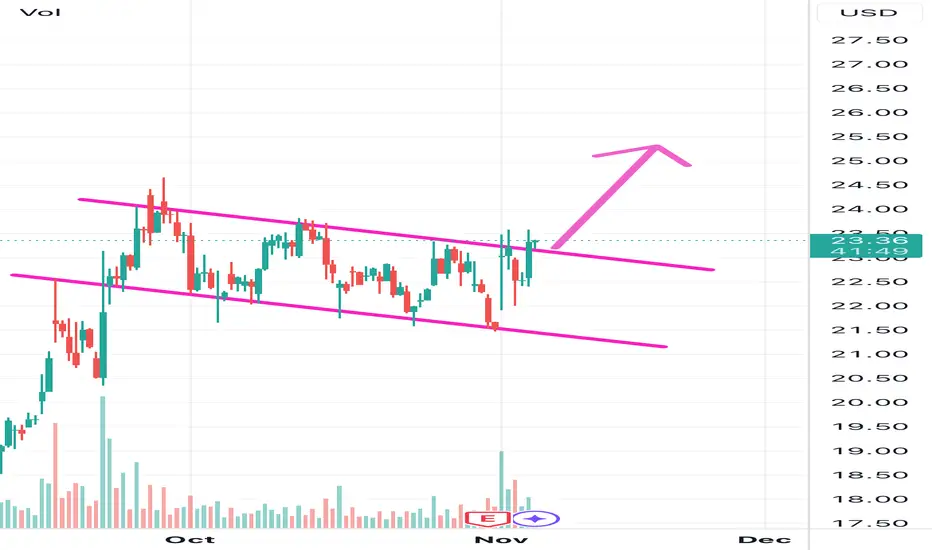
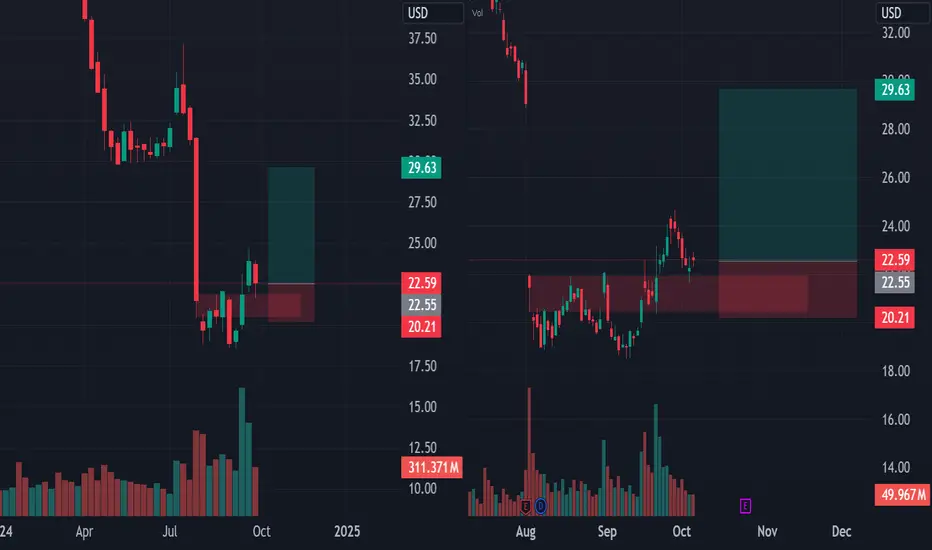
INTC: Channel playHello,
INTC likes to play in channels, a possible channel play is outlined here.
If you can catch the right channel, it's about 10% every swing.
Happy trading
NASDAQ:INTC
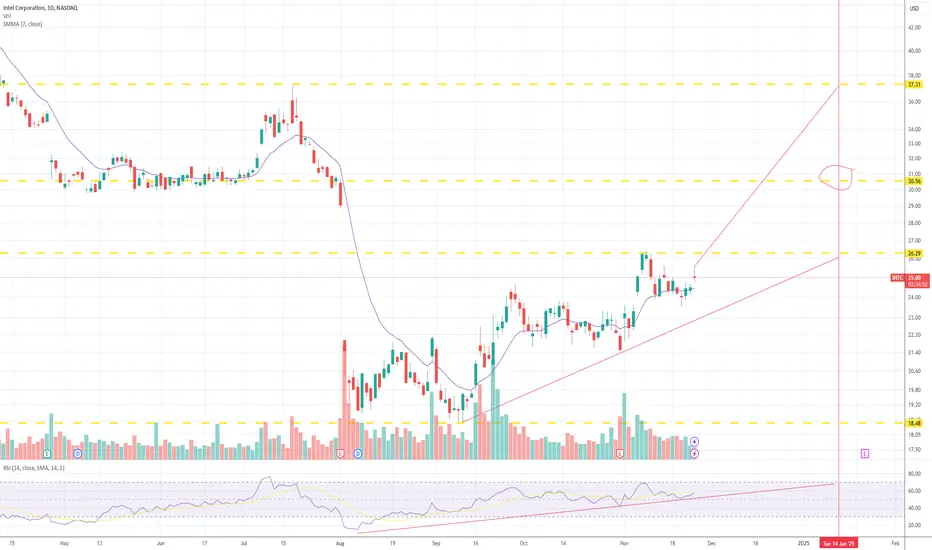
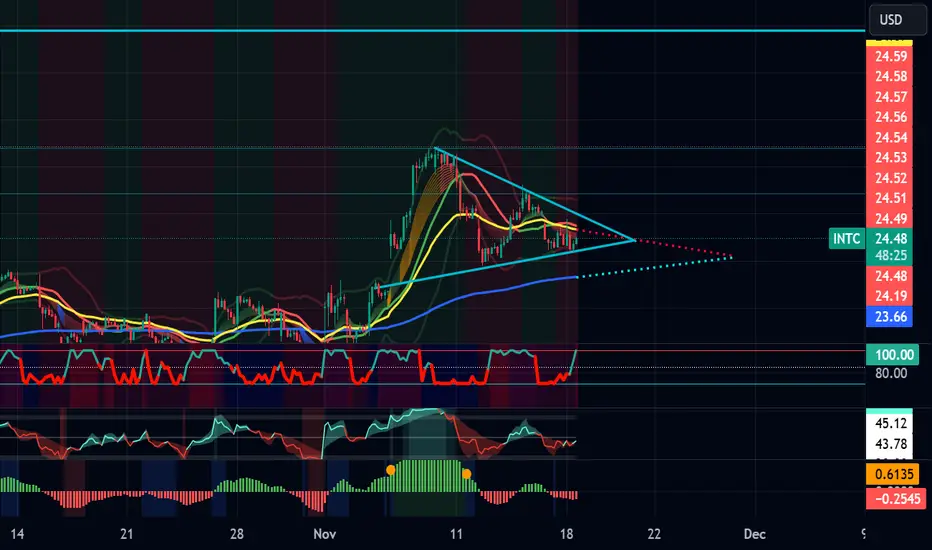
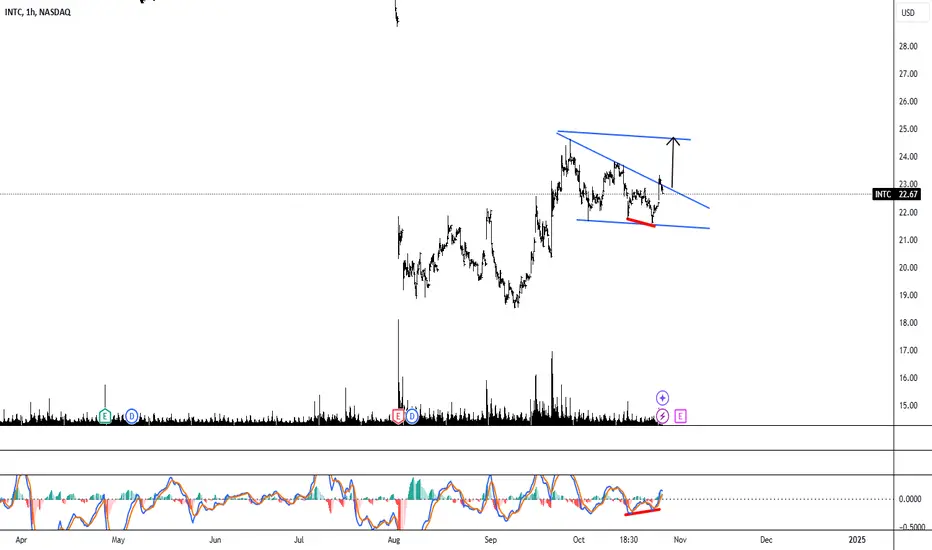
INTC about to breakout 26 to 28 stretched.INTC is forming a symmetrical triangle, indicating a period of consolidation as the price action narrows into the triangle's apex. This pattern suggests indecision in the market, with the potential for a significant breakout in either direction. The resolution of this triangle is likely to set the tone for the next move, however I have taken a bullish position. The price action is nearing the triangle’s apex, suggesting a breakout is likely within the next 3–5 trading sessions.
Watch for a volume spike to confirm the direction of the breakout. For a bullish breakout, take partial profits at $25.50, then hold for the full target of $25.89 to 28.00.
Entry Strategy:
Enter a long position if the price breaks and closes above $24.54 with strong volume.
This would indicate a bullish continuation, with the price likely to target higher resistance levels.
Profit Target Calculation:
Triangle Height:
Measured from $24.54 (upper resistance) to $23.19 (lower support), giving a height of $1.35.
Breakout Target:
Bullish Target: Add $1.35 to the breakout point ($24.54) → $25.89.
Bearish Target: Subtract $1.35 from the breakdown point ($23.66) → $22.31.
Stop-Loss Placement:
For a bullish breakout, place a stop-loss below the lower trendline at $24.19.
For a bearish breakdown, place a stop-loss above the upper trendline at $24.54.
I have already taken a position for 11/22/24 25C @0.28
INTCif 25 hold, going to 30
an upward trend in the prices of an industry's stocks or the overall rise in broad market indices, characterized by high investor confidence
Intel - Still Got Another +15% From Here!Intel ( NASDAQ:INTC ) is perfectly respecting structure:
Click chart above to see the detailed analysis👆🏻
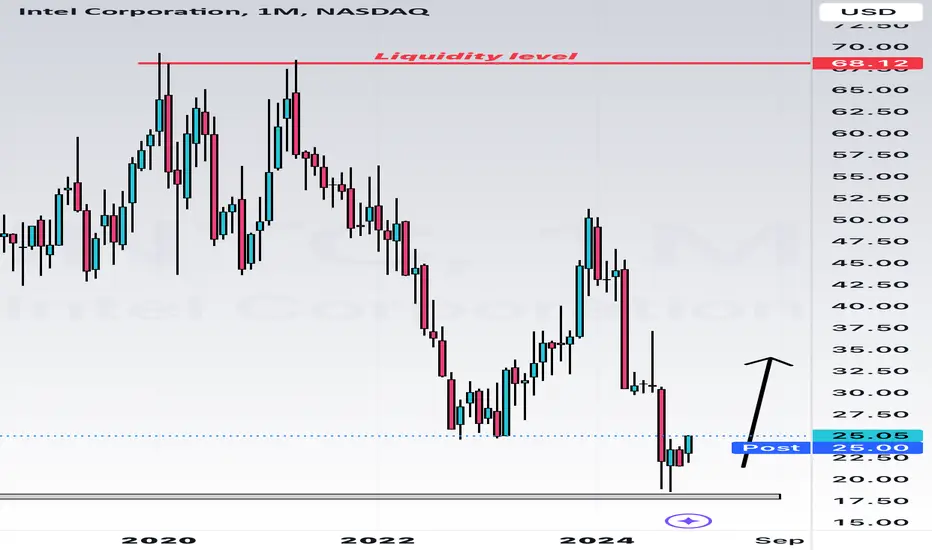
For more than two decades, Intel has not been trading in any clear trend. We saw a lot of swings towards the upside which were eventually always followed by corrections, making Intel a very easy to trade stock. After the current retest of support, a move higher will eventually follow.
Levels to watch: $20, $27
Keep your long term vision,
Philip (BasicTrading)

INTEL at $25 from $19 Low Hello Testosterone traders,
Election is finally over!
Intel stock has hit the $25 level coming from the low of $19.
Recently, Intel was kicked out of the SP 500 and replaced with Nvidia.
Intel liquidity sweep incomingDip beyond still on track.
Market makers giving a faulse bottom impression.
Could be wrong but could be the sweetest buy.
NO MONEY IN THE GAME.
NOT FINANCIAL ADVICE!!!

BullishIntel’s stock recently broke out of a bullish flag pattern, indicating a potential uptrend with a target around $25. However, performance struggles and past volatility may impact this rally.
N/b just a speculative analysis
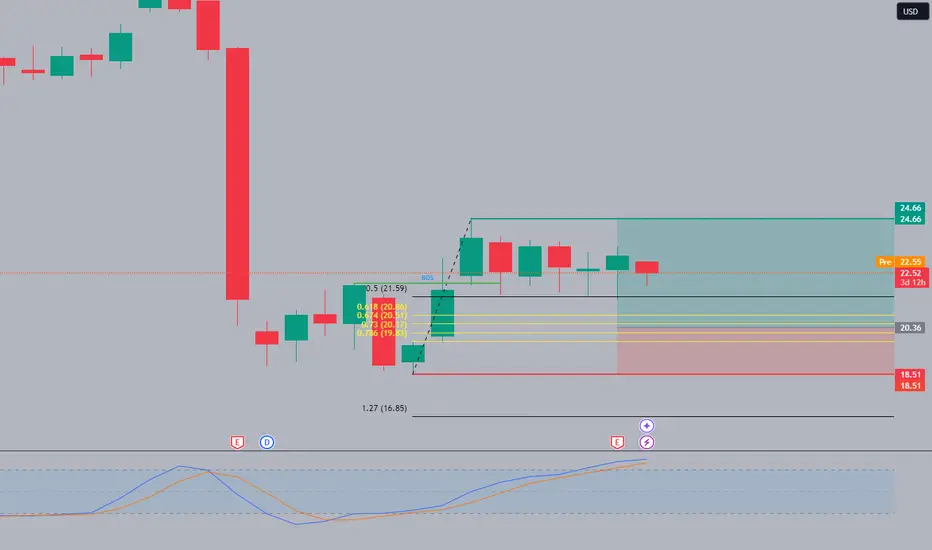
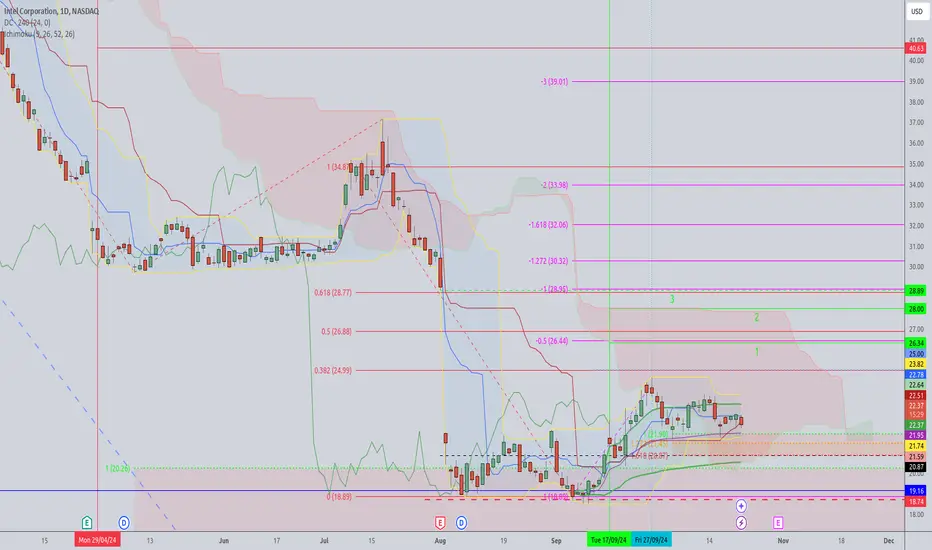
Long from oversold conditionsLimit buy orders waiting on yellow numbers marked. I also took a small position off of the 0.5. The market is very oversold, and one look at the fundamentals tells you why that is. However there is potential for a buy out. Should this happen you would expect a short term push upwards. The technicals look really good to me and meet my conditions. The conditions are, liquidity sweep, break of structure, FVG created, entry on return to the fib areas marked. Additionally, currently the stock is correcting very nicely. Weekly momentum is overbought suggesting we could expect a deeper move down in the coming weeks, whilst monthly momentum is oversold. Lets see what happens !
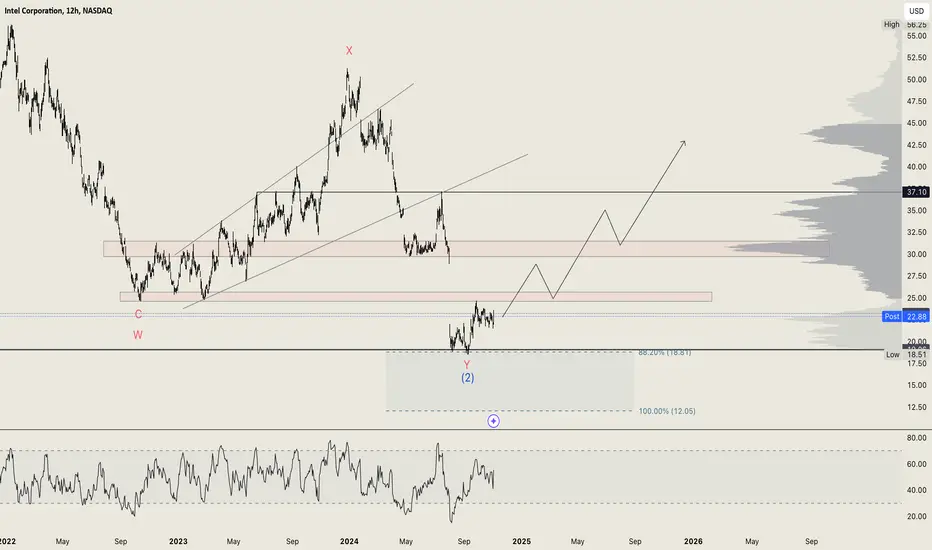
Intel (INTC): Patience is key while the market is rangingNothing significant has changed on NASDAQ:INTC since our last analysis. It appears that Intel may have found a bottom at the 88.2% Fibonacci level, but the stock has remained in a range since then. Unless the resistance level above is reclaimed, we wouldn’t be surprised to see continued ranging behavior.
Even Intel’s latest earnings report didn’t create much movement. Despite posting a considerable net loss due to impairment and restructuring charges, Intel projected fourth-quarter revenue above estimates. As one of the largest producers of PC chips, Intel has recently benefited from renewed demand for PCs, driven by on-device AI features and a fresh Windows update cycle. These factors allowed Intel to exceed Wall Street’s low expectations, but not enough to break the current range.
We’ll continue to monitor NASDAQ:INTC , but as it stands, trying to long it into the overhead resistance doesn’t make sense from our perspective. Patience is often the best strategy in such uncertain market conditions.
INTC 6h Bear ABCDThe bullish 5-0 harmonic broke down to stop loss. A bearish AB=CD harmonic is stronger, and will take price back sharply to recent lows before bullish reversal can continue.

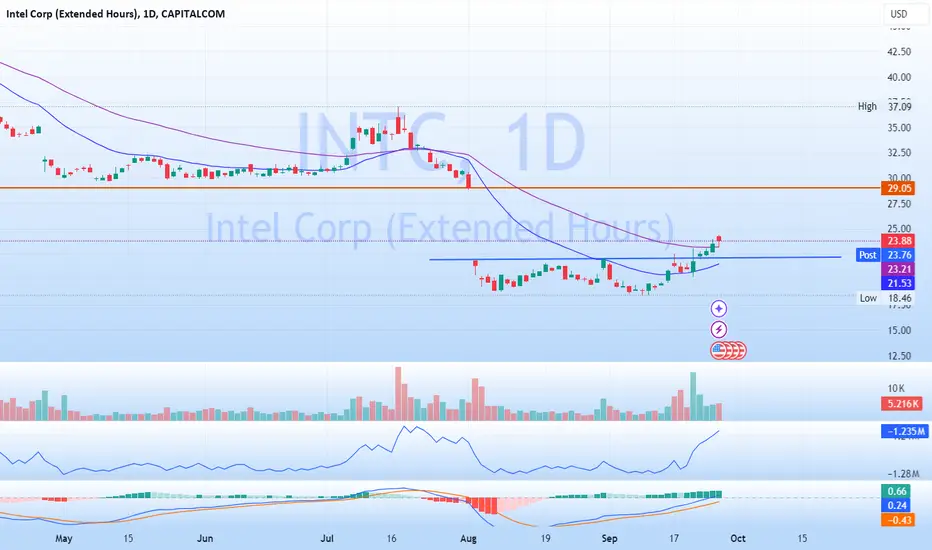
Will Intel play catch-up?CAPITALCOM:INTC has vastly underperformed its peers for a long time, but there might be signs the stock will start to move in the right direction. There has been a lot going on with the company this last week, maybe the chart will show some improvement.
Price has broken resistance recently and closed above on Monday this week. It has since started building momentum, with indicators showing strength. MACD is rising, and On-balance-volume is confirming the uptrend. My first target would be for price to fill the gap created on Aug 2 when price dropped a whopping 25%. Once reached, we might see a slight pullback, however this should be temporary. Next speed bump might occur around $35.50 - $36.00 but that would be a 50% jump from the price today and will be more long term I believe, unless rumors of a takeover (or a massive investment) of the company becomes more solid. One more trigger one might want to wait for is the shorter EMA (i.e. 21) crossing the longer (i.e. 50).
Intel CorporationHello community.
Daily chart.
Accumulation zone plotted on the chart.
Simple moving average 200 periods oriented downwards.
Nice gap above the price.
Slight tendency to go back up, but it is timid.
End of the decline?
Make your opinion, before placing an order.
► Thank you for boosting, commenting, subscribing!

INTC buyingThere is a positive bullish wedge pattern and there is also a divergence between the price indicator and the MACD.
INTC likely to pumpAs intel searches for a catalyst to extend this initial pivot I believe earnings may provide this. With the stock recently trading as low as .6 price to book, I believe it remains undervalued. Remember there is a right price for any stock that makes money or is about to make money. My short term target is the 20 week moving average around 25$. I still believe the stock is valued at 28-32$ based on assets and cash flows combined.
INTC REVERSAL ?INTC in reversal area for now, or we succeed or fail!
If you are in the trade you must make space for the SL, because it could not do immediate reversal (enter range then reverse).
I will keep watching of how it's going, generally talking it's looking good.
If you haven't bought it yet, I would suggest to wait a bit more to get more confirmation regrading the reversal
SL BELOW 20.5
TARGET 29
* will update if there is any change in sentiment of the structure
* for any question drop them below, and HIT THE FOLLOW BUTTON
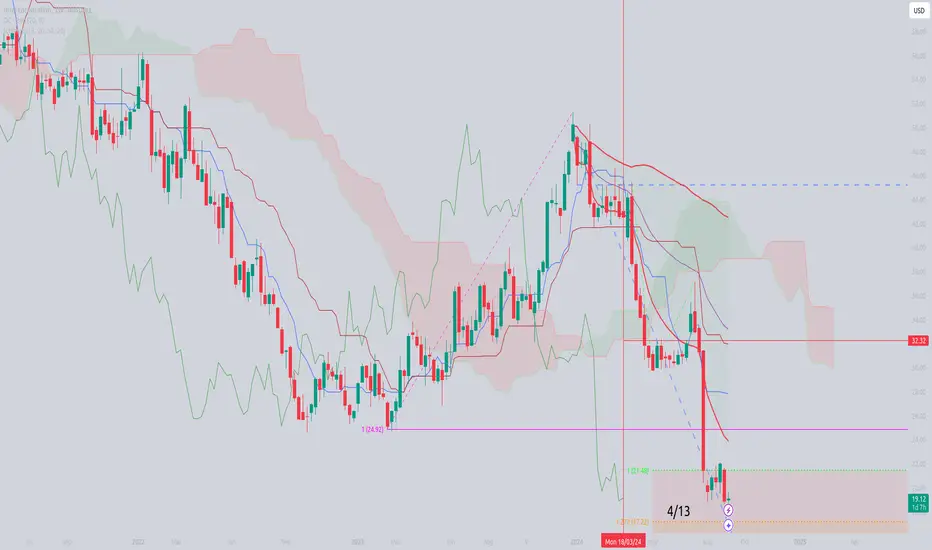
INTEL INTC just reboundingRebound goes on, PTs 38% and 50% retrace ent of the previous impulse (25.50$/27.90$).
Long term PT around 13$ (GFC levels).

Short INTC from $23.81 to $20.50 or channel bottomMODs have suggested that I provide more detail about the picks I make.
Sorry. I'm not as verbose as y'all, and I don't like things to be complicated.
My trading plan is very simple.
I buy or sell at top & bottom of parallel channels.
I confirm when price hits Fibonacci levels.
Bonus if a TTM Squeeze in in play.
I hold until target is reached or end of year, when I can book a loss.
So...
Here's why I'm picking this symbol to do the thing.
Price at bottom top of 3 channels
Stochastic Momentum Index (SMI) at overbought level
Impulse MACD is flat crossing over to the downside
Price at near Fibonacci level
In at $23.80
Target is $20.50 or channel bottom

Boring SidewardWe are sticking in a boring range. But the cloud is improving steadily.
I expect if not an outbreak so a test of the upper side of the range with little risk.
Long Time BottomWe must go back until 2010 to see the present bottom again.
After an almost 9 moth fall it is time for a bottom building.
This bottom is being built for over 1 month now and it is time to bet on an upward correction.
Is Intel getting ready to fill the gap?Technical Analysis Overview of Intel Corp (INTC):
Chart Overview
On the provided 45-minute chart, INTC appears to be in the midst of a larger Elliott Wave cycle. The labeling and wave structure indicate a strong corrective pattern, with potential for a new impulsive move higher. The key levels of support and resistance, highlighted by moving averages, also suggest possible near-term volatility as price attempts to break out of the current consolidation zone.
Wave Count and Elliott Wave Structure
You have highlighted the Elliott Wave count, indicating that the price has recently completed a Wave 4 corrective phase and is on track to enter the final impulsive Wave 5. The chart shows a resistance line around $26, which, if broken, could confirm the start of this next leg higher. Your focus on the gap north of $26 suggests that you are expecting price action to fill this gap, with a target likely near or above $27.00.
Wave 1 to 3: The clear impulsive movement seen during Waves 1, 3, and 5 aligns well with classic Elliott Wave theory. Each wave is subdivided neatly, reflecting smaller degree waves within the larger trend.
Wave 4: This appears to be a standard corrective phase, potentially forming a triangle or a flat, with multiple subdivisions that indicate exhaustion of selling momentum. The flattening of momentum indicators also supports this as a consolidation zone.
Key Indicators and Levels
Moving Averages: The MA 50 (22.43) and MA 200 (22.87) serve as critical dynamic support and resistance levels. The price has shown strong respect for these levels, bouncing from them on multiple occasions. A clear break above the MA 200 could serve as a confirmation of the bullish momentum heading into the next wave.
Support and Resistance Zones: You've highlighted $22.87 as a critical resistance level, with multiple moving averages clustering in this zone, creating a significant barrier that the price needs to break through to continue higher. The $23-$26 zone could act as a battleground, with traders closely watching for a break above $26.
Indicators and Momentum
RSI & Stochastics: Both are showing signs of recovery from oversold conditions. The stochastic oscillator crossing over indicates the potential start of a new uptrend. This aligns well with your expectation of a bullish move.
CVD (Cumulative Volume Delta): With a significant increase in CVD (772%), it suggests that buyers are stepping in aggressively after the correction, potentially driving the next wave higher.
Price Gaps
The most prominent feature on your chart is the gap around $26, which is also marked as a future target. Based on the "gap fill" theory, prices often return to fill gaps left behind in the chart, especially in bullish market conditions. This could be a significant motivator for market participants to push the stock higher. The resistance trendline intersecting around $26 could act as a trigger for acceleration, likely coinciding with positive market sentiment.
Market Sentiment & Psychology
Intel’s price action is likely reflective of the broader semiconductor industry, which has faced headwinds in 2023. However, recent earnings results and general optimism around the company's future plans have instilled renewed confidence among investors.
Bullish Catalysts:
AI & Data Center Growth: Intel has been positioning itself as a key player in the AI hardware space. This has created a lot of optimism, especially after the recent launch of AI-focused processors, which could serve as a key driver for future revenue growth.
Earnings Beat: Intel's recent quarterly earnings beat analyst expectations, showing resilience in the face of supply chain issues and industry slowdown. This has led to improved market sentiment, with many traders looking at this consolidation as a potential opportunity for further upside.
Wall of Worry & Sentiment:
The phrase “climbing the wall of worry” fits well with the sentiment that investors often have during corrective waves like Wave 4. Despite some lingering concerns about competition from rivals like AMD and Nvidia, and macroeconomic concerns such as inflation and interest rates, the underlying fundamentals of Intel suggest there is plenty of room for optimism. Often, as fear subsides and positive news emerges, stocks break out from these consolidation patterns, driving upward momentum.
Bearish Risks:
Any failure to break above key resistance could trigger further consolidation or even a deeper correction, potentially testing lower support levels. Negative sentiment around broader economic concerns, including geopolitical tensions, could also act as a headwind to any bullish progress.
Conclusion: Intel appears poised to break out of a consolidation phase and move toward filling the gap around $26. The completion of Wave 4, combined with positive market momentum and fundamental drivers, indicates the potential for bullish movement. However, traders should monitor key resistance levels closely, as any failure to break above them could prolong the current consolidation or trigger further corrective action.
Key Levels to Watch:
Support: $22.43, $21.51
Resistance: $22.87, $23.72, and the gap around $26
Summery by my custom Elliot Wave GPT

Intel Stock Analysis: Potential Uptrend AheadIntel Stock Analysis: Potential Uptrend Ahead
Based on recent price action, Intel's stock has reached a significant historical support level, leading to a rebound. An uptrend may develop if the company continues to enhance its management practices and successfully transitions into the growing AI sector.
