LULU trade ideas
Buying May $195 Puts- Insider sellingInsiders were selling in december before corona, stores closes in china and the US, 130 support WELL below current levels.
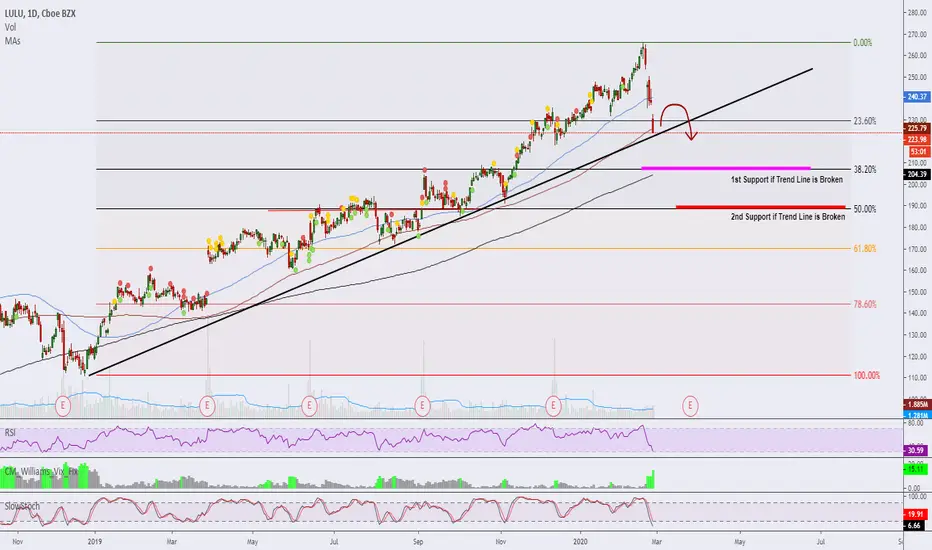
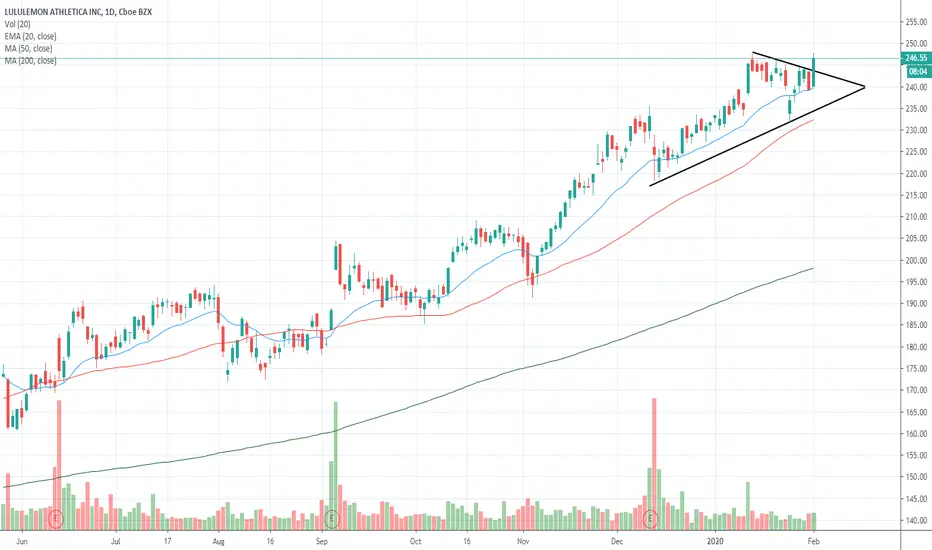
LULU nearing major trendlineIf NASDAQ:LULU breaks the black trend line above, next support would be at $207 and $189 for you shorts out there
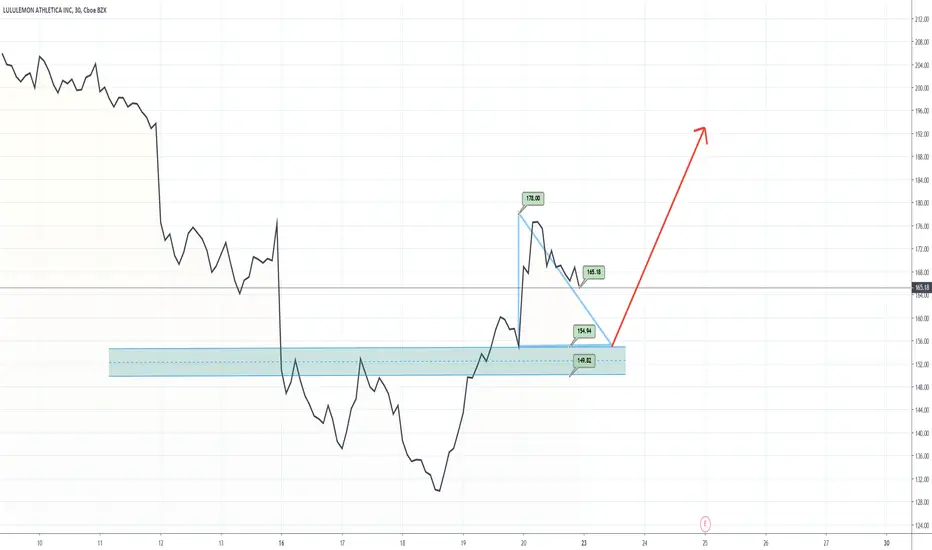
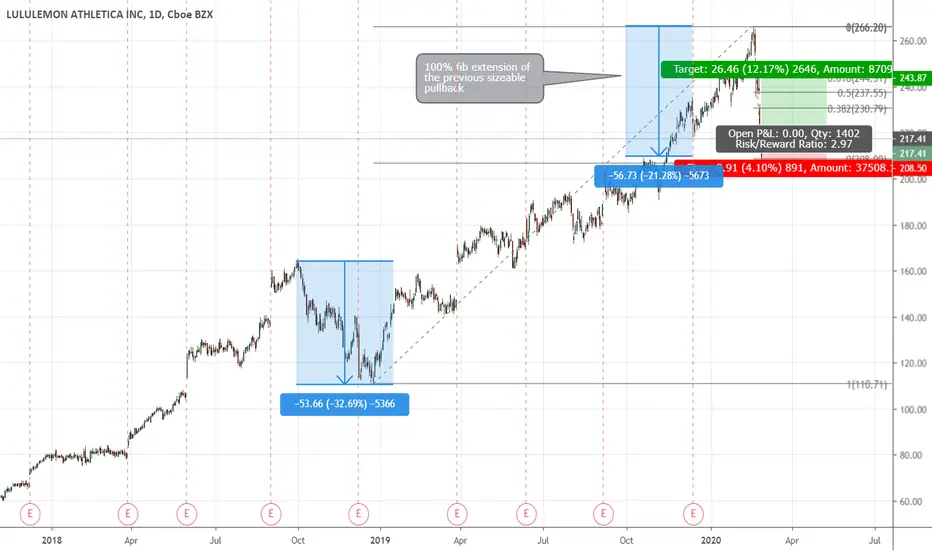
Time to get a piece of the lemonLululemon has fallen the same distance as the previous large decline in late 2018. it's starting to look attractive again especially with such a bullish close. I will long with a stop below the last candle low and expect it to close some gaps along the way up. Scale out as it reach the fib levels up and with trailing stops too

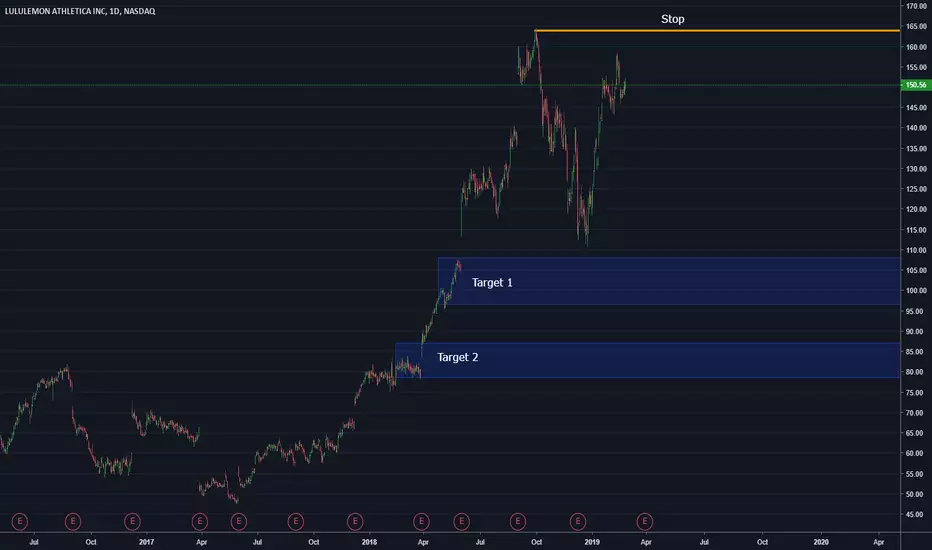
LULU setting up for a crashLULU seems to be setting up for a crash, retracing most of what it's gained in the past year.
With earnings coming in a few weeks, I think it's time.
I expect it to hit 110, if not retrace all the way back to 90's

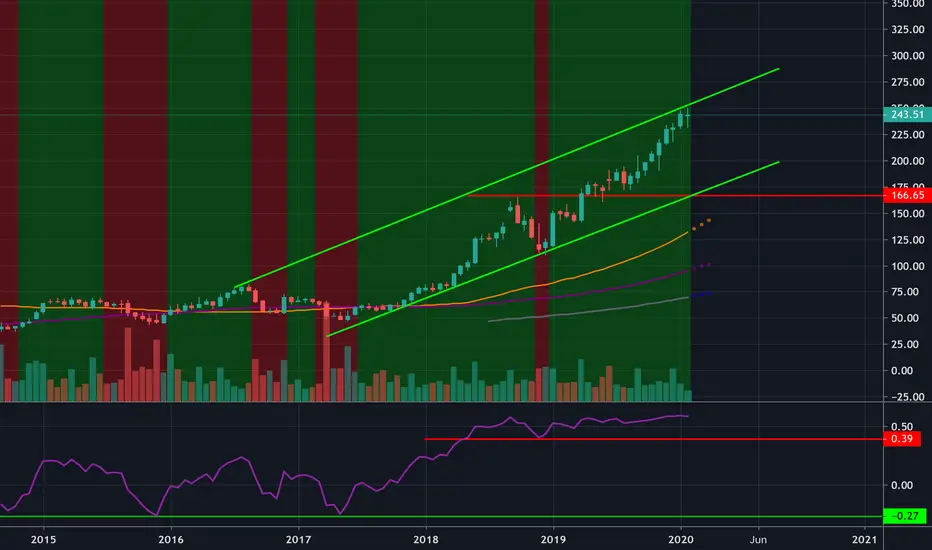
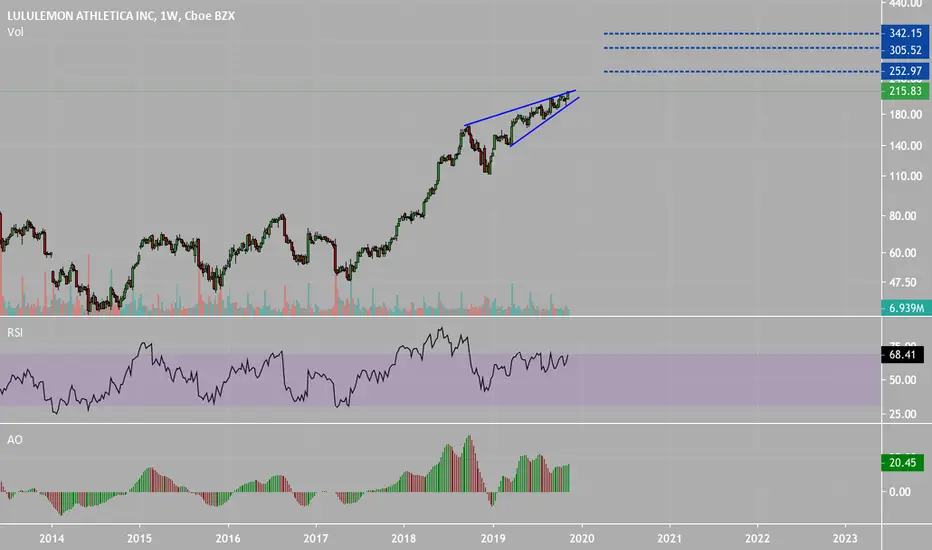
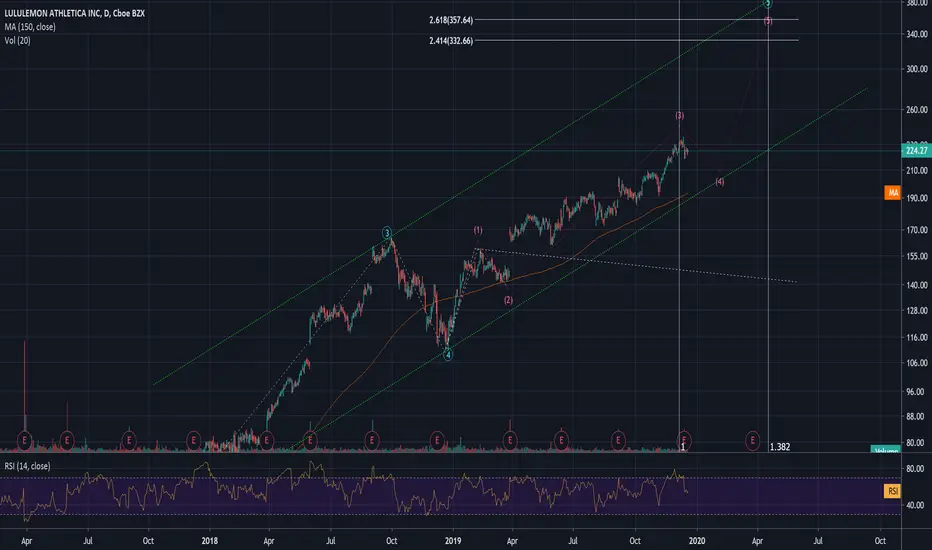
LULU 2. History lesson.So 1st wave on 14d chart back in the time of first Hyper Growth Period for LULU had 27 bars , and 2nd wave is somewhat 1/3 shorter.
Current 1st wave is counting 25 bars , and second is more then 2/3 of 25. so it should crack soon.
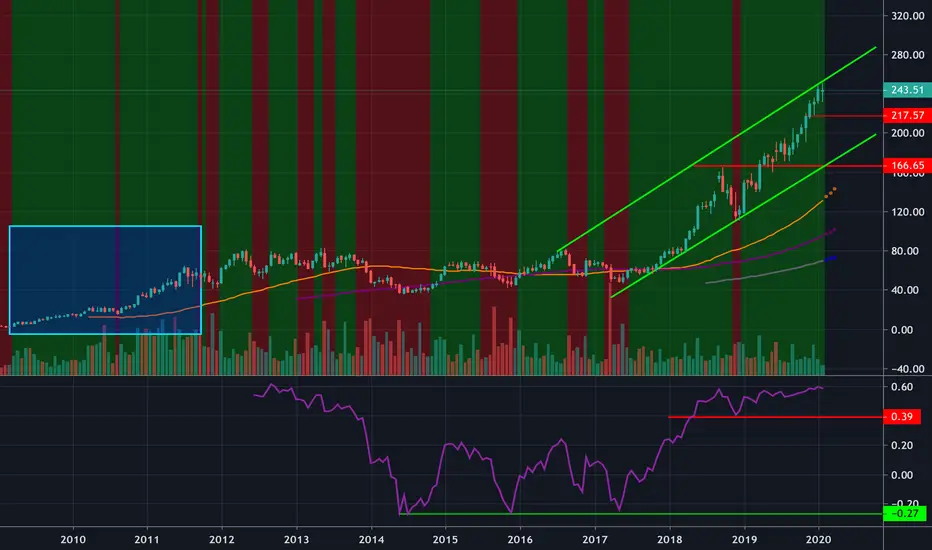
LULU OMG. This one is gonna crack. 14D , 2W chart... This is impressive for yoga pants company.. however it's a bubble.
watching to short as soon as divergence turns red.
Early BreakoutAscending Triangle breakout. The downtrend is broken, and hopefully this new ATH will turn into a model blue sky breakout!
Observation on LULU, upside breakout possible?DISCLAIMER: Already have a long position on LULU, possibly looking to add more on pullbacks.
Looking at the chart patterns it looks like a bull flag has developed on the 1, 5, and 15 minute charts. The price action is above the ichimoku cloud signalling a bullish move on the 1 and 5 minute charts. Looks like this could be preparing for a near term move to the upside once it breaks the bull flag channel.
Coupled with a good chart pattern developing, the price action has a good level of fundamentals as a company, LULU recently reported blowout numbers that were above expectations and adjusted guidance for the year upwards.
I am thinking on any pullbacks (10% or more) I'll probably add to the portfolio long term as LULU looks to be on par with NKE.

LULU target price $272Entry level $ 242 = Target price $ 272 = Stop loss $230
P/E ratio = 54
Short interest = 2.66
Average Recommendation:Overweight Average Target Price:$245.74
18 BUY
01 OVERWEIGHT
11 HOLD
01 SELL
Company profile
lululemon athletica, Inc. engages in the designing, distributing and retail of athletic apparel and accessories. It company operates through the following business segments: Company-Operated Stores, Direct to Consumer. The Company-Operated Stores segment comprises of lululemon and ivivva brands; and specialize in athletic wear for female youth. The Direct to Consumer segment is involved in e-commerce business. The company was founded by Dennis J. Wilson in 1998 and is headquartered in Vancouver, Canada.
PLEASE GIVE US A LIKE IF YOU FIND OUR CONTENT HELPFUL, IT IS REALLY APPRECIATED

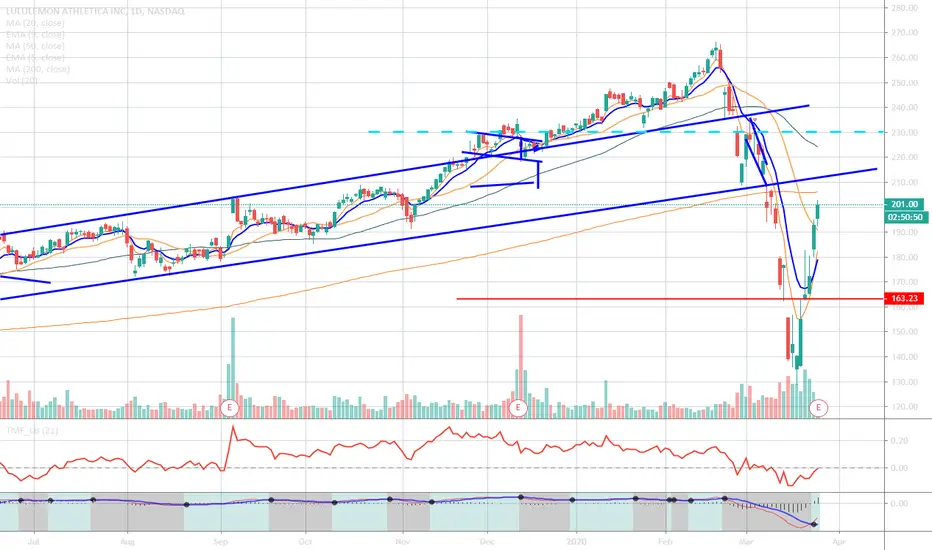
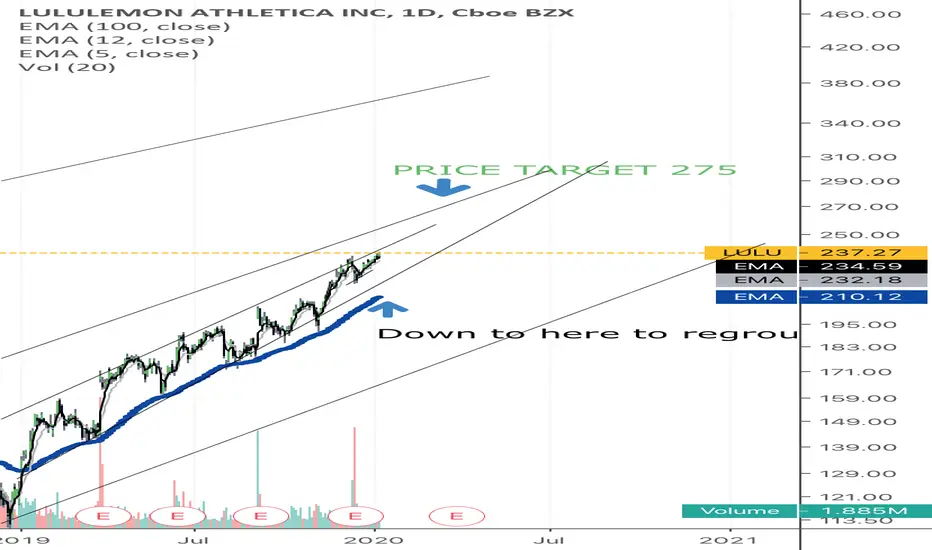
LULU -- going strong upwards trends -- may regroup as well.LULU -- going strong upwards trends -- may regroup as well --- riding parallel channels since March 2019
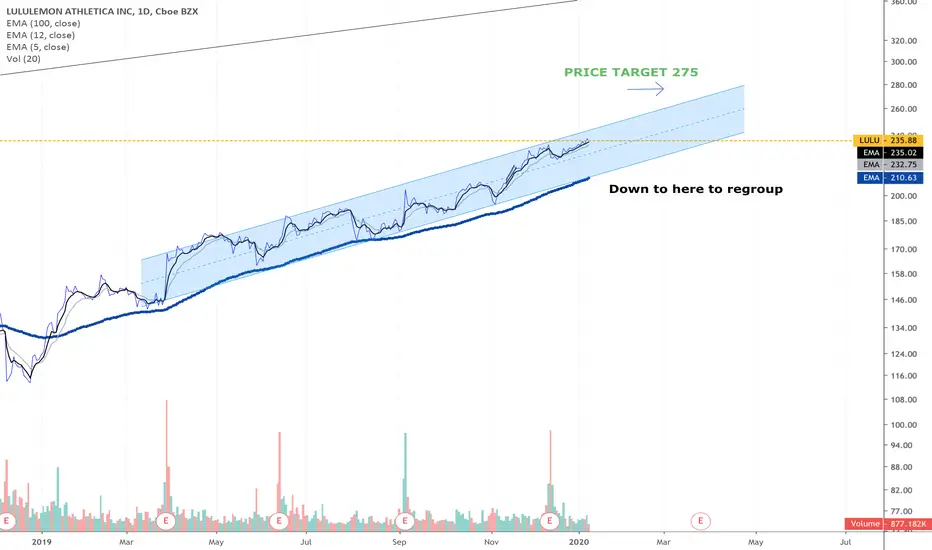
Lulu incredible run strengthStill in channel pattern for now.... growth still room but may pull back a bit too in between channel....
Must says it has been an incredible ride with it
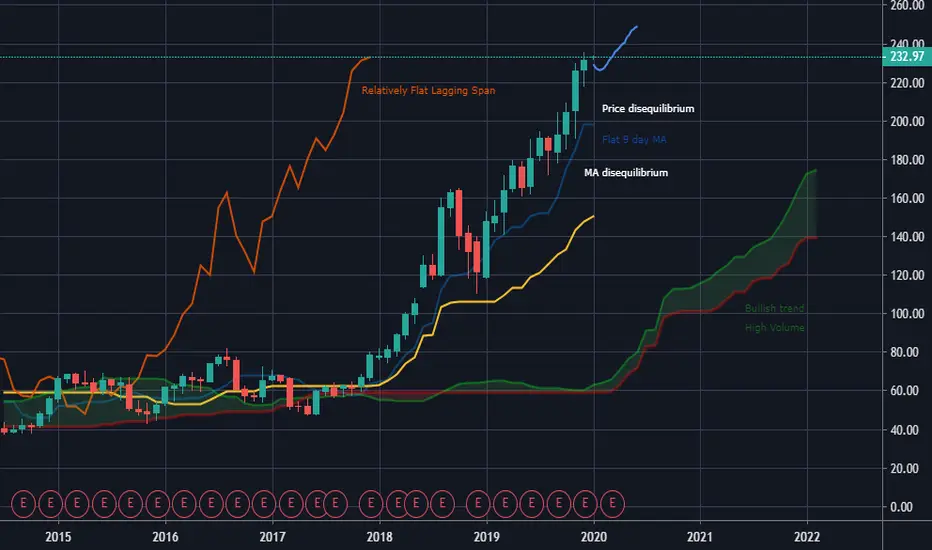
$LULU Monthly Analysis Potential buy opportunity after pullback.
lchimoku Cloud indicates high buying volume & momentum.
Flat 9 day MA indicating a pullback.
Moving average & price disequilibrium.
Lagging span still has a bit of momentum
26 day moving average high momentum.
Price is expected to drop & pullback to higher highs.
$LULU Filled the top gap, watch for break to fill bottom gap.Top gap was filled, looking for a breakdown to fill bottom gap. Picked up some cheap Feb puts around the gap price.

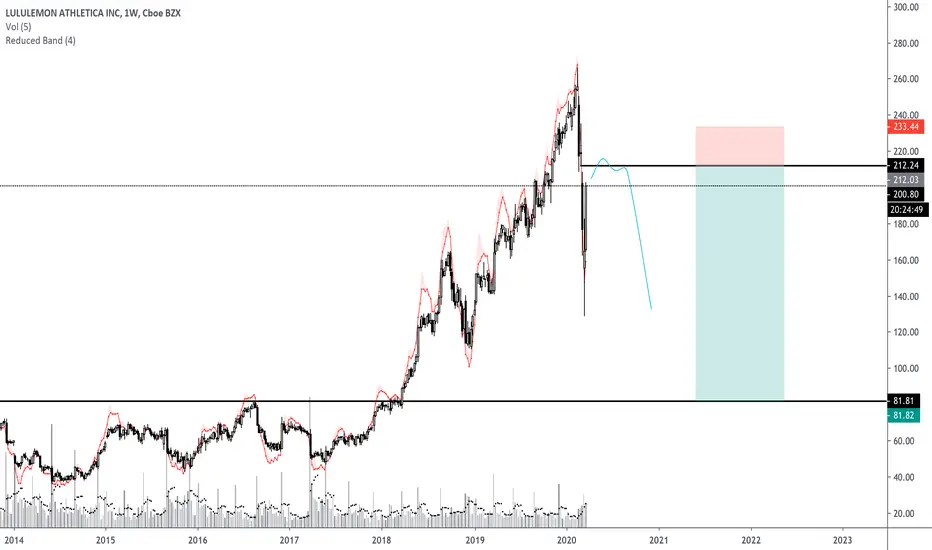
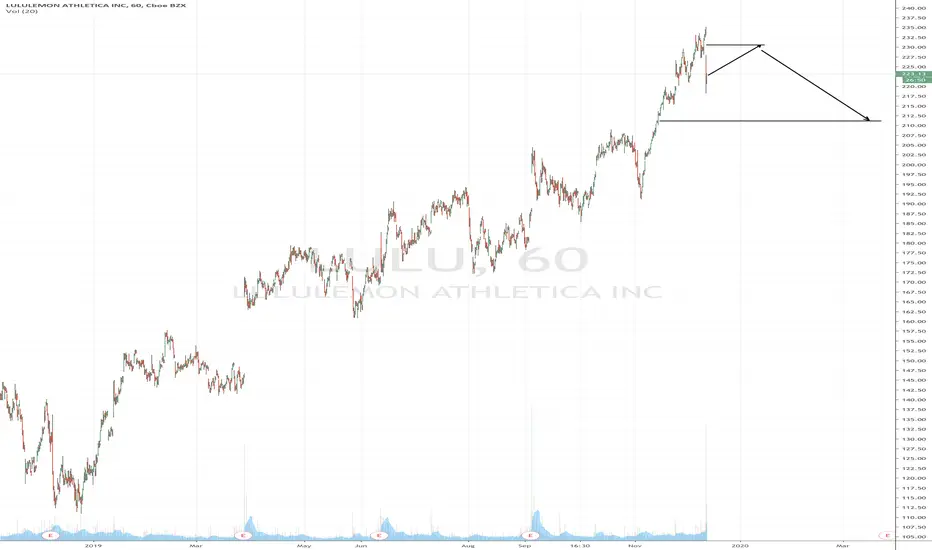
LULU Bullish shorter term Bearish medium termSo this trade opportunity is a bit risky, because price action is likely going to continue to make lower lows over the next several months, possibly targeting the 211 level. I'm not trading that move lower, but aware that it is likely. However, I'm interested in a shorter term trade higher to target the 230.57 level over the next several days to possibly next few weeks. Watching price action here...The idea is higher to 230 and then lower to 211. We will see.
LULU Pennant Breakout (down)Dropped on poor guidance, formed a pennant and appears to be heading down.
Target is $215 support

LULU Drop Not Over Yet TP @ 212-213We will continue the drop to the bottom of the Bollinger bands which coincidentally also the 50 Log-EMA level which should provice some resistance and hopefully we bounce back from there.
If you also long from that point put your SL below the band and the EMA.

LULU just normal regrouping....if fall below 217 to regroup....LULU just normal regrouping....if fall belo 217 to regroup.... it will go down to 204 range to test.... as it is way above100 MA averages..... IMO
