Lululemon's Strong Holiday Season Signals Power Move in Retail
Lululemon Athletica Inc. emerges as a standout player in the retail game, defying earlier cautious sentiments and setting a tone of confidence. The sportswear giant recently revised its fourth-quarter sales and profit forecasts, surprising both investors and industry observers alike. In a move that reflects resilience amidst economic challenges, Lululemon has not only weathered the storm but is flourishing, offering a compelling narrative for potential buyers.
1. Festive Boost Exceeds Expectations:
Lululemon's decision to raise its fourth-quarter sales outlook comes on the heels of a holiday season that surpassed initial projections. Contrary to earlier concerns about consumer restraint due to inflation and interest rates, the company experienced robust demand, driven by enticing discounts and strategic deals. CFO Meghan Frank's statement underlines the success of Lululemon's balanced sales trends across channels, categories, and geographies.
2. Strategic Forecast Adjustments:
The upward revision in revenue guidance, now ranging between $3.170 billion and $3.190 billion, showcases Lululemon's confidence in its sustained performance. The revised profit-per-share projections of $4.96 to $5.00, up from the previous range, hint at the brand's financial strength and ability to navigate challenges effectively.
3. Online Sales Surge and Margin Boost:
The rise of online sales, aided by discounts and "buy now, pay later" plans, played a pivotal role in Lululemon's success. Despite a highly promotional retail environment, the company reports that shoppers are making purchases at full price, contributing to impressive gross margins. This defies the common narrative of heavy discounts eroding profitability.
Conclusion:
Lululemon's recent performance not only defies industry expectations but also signals a bullish outlook for the sportswear market. The company's ability to adapt to the evolving retail landscape, capitalize on online trends, and maintain strong margins paints a compelling picture for potential investors.
LULU trade ideas
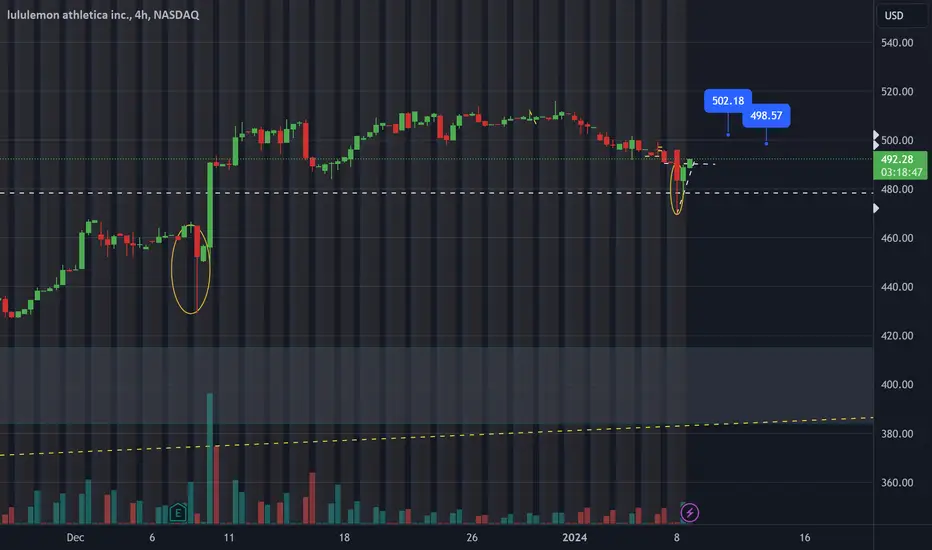
LuluLULU has shown a promising reversal candle, and my upcoming targets for this week are set at $498.57 and $502.18.
Short Lululemon 1-6months out putsIt's late at night I just wanted to mention this. I'm hoping to fill two puts in the morning when the market opens.
LULU 505p 1/26/24 currently at 17.03
LSE:500P 2/16/24 currently at 13.20
$490p 2/16/24 at 15.93
Hopefully LULU doesn't open too red so my order will fill. Going to do more DD in the morning. I will keep this idea updated. Cheers

Lululemon Athletica ( NASDAQ: $LULU) Continuous Bullish TrendThe 50-day Moving average is above the 200-day moving average indicating the bulls are driving NASDAQ:LULU price up.
Investors have been pushing the share price higher, NASDAQ:LULU still appears to have upward momentum. This is a positive sign for the stock's future value.
The candle stick movement of NASDAQ:LULU indicates a large Bullish Harami forming.

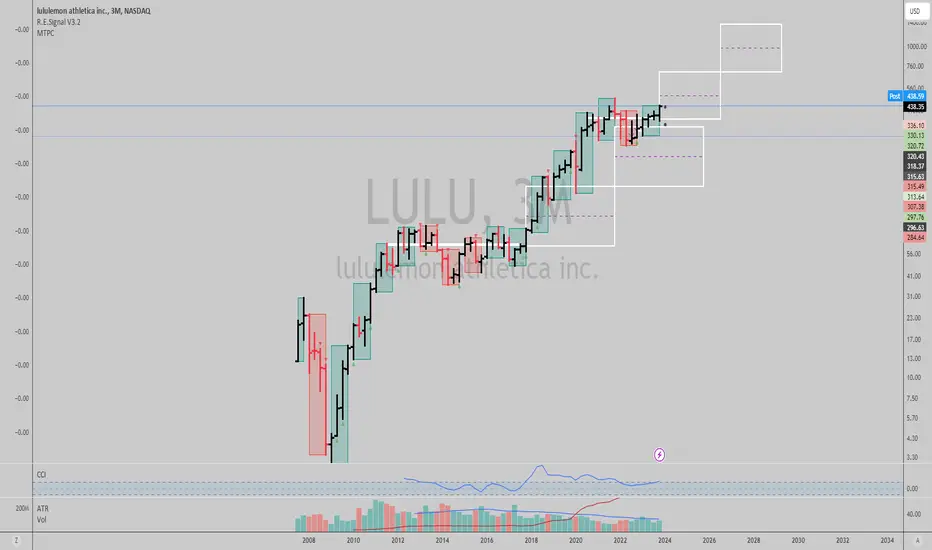
$LULU: Low risk trend signal...Lululemon is a strong investment with a loyal customer base and a healthy balance sheet. The company is well-positioned to benefit from the expected decline in interest rates and inflation.
Time@Mode shows a low risk entry in quarterly scale here, with worst case scenario downside being a drop under $326.93, which considering potential upside, makes this a very attractive reward to risk trade.
Best of luck!
Cheers,
Ivan Labrie.
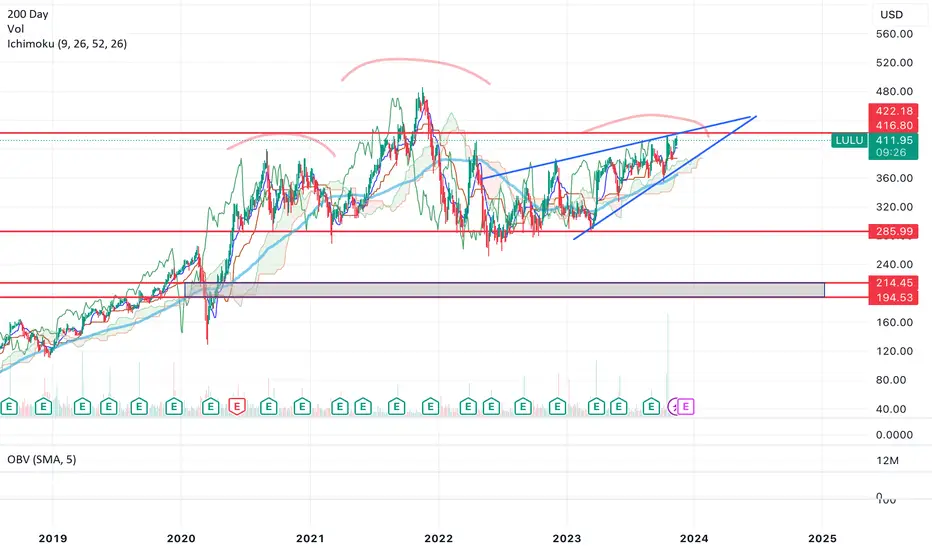
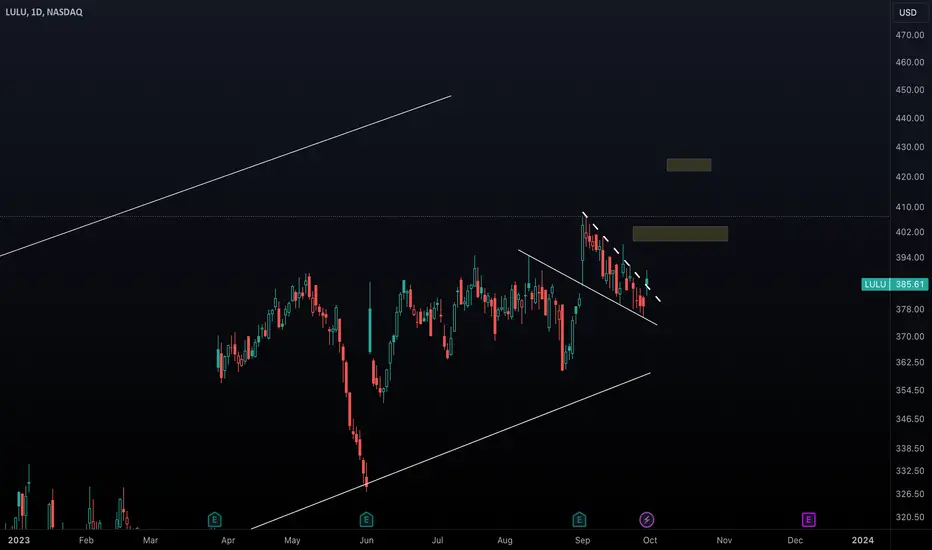
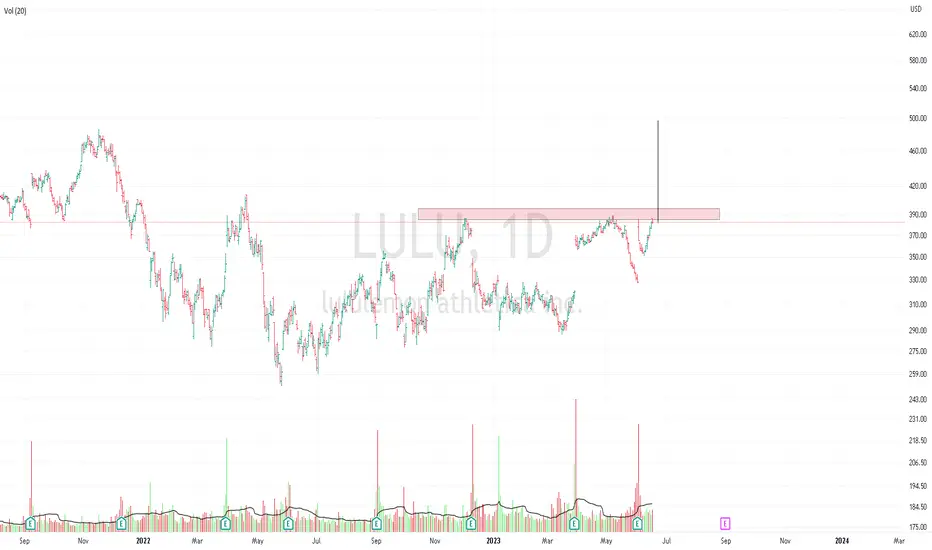
$LULU looks like a great long-term shortChart is self explanatory. Rising wedge forming inside of a H&S top pattern.
Target in the rectangle below. Will likely take 6-9 months to play out.
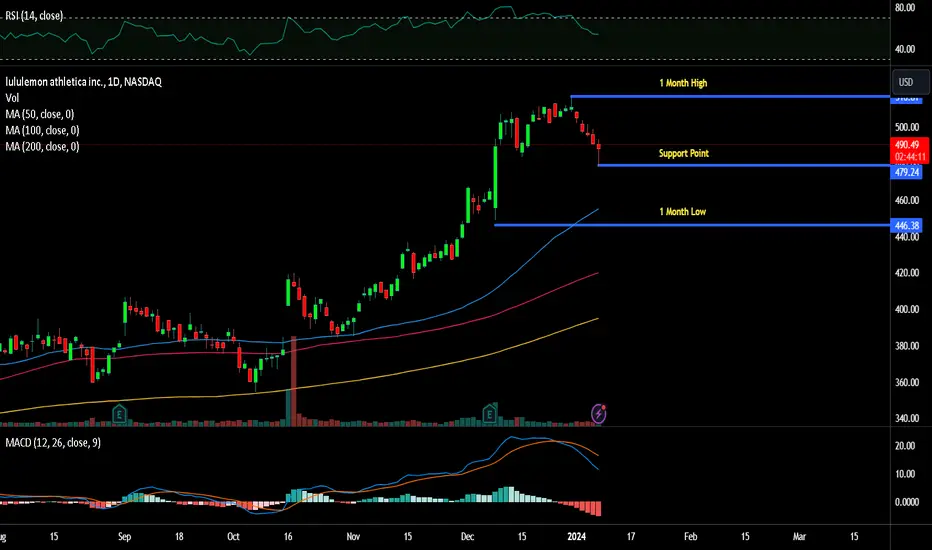
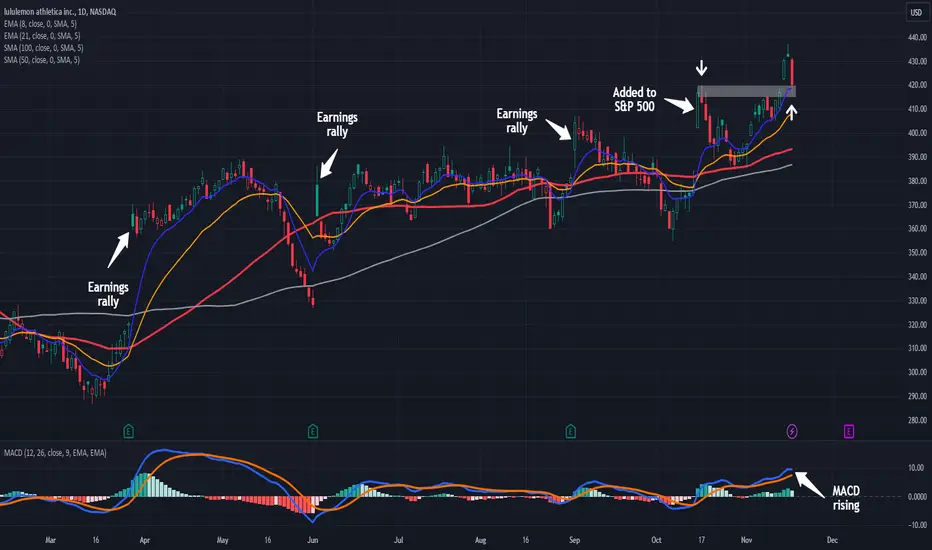
Lululemon Could Be RunningLululemon spent more than half of 2023 in a range, but now it could be starting to run.
The first pattern on today’s chart is the bullish gap after LULU was added to the S&P 500 last month. The stock pulled back in late October, made a higher low and proceeded to a new 52-week high. That may suggest it’s trying to break out.
Second is the range between $415 and $420, near the mid-October peak. Prices have pulled back to test that zone. Trend followers may now watch to see whether it makes a higher low. Can old resistance become new support?
Third, you have the rising moving averages. The 8-day exponential moving average (EMA) is above the 21-day EMA. The 50-day simple moving average (SMA) is above the 100-day SMA. That may suggest that both the short- and long-term trends are bullish.
Fourth, notice how LULU gapped higher following its last three quarterly reports. Will that keep buyers engaged into the next set of numbers estimated for December 7?
Finally, MACD is rising.
TradeStation has, for decades, advanced the trading industry, providing access to stocks, options, futures and cryptocurrencies. See our Overview for more.
Important Information
TradeStation Securities, Inc., TradeStation Crypto, Inc., and TradeStation Technologies, Inc. are each wholly owned subsidiaries of TradeStation Group, Inc., all operating, and providing products and services, under the TradeStation brand and trademark. TradeStation Crypto, Inc. offers to self-directed investors and traders cryptocurrency brokerage services. It is neither licensed with the SEC or the CFTC nor is it a Member of NFA. When applying for, or purchasing, accounts, subscriptions, products, and services, it is important that you know which company you will be dealing with. Please click here for further important information explaining what this means.
This content is for informational and educational purposes only. This is not a recommendation regarding any investment or investment strategy. Any opinions expressed herein are those of the author and do not represent the views or opinions of TradeStation or any of its affiliates.
Investing involves risks. Past performance, whether actual or indicated by historical tests of strategies, is no guarantee of future performance or success. There is a possibility that you may sustain a loss equal to or greater than your entire investment regardless of which asset class you trade (equities, options, futures, or digital assets); therefore, you should not invest or risk money that you cannot afford to lose. Before trading any asset class, first read the relevant risk disclosure statements on the Important Documents page, found here: www.tradestation.com .
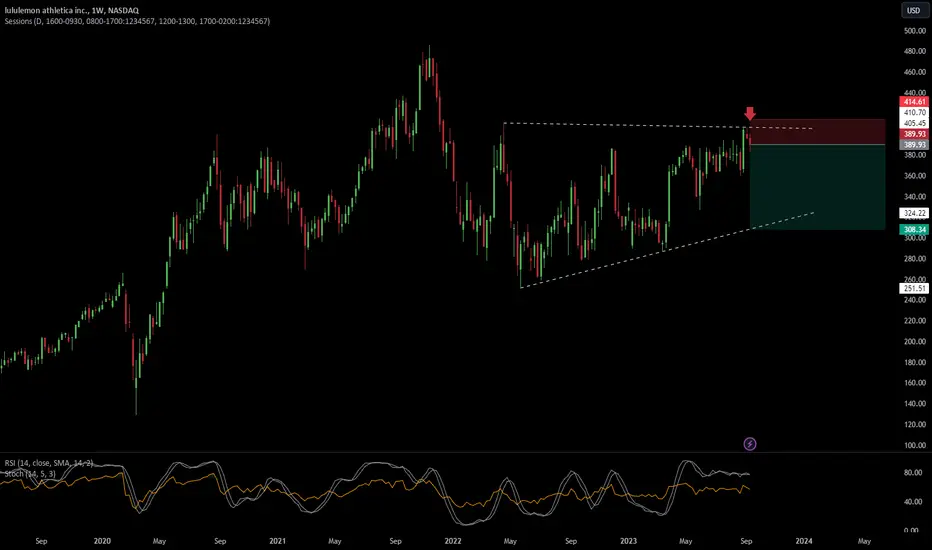
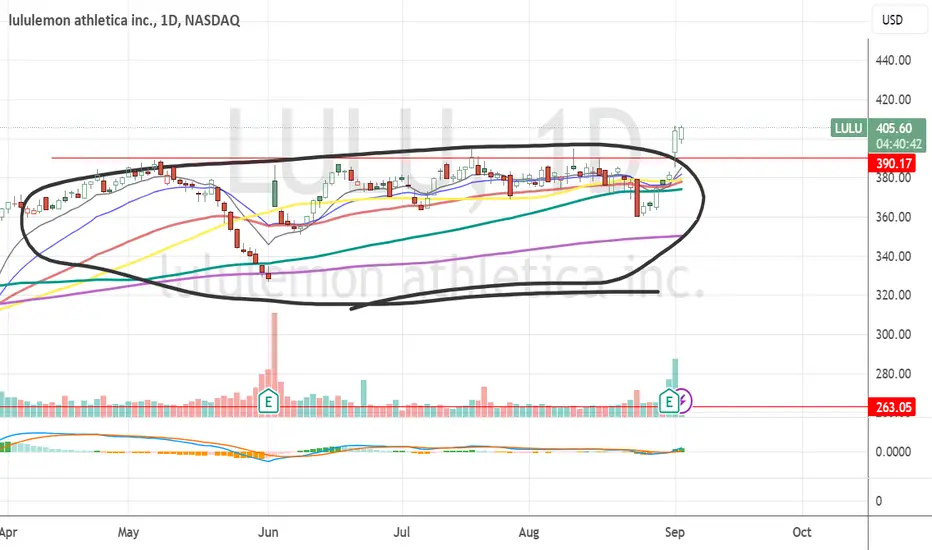
LULU is at a consolidation phaseYou can see from the weekly chart that prices are going sideways since 2020, much like a pinball hitting the ups (resistance) then rebound off the lows (support) for 3 years. So, if you had bought this stock in 2020, you probably have a roller coaster ride of being happy and feeling frustrated.
If it can breaks out from the current resistance level , ie 387-410 , then we are safer to say it is trending up. However, nobody can say for sure as it has happened in Sept 2021 where it breaks out , only to come tumbling down..........
There are naturally short term traders who are adept at finding opportunities to long and short in this phase but is a RISK you have to take, if your heart can take it. Else, I say sit on the fence and wait or look for better stocks. As I said, buying process is easy, it depends on how much you have (capital) and how much you want to buy and at less than 30 seconds, you can become a shareholder of these companies.
The trick lies in the homework prior to hitting the buy button. Always take what others write with a pinch of salt (including mine) and do your own research. Over the years, I have discover the stock market is a good reflection of one's thoughts, psychology and emotions. What you buy, when and why reveals a lot about your inner thoughts at that moment.
Hopefully, we made less mistakes and cheaper ones compared to the profitable ones in the long term in order to grow your wealth.

Lululemon Falling WedgeFalling wedge pattern is a bullish formation.. 400 - 425 can come as resistance.
Extreme fear in markets right now. Once we break down out of the bear flag on the weekly timeframe a larger sell will come once again.
Ascending TrianglePossibly heading for support.
Spinning top/indecision/at resistance.
Engulfing candle/bearish/today.
Top line is virtually flat (Resistance) and bottom line slopes up (support)
Things can change in a heart beat.
This stock does well at earnings as a rule.
You can calculate targets by projecting the width of the wide end of this triangle and projecting that measure up or down from the beak point.
Loose triangle as price is spread out somewhat. Triangles perform better when they are tight.
No recommendation

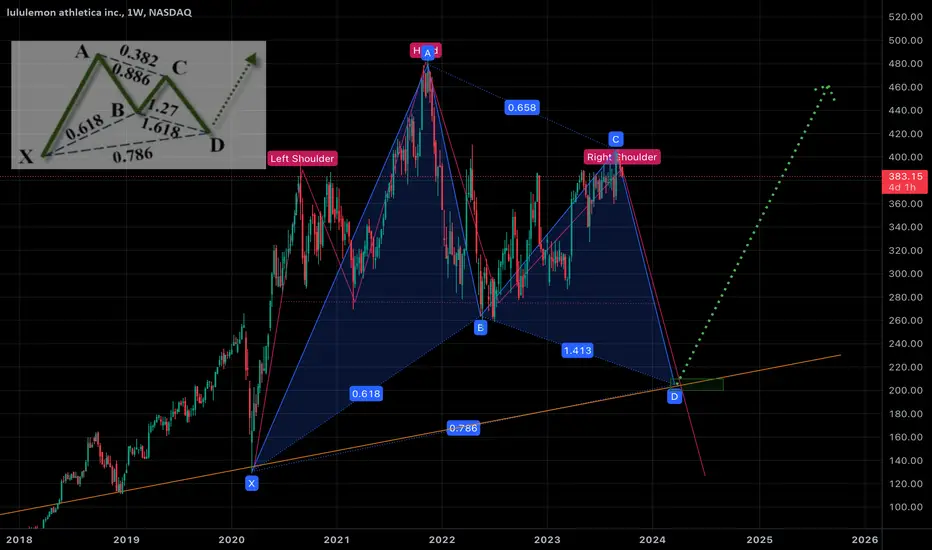
We are going down to the trend 200$According to the butterfly, we will have a decline to the trend in the area of ~ $ 200, I would not have taken a position earlier. Next, we must go to new heights.
LULU SHORTLooks prime for a short opportunity. Must be traded with tight stop loss as this has been a phenomenal name in the recent past.
PS- Not Financial advise. Do your own diligence.
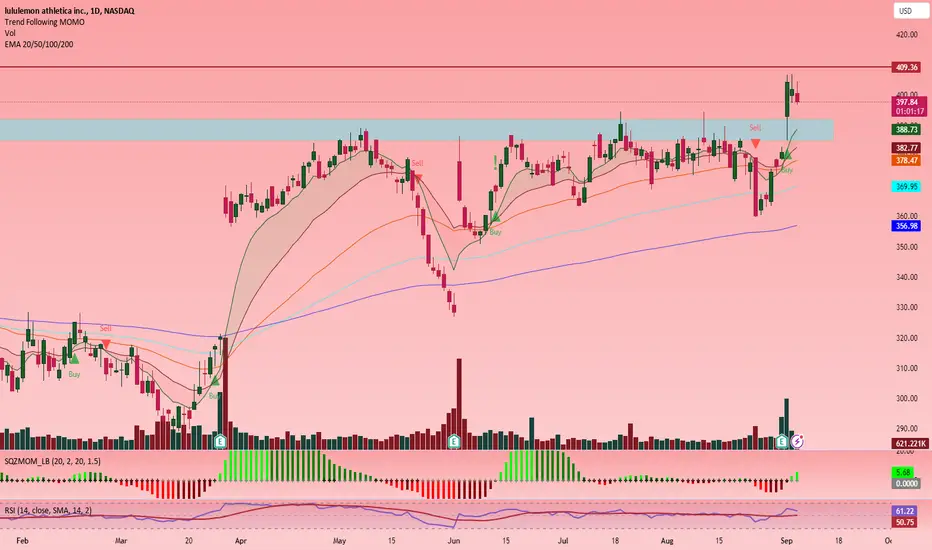
LULU Looking to Go UpSigns in favour of LULU uptrend:
(i) LULU has broken a major resistance level with high volume.
(ii) A bullish pennant is forming.
(iii) Bullish Squeeze momentum has fired.
(iv) RSI is above average.
(v) RSI is in the range of 60 - a good level for breakout.
(vi) Looks like continuity of 3rd Elliott Wave.
LULU is just below another resistance level of 410, which is a hurdle to a full blown bull run.
LULU Lululemon Athletica Options Ahead of EarningsAnalyzing the options chain and the chart patterns of LULU Lululemon Athletical prior to the earnings report this week,
I would consider purchasing the 390usd strike price Calls with
an expiration date of 2023-12-15,
for a premium of approximately $25.90.
If these options prove to be profitable prior to the earnings release, I would sell at least half of them.
Looking forward to read your opinion about it.
LULU swing trade now All these people are trapped short here. Anyone that is short is going to be forced to sell to get out which will make this a great swing trade higher from here. I love love love the EMAs breaking out also.
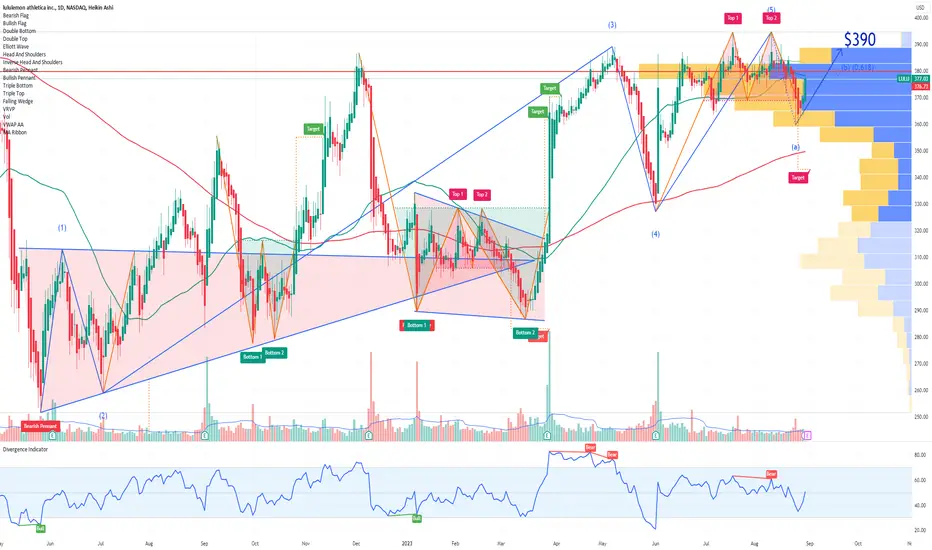
$LULU - Rising Trend Channel [MID-TERM]🔹 Breakout a short-term resistance level, signaling a positive trend for the short-term trading range.
🔹In case of a NEGATIVE reaction, it has support at approximately 385.
🔹Technically POSITIVE for the medium long term.
Chart Pattern:
◦ DT - Double Top | BEARISH | 🔴
◦ DB - Double Bottom | BULLISH | 🟢
◦ HNS - Head & Shoulder | BEARISH | 🔴
◦ REC - Rectangle | 🔵
◦ iHNS - inverse head & Shoulder | BULLISH | 🟢
Verify it first and believe later.
WavePoint ❤️

$lulu cup and handle set to test 500$28 week cup and handle ready to bust on a popular clothing stock with women
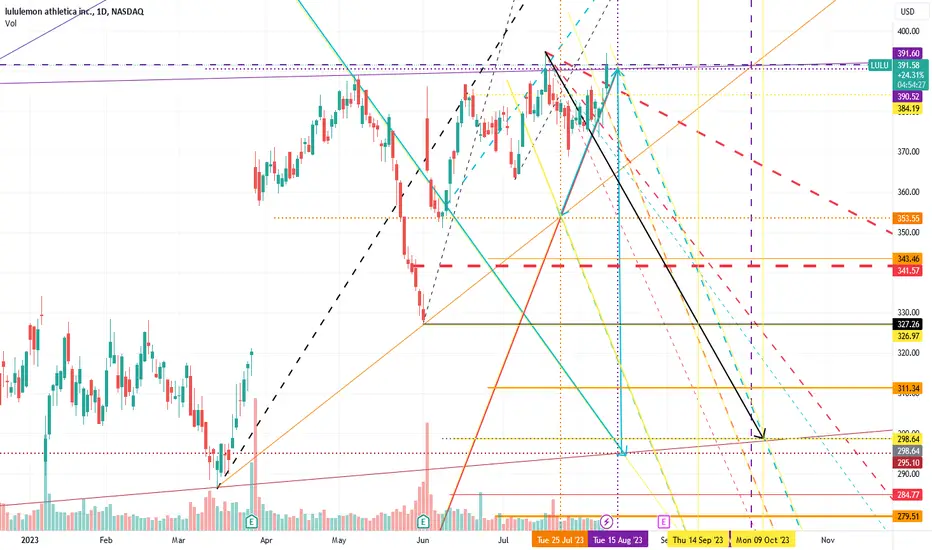
Yoga PantsShort below 384
Initial target 327 by mid Sep 2023
Goal Target 300 by October 2023
P.S.
Yoga Pants are out, we do this naked now.
Ascending TriangleThe triangle is within a large rectangle.
Both patterns are neutral until broken.
Tough Resistance overhead.
Earning 8-31.
No recommendation.
52 Week Range
277.50
394.54
Day Range
375.00
382.72
EPS (FWD)
11.93
PE (FWD)
31.58
Div Rate (TTM)
-
Yield (TTM)
-
Short Interest
2.12%
Market Cap
$47.86B
Volume
229,228

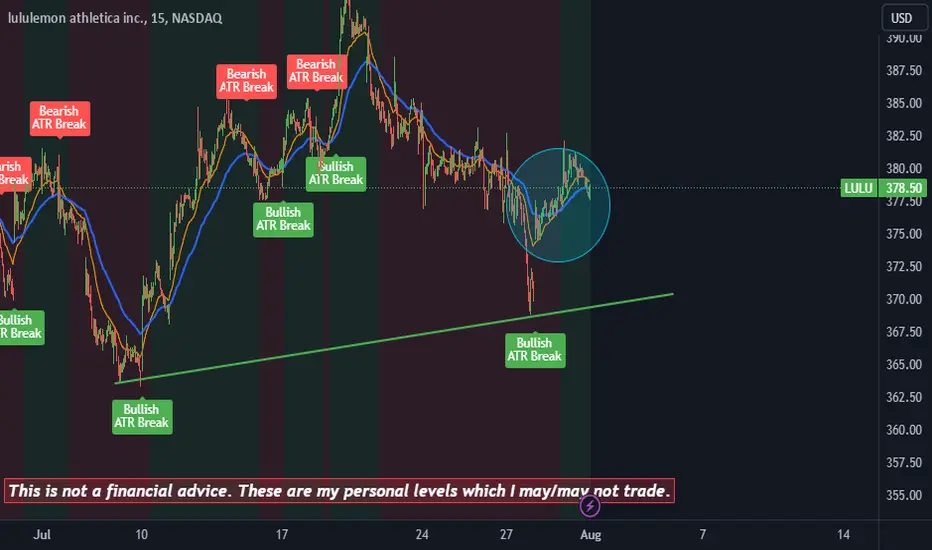
Bullish Alert : LULUOn the 15 minutes chart, there is a good bullish alert with a bullish crossover.
This easy pullback may be over confirming the long term upside move.
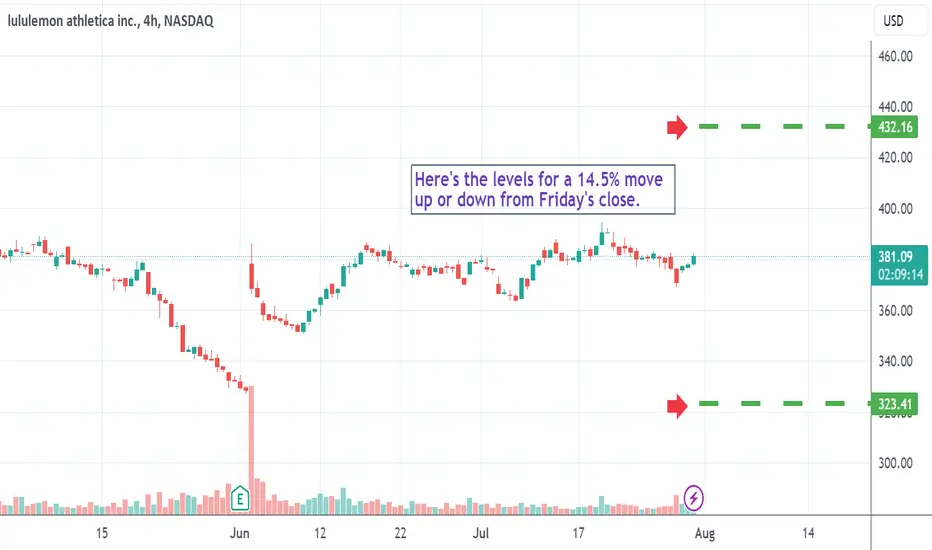
LULU expecting 14.5%+ move for earningsI really have not been getting direction correct on these things since TSLA and GOOGL, but end up nailing the percent and dollar moves based only on my intuitive hits.
SO, full disclosure. I don't follow LULU. This ticker came to me when I woke up on the morning of the 18th with ROKU firmly in my brain, and LULU only slightly.
Of course, I wish I had taken it seriously enough to do a deeper dive on why I got ROKU, but I did enough dowsing to get the point move of 23 correct (post earnings) and that it would go down and then up (on daily chart).
I'm curious if LULU also has an extreme move, so here's what intuition gave me last night on it:
symbol of a heart = up (but could this be just for today since it's up?)
14 "and a half" - never heard such precision before from my guidance lol
and the number 82.
This morning, the high of the day so far is 382, which I thought would suggest a short. But, I've had very bullish energy in my dowsing. So, it could be by the end of the day, if LULU is OVER 382, it's a buy. If it's BELOW 382 it's a sell?
My dowsing also gave me the percent as 16, which very well could be at the extreme of the move.
If anyone has an options strategy for playing both sides for a move up or down, that's really cheap, I'd be interested. Thanks!
LULU put credit spreadmacro: snp500 QQQ uptrend
News: inflation flattening
TA : Break of ascding triangle
STOP: rolling till worthless options
TP: low value per day or expire
risk: UK inflation domino effect

$LULU has the room to go for $500Strong uptrend and earning gaps, great technical chart and wonderful strong up trend gives us clear view of upcoming move for $lulu..
We need first to clear 390 and 400 .
It might gap up strong on Thursday 29 2023 ..
Let's see!
