Roadmap to LULUBlue solid lines are established downtrends, green dotted lines are established uptrends. Both the uptrend and downtrend lines are established from equilibrium points, (not highs and lows). Thickness of lines illustrates strength of previous price action. Circles are the crossing of uptrend and downtrend (Crossfire Points), usually resulting in reactions.
LULU trade ideas

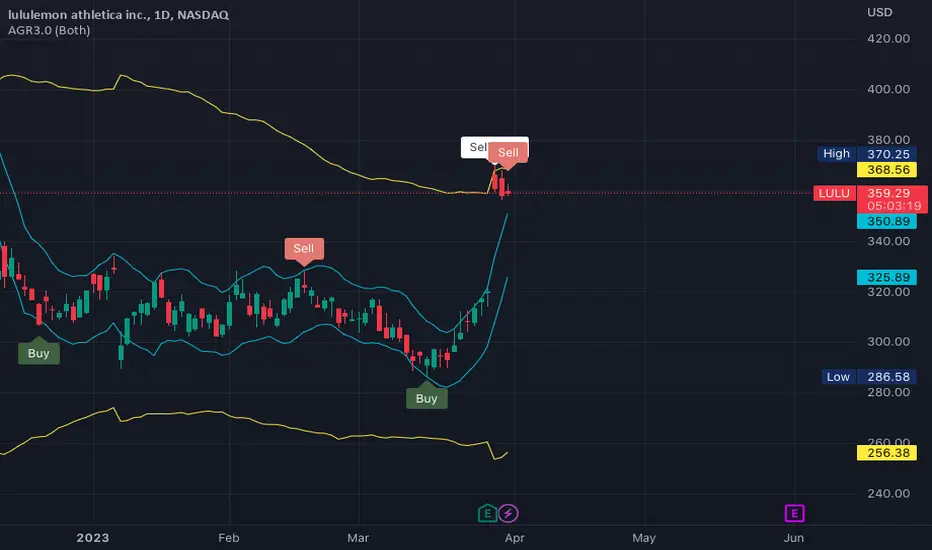
Co inegration strategies on two pairs of stocks( re-upload )I had to re-upload this due to bad volume. This is how you trade based off of the dynamic equilibrium between two stocks within the same industry

Lululemon to breakdown from a wedge?Lulumelon Athletica - 30d expiry - We look to Sell a break of 355.85 (stop at 367.85)
We are trading at overbought extremes.
We have a Gap open at 29/3 from 320.31 to 366.25.
Trading within the Wedge formation.
The bias is to break to the downside.
Expect trading to remain mixed and volatile.
A higher correction is expected.
Our profit targets will be 325.85 and 320.85
Resistance: 374.06 / 380.00 / 386.70
Support: 370.00 / 356.50 / 345.00
Please be advised that the information presented on TradingView is provided to Vantage (‘Vantage Global Limited’, ‘we’) by a third-party provider (‘Signal Centre’). Please be reminded that you are solely responsible for the trading decisions on your account. There is a very high degree of risk involved in trading. Any information and/or content is intended entirely for research, educational and informational purposes only and does not constitute investment or consultation advice or investment strategy. The information is not tailored to the investment needs of any specific person and therefore does not involve a consideration of any of the investment objectives, financial situation or needs of any viewer that may receive it. Kindly also note that past performance is not a reliable indicator of future results. Actual results may differ materially from those anticipated in forward-looking or past performance statements. We assume no liability as to the accuracy or completeness of any of the information and/or content provided herein and the Company cannot be held responsible for any omission, mistake nor for any loss or damage including without limitation to any loss of profit which may arise from reliance on any information supplied by Signal Centre.

$LULU to 380Had a breakout from the symmetrical triangle, also had relative strength on a choppy day.
Trade idea : LULU > 374 target 380
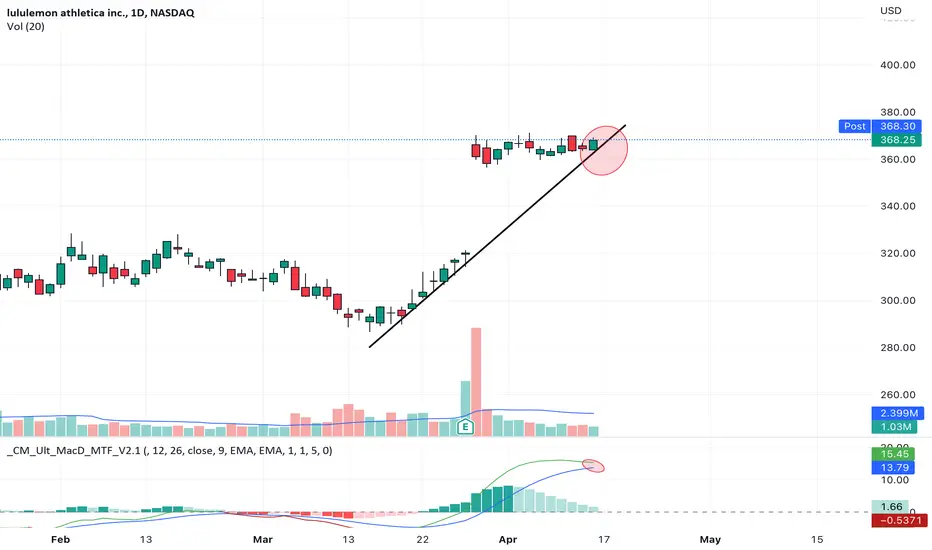
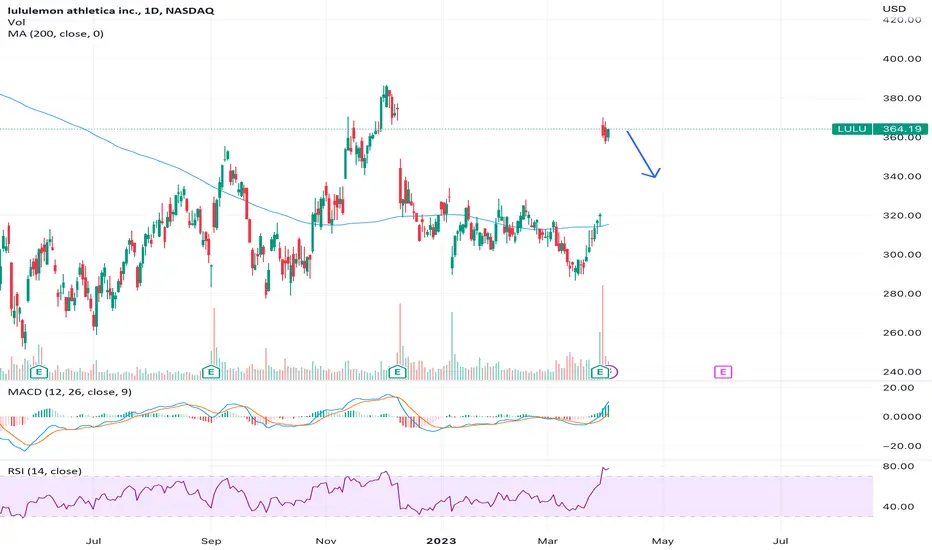
Keep an Eye OutLulu obviously crushed earnings and the stock took off to the upside. But…. Keep an eye out for this trend line. If we get a clean break, we may go down quite a bit to fill the open gap. MACD also showing that we’re getting close to turning bearish.
Not financial advice, good luck to all :)
LULU 3/20/2023The ladies love their overpriced leggings, but the stock market doesn’t.
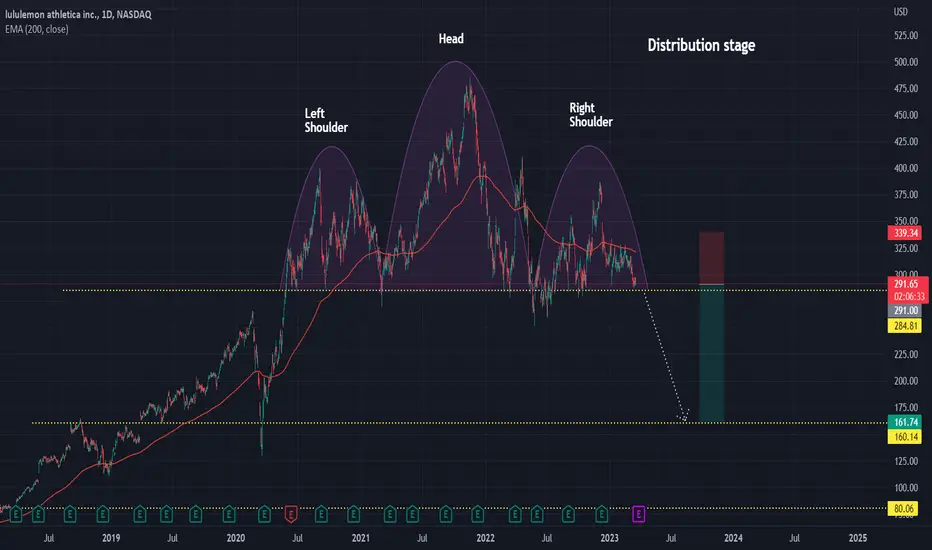
LULU Daily chart analysis.
Their uptrend started March 2018 and came to an end December 2021.
Price has since been moving side-ways in a Distribution stage in form of a Head and Shoulders pattern. We need is break of neckline before price enters downtrend.
Entering trade short
Entry: 281.00
Stop loss: 339.34, (-16.61%)
Target: 161.74, +44.42%, 2.67 RR ratio
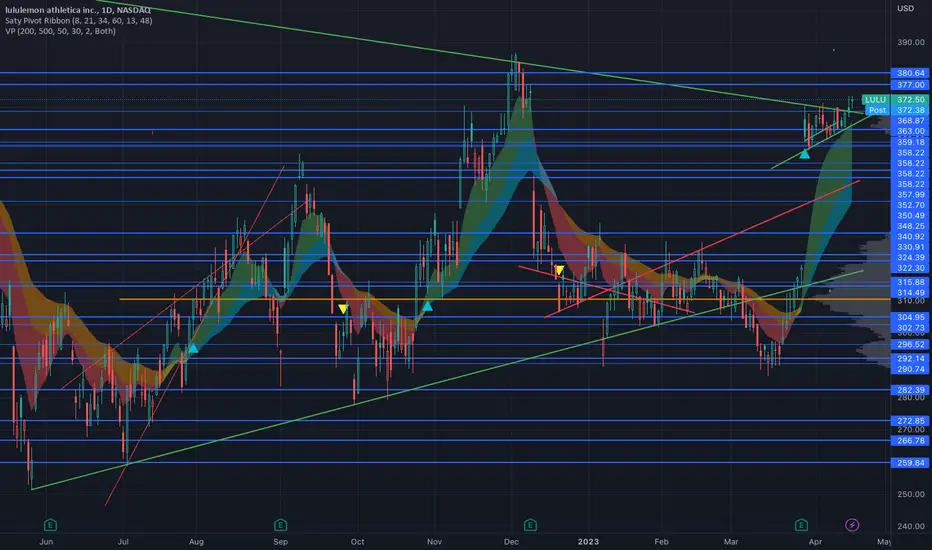
LULU - Broken Failing Trend Channel- LULU has broken the ceiling of the falling trend in the medium long term, which indicates a slower initial falling rate.
- The price has risen strongly since the positive signal from the double bottom formation at the break through resistance at 325.
- Between support at 352 and resistance at 385.
- RSI is above 70 after a good price increase the past weeks.
- The stock has strong positive momentum and further increase is indicated.
However, particularly for big stocks, high RSI may be a sign that the stock is overbought and that there is a chance of a reaction downwards.
- The RSI curve shows a rising trend, which could be an early signal of the start of a rising trend for the price as well.
- Overall assessed as technically slightly positive for the medium long term.
*EP: Enter Price, SL: Support, TP: Take Profit, CL: Cut Loss, TF: Time Frame, RST: Resistance, RTS: Resistance to be Support LT TP: Long Term Target Price
Verify it first and believe later.
WavePoint ❤️

SHORT LULUWe had a fantastic earning report this week, but we must remember that not only LULU but every other stock moved higher this week.
It was not only because of LULU's earnings whole market is moving higher and closed March with a big statement. Now that we trading above 200 MA and 77 levels at RSI, LULU has to and needs to move down to find new higher low support to move even higher.
After all one thing, we learned this past few years you can't be too bullish and can't be too bearish. Stocks will go down and up all the time. In LULU's case, there is not much juice left to squeeze up, therefore stock needs to go down.
Currently stock is extremely overbought it's not sustainable to move higher at this point. My first target is around $340.
LuLu showing weakness after a group this week.
LuLuLemon showing weakness after a group this week. I see a huge opportunity in terms of filling this weeks gapup with downtrend starting now.
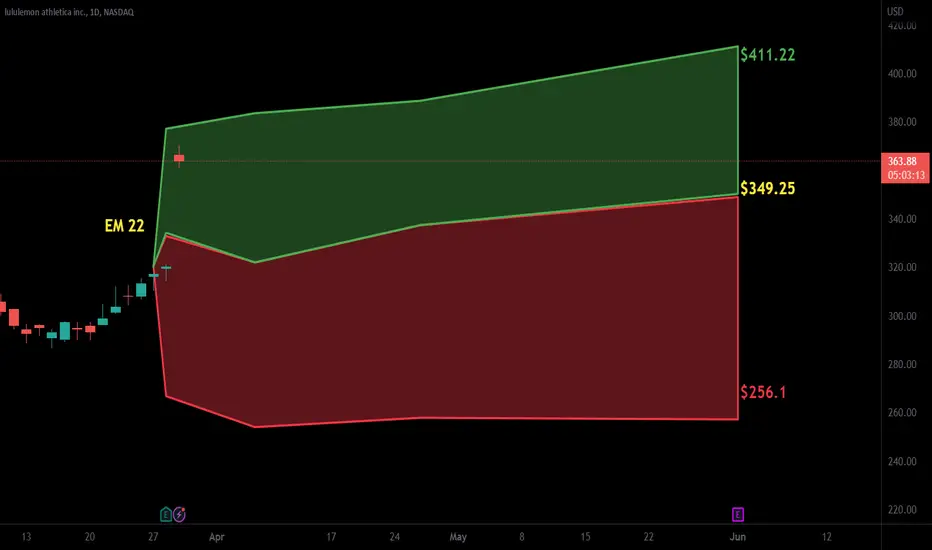
$lulu with a bullish outlook following its earnings #StocksThe PEAD projected a bullish outlook for $lulu after a positive over reaction following its earnings release placing the stock in drift B with an expected accuracy of 100%.
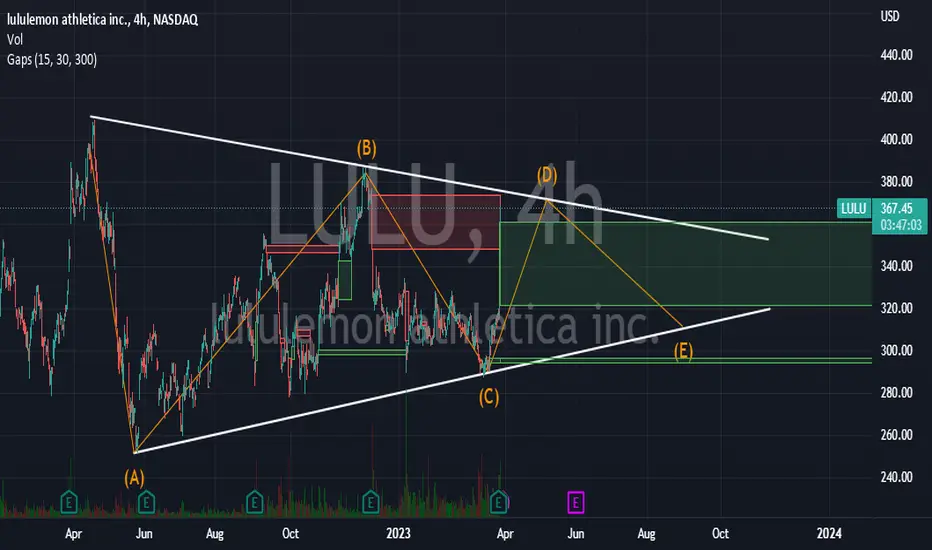
$LULU Inside triangleNot financial advice.
$LULU Be careful chasing.
Inside of a possible A,B,C,D,E, triangle Usually these triangles are forming for distribution.
Like, share and subscribe.
Thanks.
Alex!
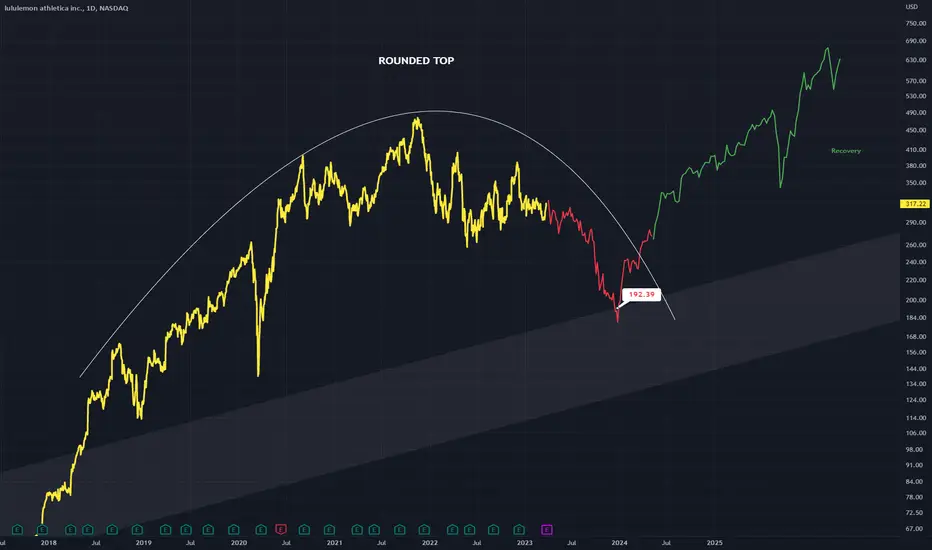
LULU - Rounded Top Recovery A rounded top has formed on LULU
Completing this rounded top leaves price at around 190 - 200$
Following the rounded top a recovery ensues which is normally quite strong
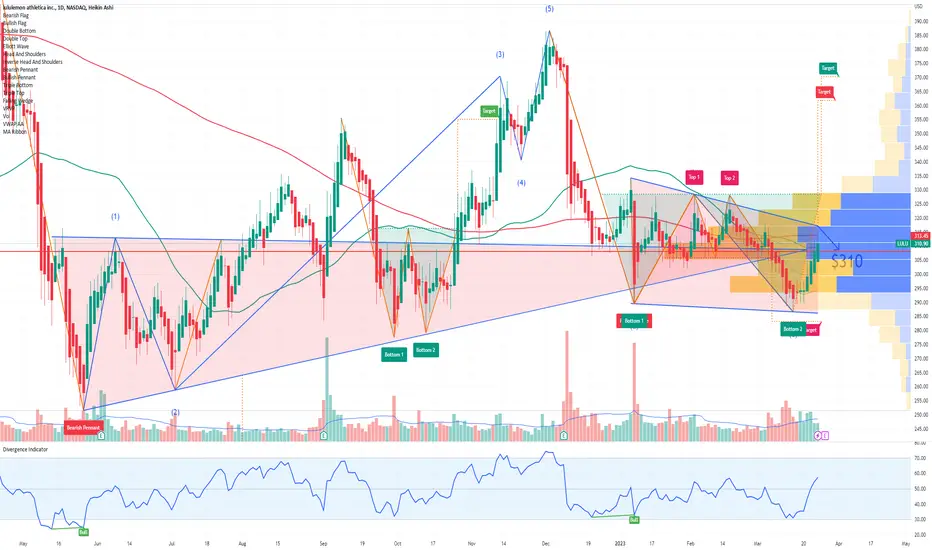
LULU Lululemon Athletica Options Ahead Of EarningsLooking at the LULU Lululemon Athletica options chain ahead of earnings , I would buy the $310 strike price Puts with
2023-4-21 expiration date for about
$14.65 premium.
If the options turn out to be profitable Before the earnings release, I would sell at least 50%.
Looking forward to read your opinion about it.
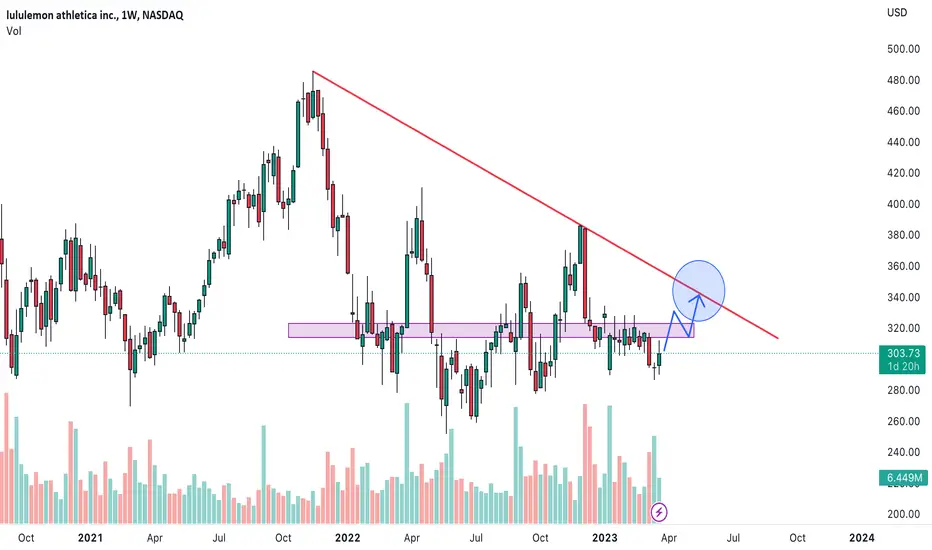
LULU Bullish OutlookKeeping this one simple, I think Lulu is poised to retest the trendline after earnings. Resistance area around $315-$322.
Not financial advice, good luck to all :)
Symmetrical TrianglePrice completed an M/Shark pattern which reversed at the .886 of OX.
The shark helped positive price movement temporarily but this was bound by trendlines of the triangle.
Price is beneath the triangle now.
The Shark is labeled 0XABC.
Earnings 3-28.
No recommendation.
EPS (FWD)
9.92
PE (FWD)
29.57
Div Rate (TTM)
-
Yield (TTM)
-
Short Interest
2.52%
Market Cap
$37.39B

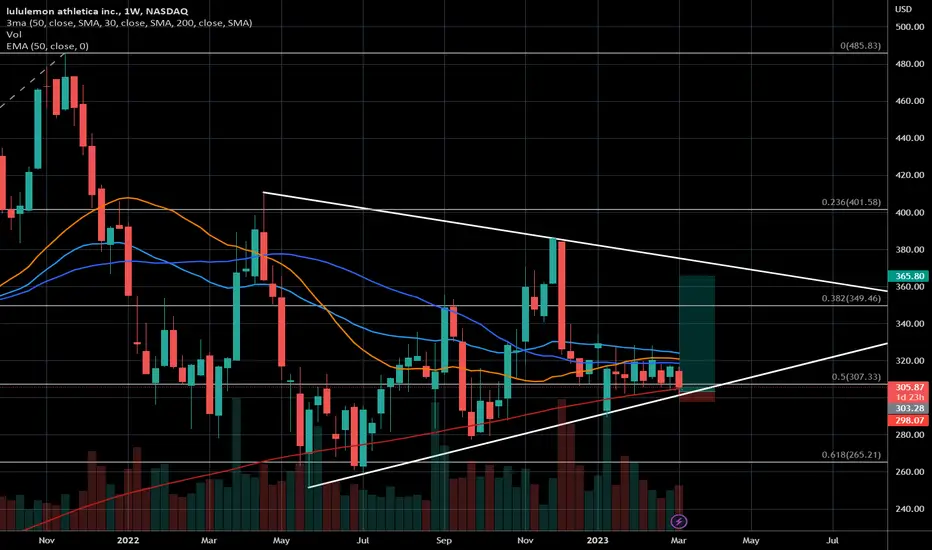
Bought the reboundTrading the price movement inside the big triangle. As long as there is no prolonged close below the SMA 200 (red) I'm leaning bullish here.

LULU (LULULEMON)- either way... waitingLULU (LULULEMON)- either way... waiting for a signal to confirm which side will go.

BearishDaily triple top pattern. Looks like it's ready for the next leg down. There is some support around 310.65'ish. Ideally I would like to see price break through this level as well as trendline support.

Symmetrical TrianglePrice has bumped in to the old neckline from a prior H&S pattern.
T1 met. T2 is in smaller type then T3 is in even smaller type.
Earnings are 12-8 AMC. This one usually beats earnings but it will depend on how the market is feeling at earnings date.
This is a high end retailer and I love LULU, but nothing is cheap. They say the rich (which I am not) do not feel inflation and recessions like the middle and lower classes. I guess time will tell.
No recommendation.
I also see a bull flag a little while back.

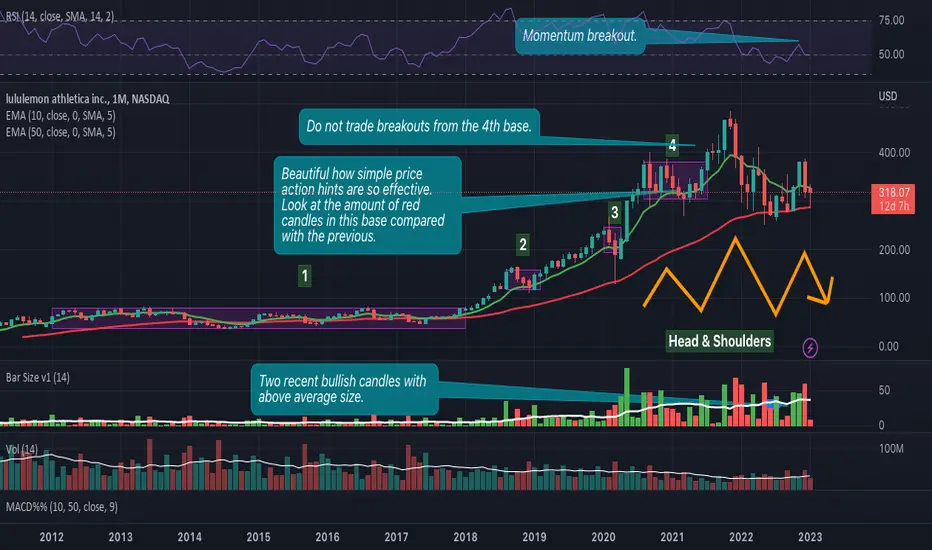
$LULU - Head & ShouldersIdeally the neckline would slope upwards instead. Still a beautiful pattern ... in formation.
No breakout below the neckline yet.
This breakout could be exactly the trigger which the bears are looking for to trade this downtrending market.
For the bears still, watch out for the two ugly bullish candles that arose at the end of the year. Volume below average but the candle size is threatening anyhow.
Cheers,