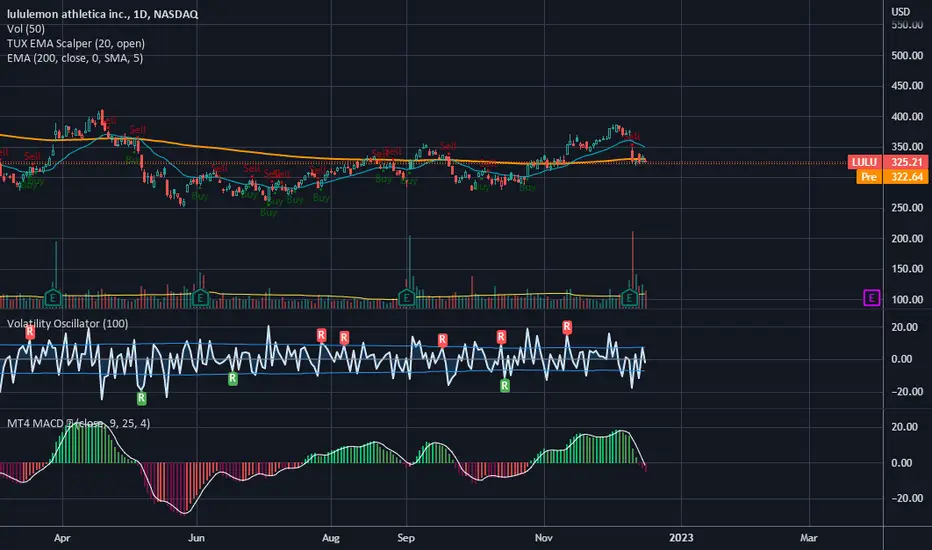
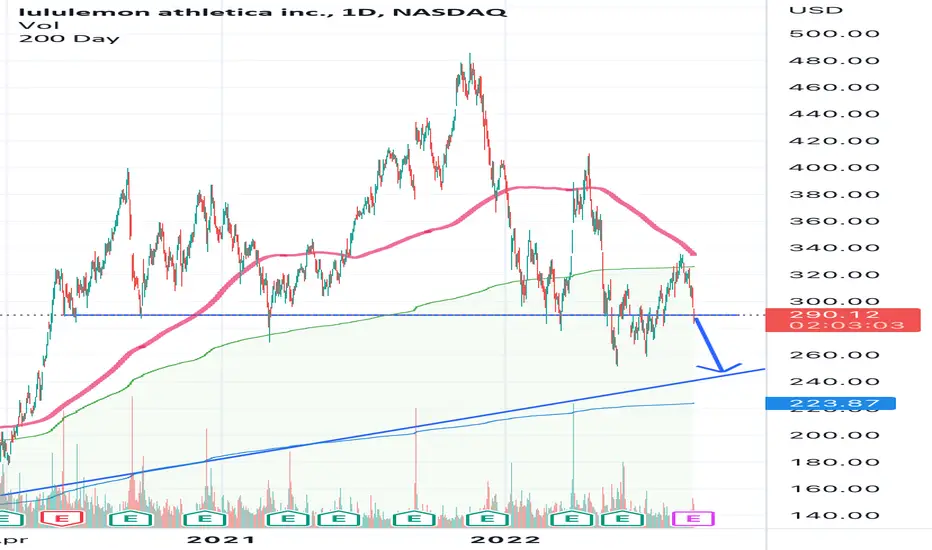
Massive LULU ShortI'm extremely bearish on Lululemon.
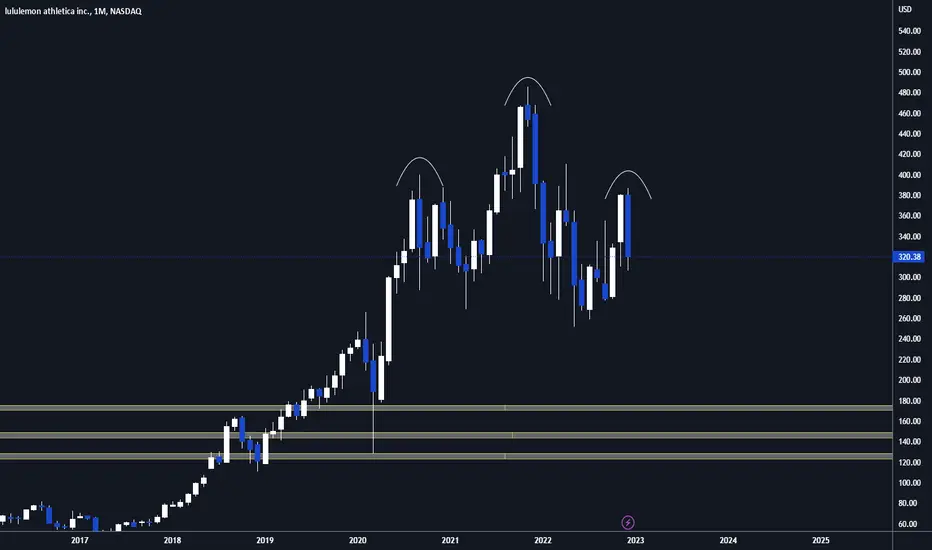
I have no idea how the price remains this high. It's an overvalued stock compared to it's sector and it has a fat head and shoulders formation on high timeframes.
I can see it coming down below $200/sh.
LULU trade ideas
Come as You Are.Sometimes we just go with the flow.
Gr8 Stock.
Good luck/You make me feel like I am free again.
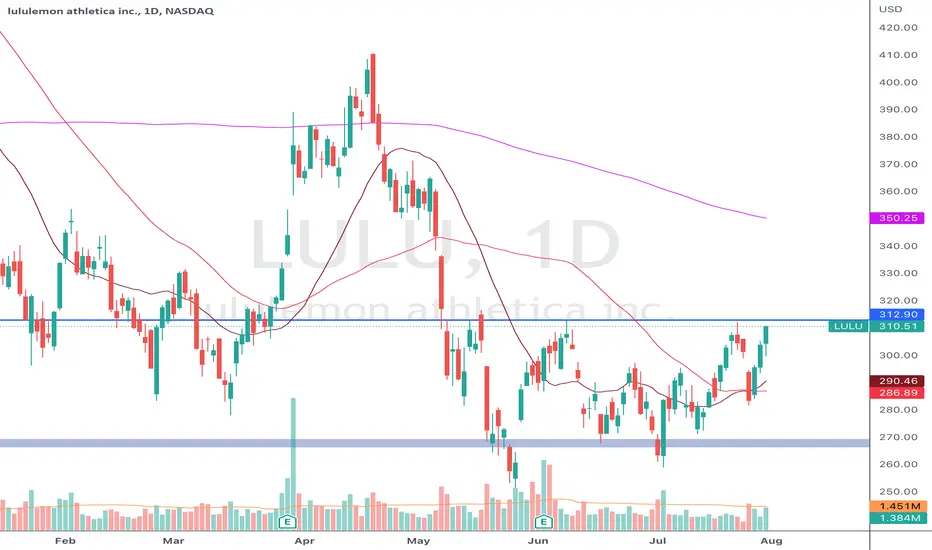
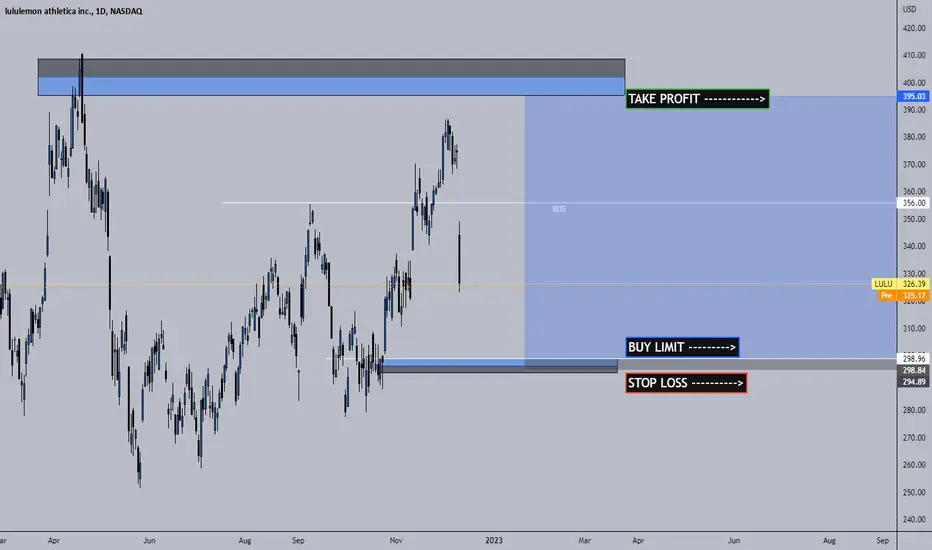
LULU re-test and dip below $300 likely on the way very soon...USING HEIKIN-ASHI CANDLES on the DAILY CHART
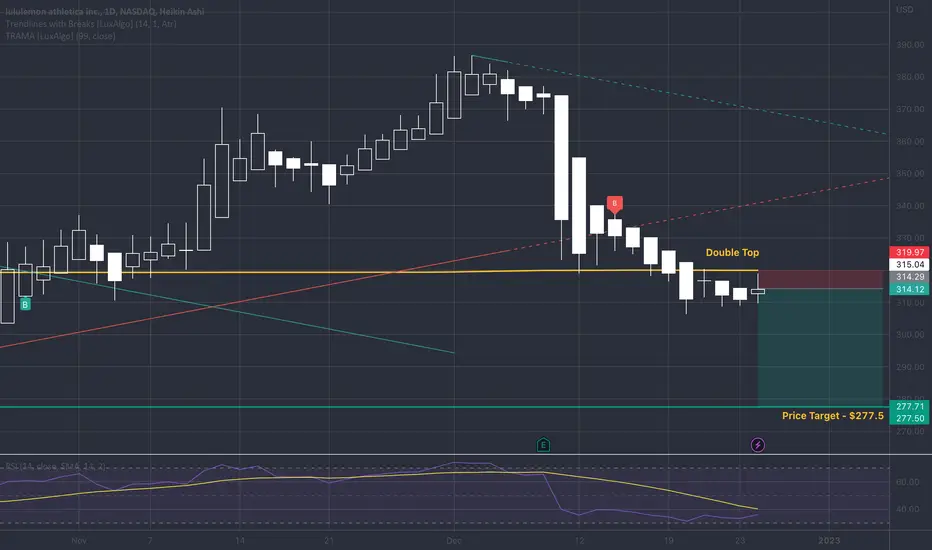
- Heavy selloff after earnings on December 8, 2022 - changing short-term technical sentiment from bullish to bearish, and long-term technical sentiment from bullish to neutral.
- Broke below key trendline on December 14, 2022 with bearish signal courtesy of Lux Algo.
- Dipped and closed below Trend Regularity Adaptive Moving Average Line - a.k.a. the yellow line in the chart screenshot - with force on December 19, 2022 - changing short-term technical sentiment from bearish to very bearish, and long-term technical sentiment from neutral to bearish.
- Relative Strength Index close to convergence at 40% , which could act as additional resistance.
- Double Top rejection below the Trend Regularity Adaptive Moving Average Line , which provided a strong confirmation for short trade entry and stop loss (above TRAMA line at $321) .
Exit target for profit-taking:
- $300 (whole number general buyer reaction anticipated)
- $277.5 (current swing low)
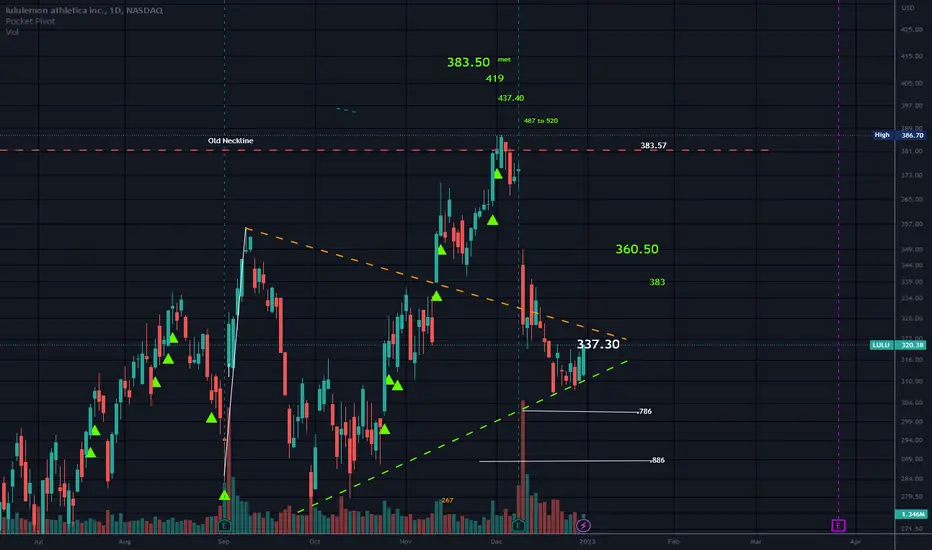
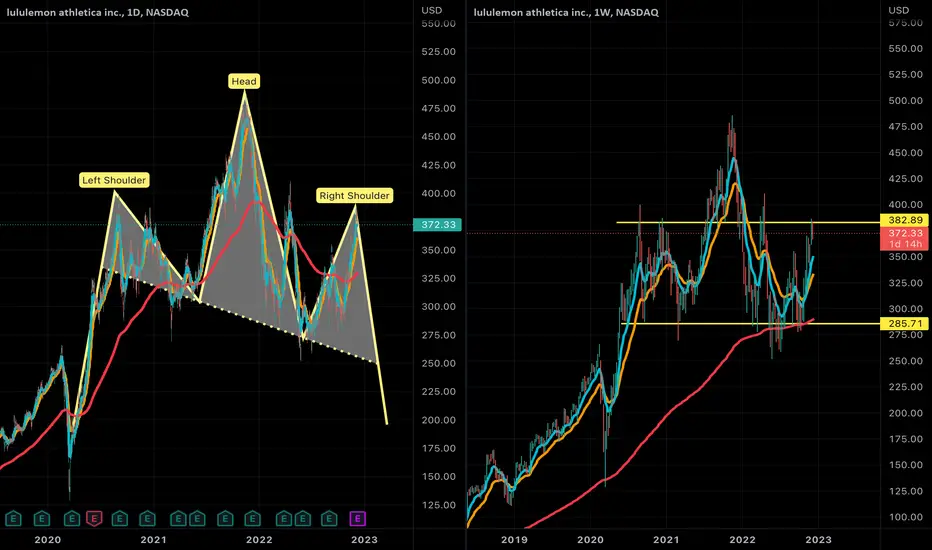
LULU - Short OpportunityTechnical Analysis:
A bearish head and shoulder pattern has emerged and a short signal appeared. A break below 273.6 would be a clear confirmation of long term downtrend.
Fundamental Catalyst:
LULU inventories increased 85% in Q3 2022 compared to Q3 2021. With over 60% of their revenue coming from retail, LULU will continue to face immense competition from e-commerce sellers of athleisure wear that offer equally good quality apparels but at more affordable prices. The recession will likely hit the company hard. LULU has been underperforming in the retail sector index.
Will observe the price action for the next few days / weeks and update when there is an entry opportunity.
NASDAQ:LULU
$LULU - breaking down below $182 would be badLulu looks like it's still playing out H&S with the neck line at $282.
Breaking down below $282 neck line will be bad and could send the stock to $247 again.
The full measured move for the break down is $75 and it is quite hard to imagine the stock going down to that level.
I am neutral. 👀ing for opportunity to load.
——
Trade is done when it hit one of the target or stop loss is hit.
Disclaimer: Trading note. Not an investment advice.

$LULU BUYS Looks like $LULU is making higher highs and has smart money at my OB where the buy limit is in place looking to get a $95 move over the next 2-5 months
$LULU with a Bullish outlook following its earnings #Stocks The PEAD projected a Bullish outlook for $LULU after a Positive over reaction following its earnings release placing the stock in drift B with an expected accuracy of 100%.
Lulu. Short sale for earningsResistance and looks like a head and shoulders
This is a counter trend trade
Pe is too high
Trade at your own risk
Pt 280

Holding the Breakout Since breaking out of its cup with handle base LULU has held above the breakout level and the left side high of the base. That is something that we haven’t seen much of this year. LULU has formed a nice flag with a multitouch trendline. If LULU can push above the trendline it is actionable

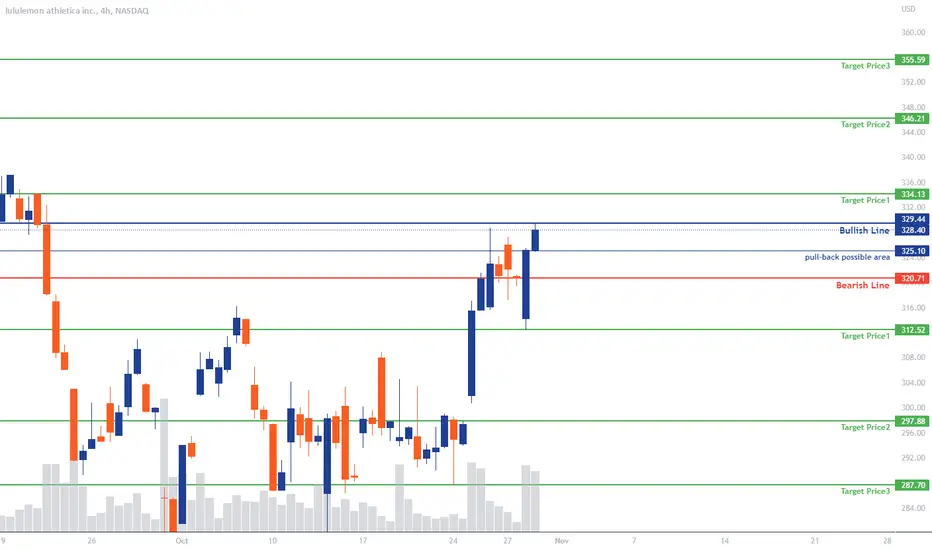
LULU | InformativeNASDAQ:LULU
If it passes the bearish line it's time for a short position, and if it passes the bullish line it's time for the Long position, the price targets are on the chart.
Short LuLu Head and Shoulder It's not investment advice but it seems to me a head and shoulder. 20% gains possible

LULU daily bullish hammer at long time supportOrder BUY LULU NASDAQ.NMS Stop 300.60 LMT 300.60 will be automatically canceled at 20230401 01:00:00 EST
LULU daily bullish hammer at long time support conservative stop, quick 1.2R countertrend
$LULU GAMEPLAN I am looking for a pullback on LULU here around 284 and if not then 297. Once we have a confirmed rejection off one of those lvls we can snag some puts and we can go for a short position

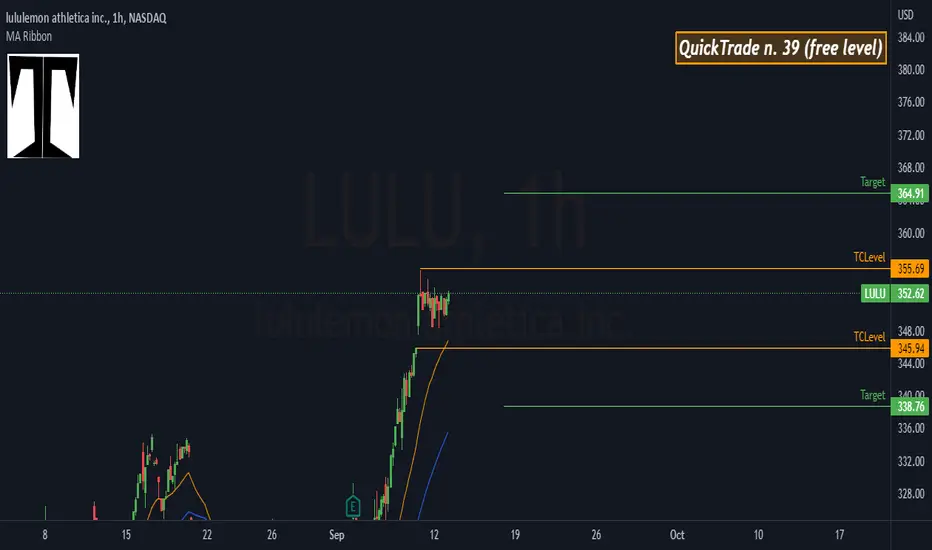
QuickTrade n. 39 on LULULooking for a continuation of the most recent breakout.
The short side sees a pullback AT LEAST on the 50h
$LULU with a Bullish outlook following its earnings #Stocks The PEAD projected a Bullish outlook for $LULU after a Positive over reaction following its earnings release placing the stock in drift B with an expected accuracy of 100%.
LULU shortLULU pi RSI is at 100 on the 1hr chart. A short entry trade is on my radar. Especially going into next week's macroeconomic Calendar events.
Do your own due diligence, your risk is 100% your responsibility. This is for educational and entertainment purposes only. You win some or you learn some. Consider being charitable with some of your profit to help humankind. Good luck and happy trading friends...
*3x lucky 7s of trading*
7pt Trading compass:
Price action, entry/exit
Volume average/direction
Trend, patterns, momentum
Newsworthy current events
Revenue
Earnings
Balance sheet
7 Common mistakes:
+5% portfolio trades, capital risk management
Beware of analyst's motives
Emotions & Opinions
FOMO : bad timing, the market is ruthless, be shrewd
Lack of planning & discipline
Forgetting restraint
Obdurate repetitive errors, no adaptation
7 Important tools:
Trading View app!, Brokerage UI
Accurate indicators & settings
Wide screen monitor/s
Trading log (pencil & graph paper)
Big, organized desk
Reading books, playing chess
Sorted watch-list
Checkout my indicators:
Fibonacci VIP - volume
Fibonacci MA7 - price
pi RSI - trend momentum
TTC - trend channel
AlertiT - notification
tickerTracker - MFI Oscillator
tradingview.sweetlogin.com
US Stock In Play: $LULU$LULU - Consumer Cyclical | Apparel Retail
breakout of year long bullish wedge pattern, retaking its 200MA, AVWAP from ATH and YTDH with higher lows since late may'22.
latest ER on 1/9 reports continual YoY growth for both EPs (+33%) and Sales (+29%)

Earnings watch 6/2Earnings watch 6/2:
DLTH
PD
RH
OKTA
HRL
TTC
LULU
CRWD
COO
LE
Do your own due diligence, your risk is 100% your responsibility. This is for educational and entertainment purposes only. You win some or you learn some. Consider being charitable with some of your profit to help humankind. Good luck and happy trading friends...
*3x lucky 7s of trading*
7pt Trading compass:
Price action, entry/exit
Volume average/direction
Trend, patterns, momentum
Newsworthy current events
Revenue
Earnings
Balance sheet
7 Common mistakes:
+5% portfolio trades, capital risk management
Beware of analyst's motives
Emotions & Opinions
FOMO : bad timing, the market is ruthless, be shrewd
Lack of planning & discipline
Forgetting restraint
Obdurate repetitive errors, no adaptation
7 Important tools:
Trading View app!, Brokerage UI
Accurate indicators & settings
Wide screen monitor/s
Trading log (pencil & graph paper)
Big, organized desk
Reading books, playing chess
Sorted watch-list
Checkout my indicators:
Fibonacci VIP - volume
Fibonacci MA7 - price
pi RSI - trend momentum
TTC - trend channel
AlertiT - notification
tickerTracker - MFI Oscillator
tradingview.sweetlogin.com
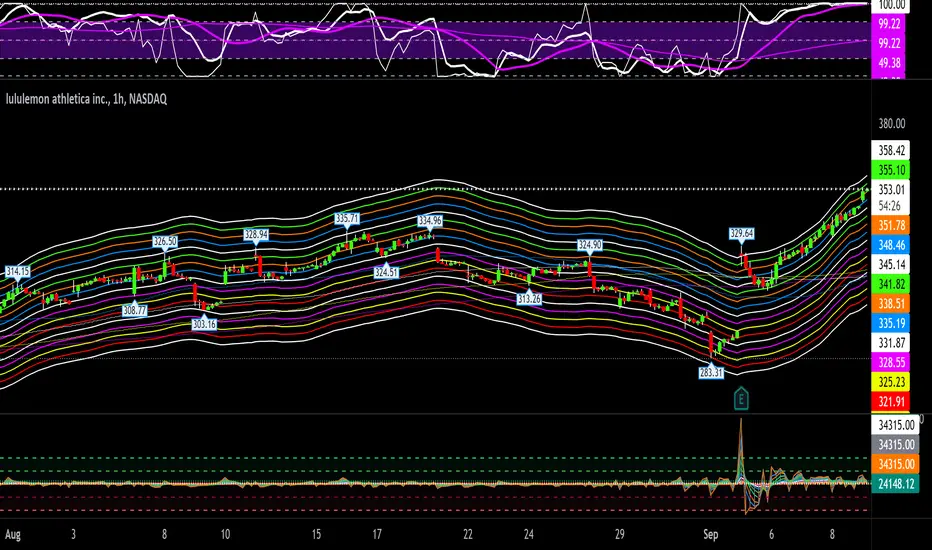
LULU: Fade the rally!Lulumelon Athletica
Short Term - We look to Sell at 329.26 (stop at 346.16)
They reported better than expected earnings and the stock jumped up premarket. The medium term bias remains bearish. We are assessed to be in a corrective mode higher. Bespoke resistance is located at 332.00. We therefore, prefer to fade into the rally with a tight stop in anticipation of a move back lower.
Our profit targets will be 284.68 and 272.00
Resistance: 332.00 / 410.00 / 478.00
Support: 283.00 / 246.00 / 129.00
Please be advised that the information presented on TradingView is provided to Vantage (‘Vantage Global Limited’, ‘we’) by a third-party provider (‘Signal Centre’) . Please be reminded that you are solely responsible for the trading decisions on your account. There is a very high degree of risk involved in trading. Any information and/or content is intended entirely for research, educational and informational purposes only and does not constitute investment or consultation advice or investment strategy. The information is not tailored to the investment needs of any specific person and therefore does not involve a consideration of any of the investment objectives, financial situation or needs of any viewer that may receive it. Kindly also note that past performance is not a reliable indicator of future results. Actual results may differ materially from those anticipated in forward-looking or past performance statements. We assume no liability as to the accuracy or completeness of any of the information and/or content provided herein and the Company cannot be held responsible for any omission, mistake nor for any loss or damage including without limitation to any loss of profit which may arise from reliance on any information supplied by Signal Centre.
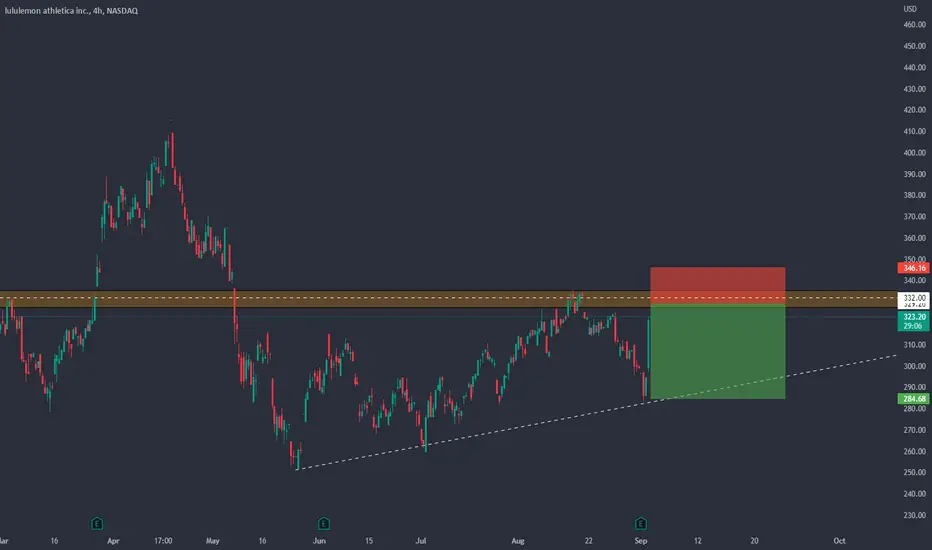
9/1 - Lulu Pre-Earnings Analysis Higher probability of downside move with Lulu earnings scheduled evening of 09/01:
1. Multi-month head and shoulders was cleanly pierced and then retested with downward pressure from its base.
2. Multi-week down trend off of 200 SMA.
3. Multi-day weakness leading to today, with overall rounding of price to the downside.
4. Multi-year support would occur around 245.
5. General market weakness and downward revisions from retailers.
Conclusion: Earnings volatility on 09/02 could see test of $245.
$LULU calls WE HAVE Basically already closed above resistance here WE NEED 1-2 candles on the daily above this lvl to ensure that this isn't just a fakout! There is a lot of range above resistance that we can play with

LULU Base breakoutLULU getting near base breakout. If market stays strong next week, LULU can breakout over 313. Keep in mind that market is extended for now. So risk is elevated for longs here compared to last 2 weeks.
AUG 5 220C can work