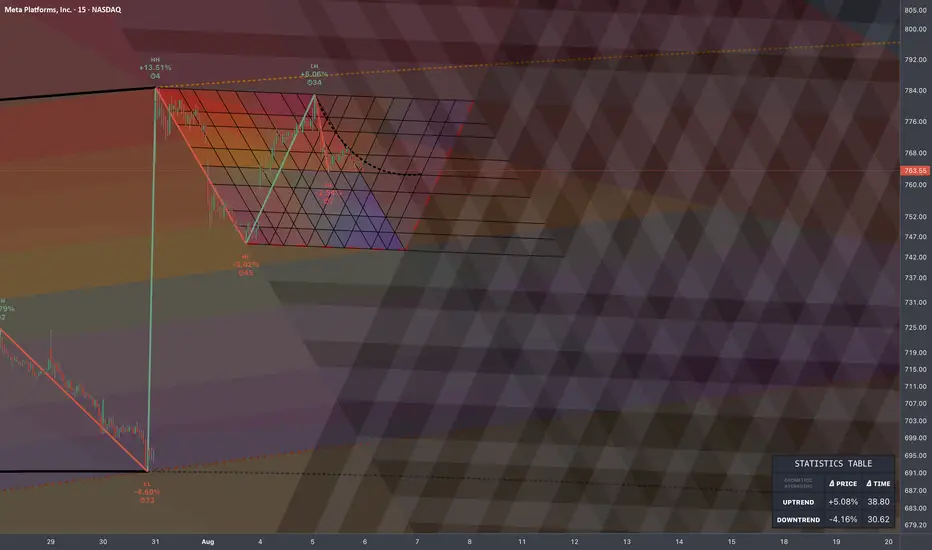
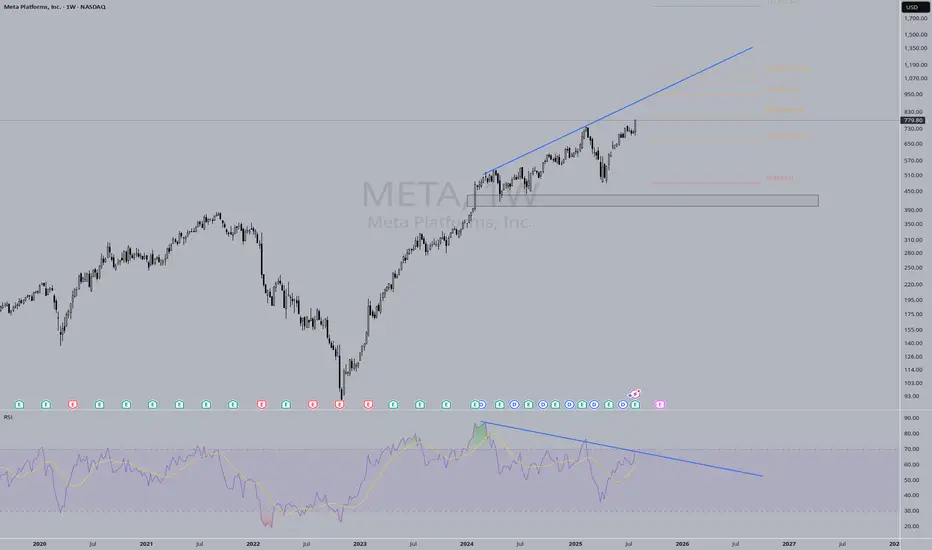
META: Price Entropy🏛️ Research Notes
Recent rejection from LH could be explained by spike out of scale, which in its turn was caused by buildup of counter force while correcting.
Those two are part of progression which was wired by longer selloff cycle.
If we scale back further, we would confirm overall structure's capacity set by growth patterns.
Those boundaries and space between them can be interpreted as supply zones, leaving us with this particular interconnection:
Though the object of observation would be the recent developments at minimal TF for publication (15m), so temporal patterns and cycle-derived levels can be thoroughly studies.
META trade ideas
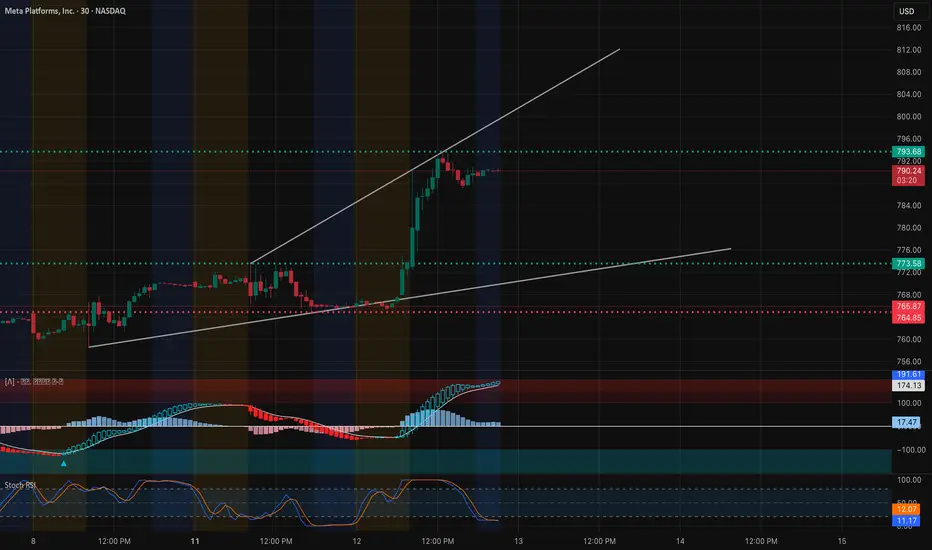
META – TA + GEX Confluence for August 13, 202530-Minute + 1-Hour GEX Combined Analysis
Price Action (30m)
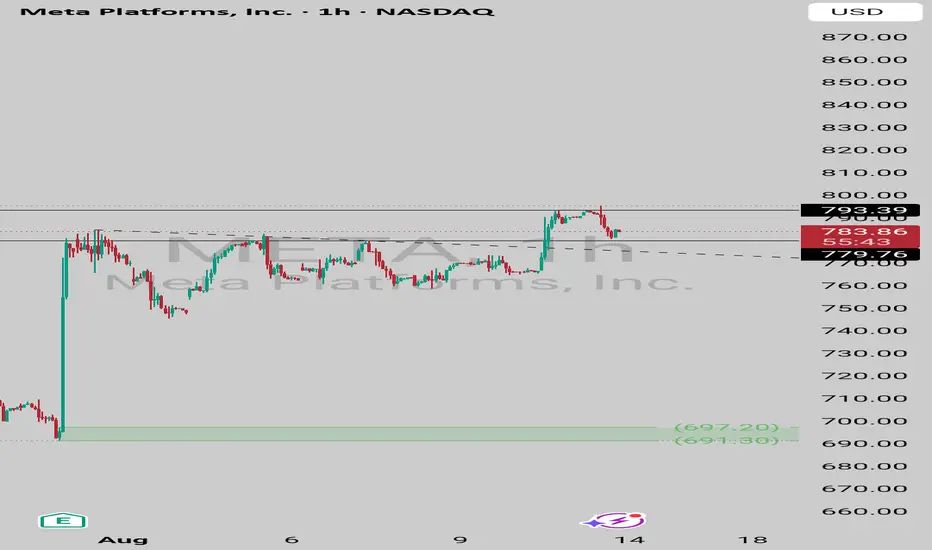
META broke out from the $773 zone, confirming a Break of Structure (BOS) midday and running into $793 resistance before showing a Change of Character (ChoCH). This late pullback signals short-term profit taking but not necessarily a trend reversal.
GEX Confluence (1h)
That $793 top is no coincidence — it’s the highest positive NET GEX level (Gamma Wall). This is where market makers are most incentivized to cap upside unless heavy call buying forces a hedge-driven breakout.
Key Levels for Tomorrow
* $793 – Major Gamma Wall / breakout trigger
* $781 – Short-term pivot / intraday support
* $773 – Strong GEX-backed demand zone
* Upside Target if Breaks $793 – $800–$805 (next GEX resistance layer)
* Downside Target if $781 Fails – $773 retest
Trading Outlook for Aug 13
* Bullish Breakout: Hold above $793 with volume could trigger a gamma squeeze toward $800–$805.
* Bearish Rejection: Fail at $793 + lose $781 opens path to $773.
* Neutral Chop: $781–$793 range-bound action possible if neither side dominates.
Reasoning
* The 30m chart shows the rally’s structure and key pivots.
* The 1h GEX map explains why $793 is such a heavy resistance and why $773 is the likely support zone.
* Tomorrow’s trading will likely be decided at $793 — a clean break could lead to rapid continuation, while rejection could see a controlled pullback.
Disclaimer: This analysis is for educational purposes only and does not constitute financial advice. Always conduct your own research and manage risk appropriately before trading.
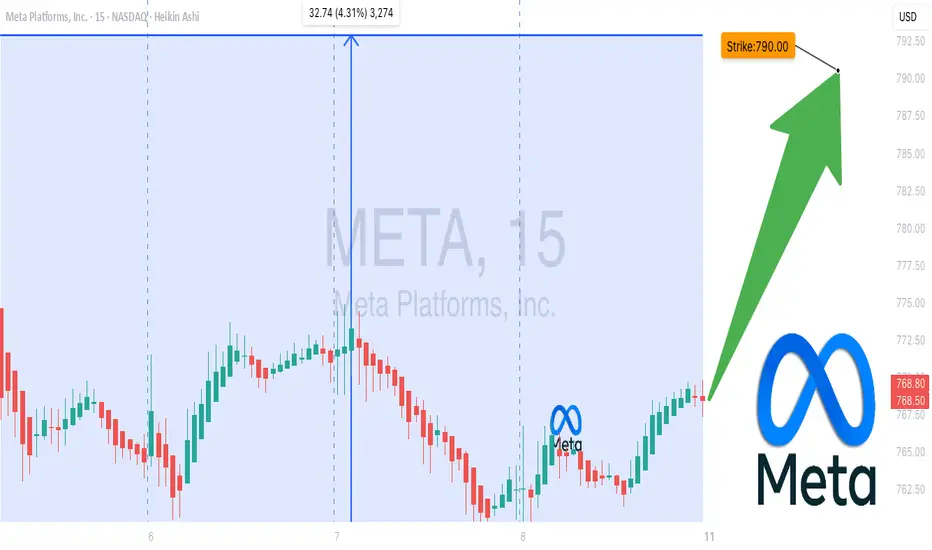
META Eyeing $800? Double-Up Play This Week! 📈 META Weekly Swing Setup (2025-08-10) 📈
**Bias:** ✅ **Moderate Bullish** — strong options flow + favorable volatility, but daily RSI and weak volume suggest caution.
**🎯 Trade Plan**
* **Ticker:** \ NASDAQ:META
* **Type:** CALL (LONG)
* **Strike:** \$790.00
* **Entry:** \$3.30 (open)
* **Profit Target:** \$6.60 (+100%)
* **Stop Loss:** \$1.80 (-45%)
* **Expiry:** 2025-08-15
* **Size:** 2 contracts
* **Confidence:** 65%
**📊 Key Notes**
* Weekly RSI 70.7 rising → bullish trend intact 📈
* Call/put ratio 1.83 → strong institutional sentiment ✅
* VIX falling to 15.15 → low vol favors directional plays 🛡️
* Volume 0.5x previous week → lighter conviction ⚠️
* Resistance watch: \$784.75 🔍
**💡 Play Idea:**
Enter Monday open → target quick upside before Thursday → cut early if price stalls at resistance.
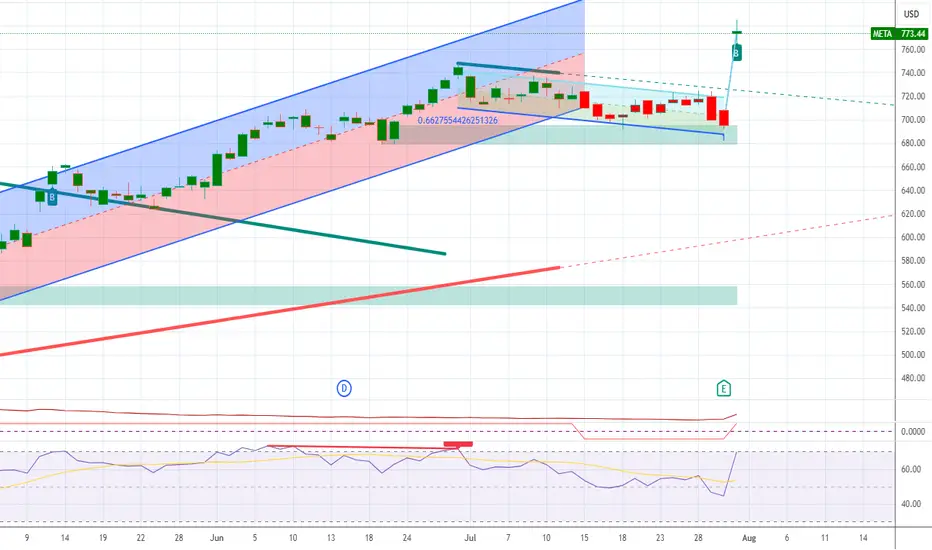
META daily updade(swing) Meta after break out is going retest the flag.
have 2 important point to get in.
ready to entry and watch out could fake break out.
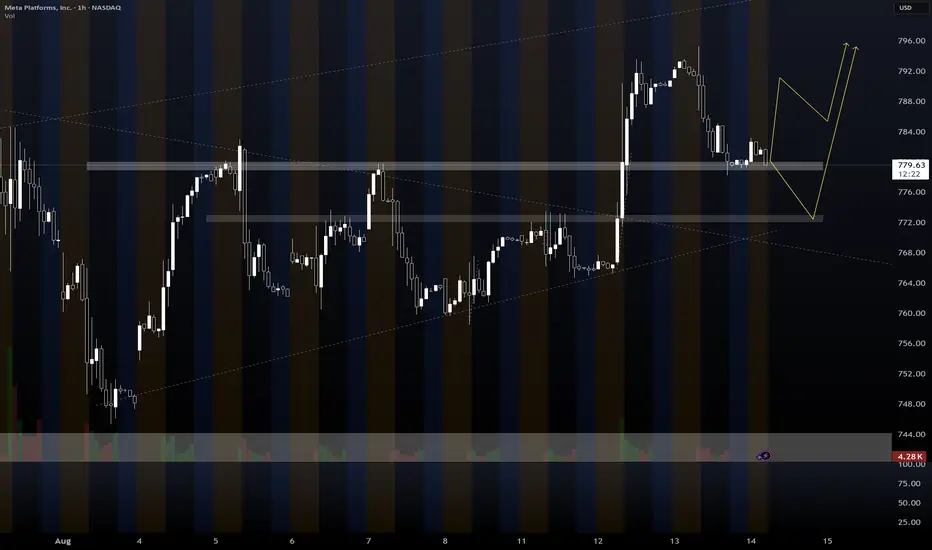
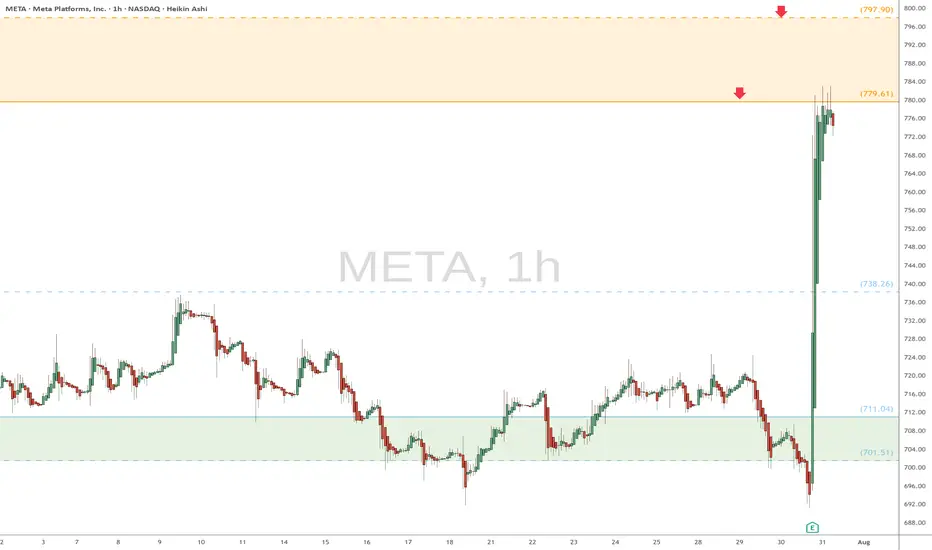
META watch $779 then 798: Dual Golden fib barrier to 800 round META earnings blew away the analyst expectations.
Surged into dual Golden fibs at $779.61 then 797.90
This "high gravity" zone will likely hold price for a bit.
.
See "Recent Publications" for previous charts ------------>>>>>>>>>
Such as this one that caught an HUGE BREAKOUT
Hit BOOST and FOLLOW for more such PRECISE and TIMELY charts.
=========================================================
.
Meta Platforms (META) Shares DeclineMeta Platforms (META) Shares Decline
Shares of the US tech giant Meta Platforms (META) hit a record high last week, climbing above $780 following the release of a strong earnings report:
→ Earnings per share (EPS) came in at $7.14, significantly exceeding the forecast of $5.88.
→ The company also outperformed expectations on key metrics related to advertising growth.
→ Additionally, the media has highlighted the growing importance of AI technology to Meta’s business.
However, shortly after reaching an all-time high, META shares began to show bearish momentum.
Technical Analysis of the META Chart
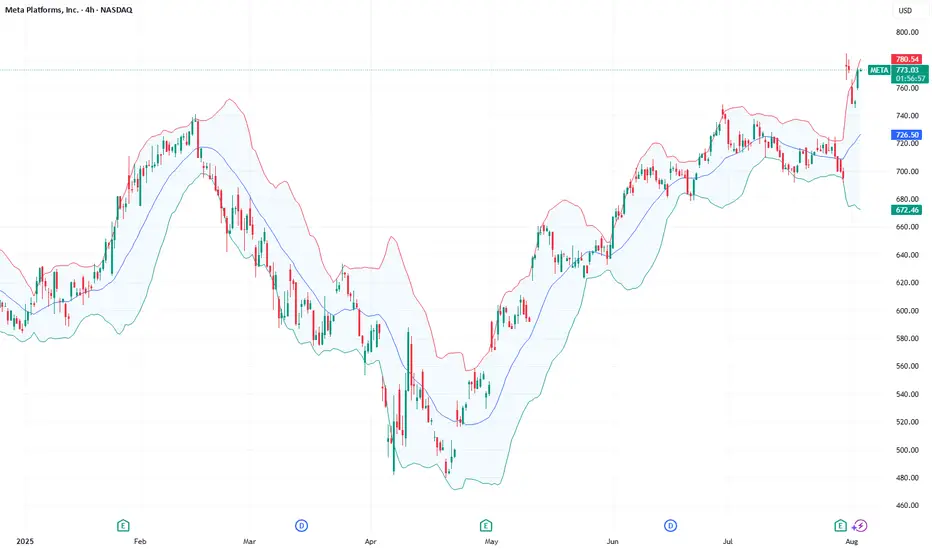
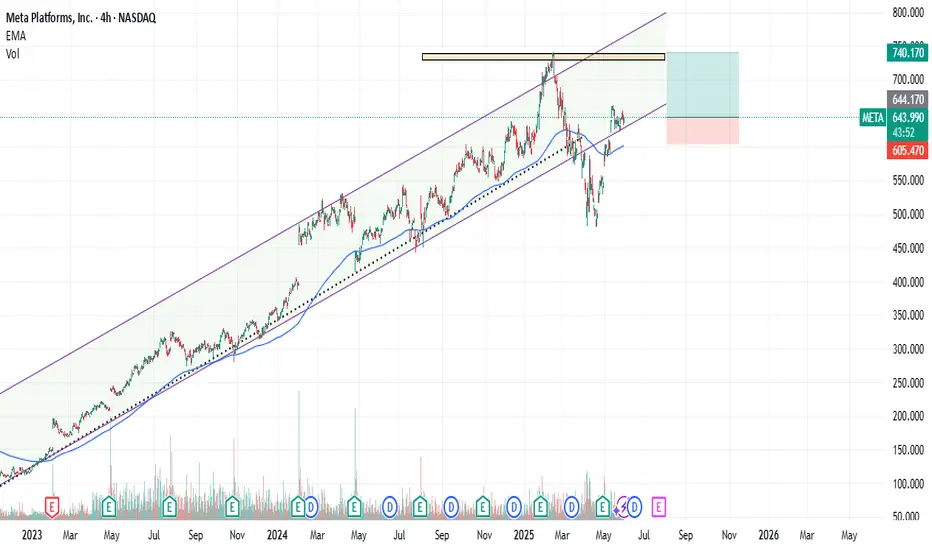
On the four-hour chart, the following signals are visible:
→ A bearish engulfing pattern formed on Thursday;
→ A bearish gap appeared at Friday’s market open, followed by a continuation of the downward move.
This represents a notable pullback from the historical peak — potentially indicating that the initial bullish reaction to the earnings report has faded. The share price decline suggests a correction from overbought territory, as confirmed by the RSI indicator.
The $740 level appears to be a key support zone — previously acting as major resistance before the breakout. Bulls could also find support from the median line and the lower boundary of the ascending channel that has been developing since mid-May.
Given this context, a scenario in which bulls attempt to resume the uptrend within the ascending channel cannot be ruled out, especially considering the company’s strong fundamentals and the presence of multiple technical support levels.
This article represents the opinion of the Companies operating under the FXOpen brand only. It is not to be construed as an offer, solicitation, or recommendation with respect to products and services provided by the Companies operating under the FXOpen brand, nor is it to be considered financial advice.

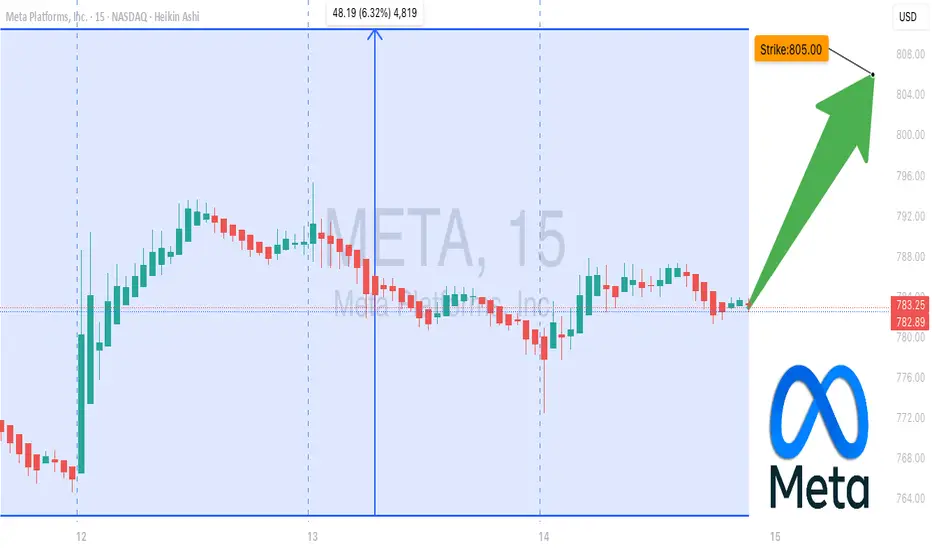
META Calls on Fire– Don’t Miss Out 🚀 META Bulls Eye \$805 – One-Day Call Sprint Before Expiry
**Sentiment:** 🟢 *Strong Bullish*
* **Daily RSI:** Rising 📈
* **Weekly RSI:** Rising 📈
* **C/P Ratio:** 1.82 → heavy call buying
* **Volume:** Weak (0.5× last week) → watch for hesitation
* **Gamma Risk:** HIGH — expiry in 1 day ⚡
---
### 📊 **Consensus Snapshot**
✅ All models agree: bullish momentum + strong options flow
⚠️ Weak volume + high gamma = manage risk tightly
---
### 🎯 **Trade Setup**
* **Type:** CALL (Single-Leg)
* **Strike:** \$805.00
* **Expiry:** 2025-08-15
* **Entry:** \$0.57
* **Profit Target:** \$0.85 (+49%)
* **Stop Loss:** \$0.34 (–40%)
* **Confidence:** 75%
* **Entry Timing:** Market open
---
💬 *High-momentum, high-risk expiry play — eyes on the tape all day.*
📌 *Not financial advice. DYOR.*
---
**#META #OptionsTrading #GammaSqueeze #DayTrading #StocksToWatch #TradingSignals #OptionsFlow**
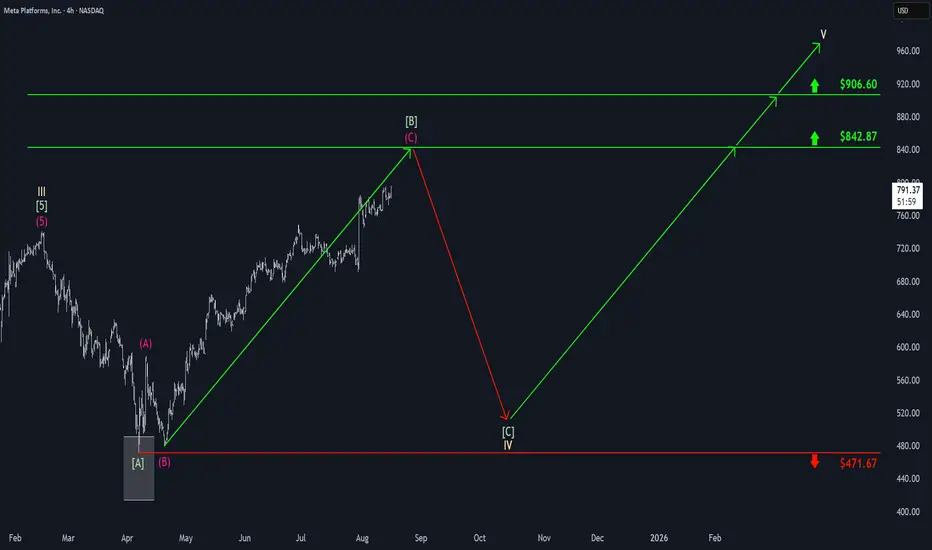
Meta: More Room to RunAfter a sharp rally, Meta has taken a more measured approach but continues to build on its upward momentum, even reaching a new all-time high. We’re still allowing for further gains in green wave , with room to run up to the new resistance at $842.87. Ideally, we would expect the price to reverse downward at that level to resume the broader correction. In wave , we’re preparing for potential sell-offs toward support at $471.67, though we still anticipate that the final correction low – and the subsequent trend reversal to the upside – will occur above this level. Looking further ahead, the next bullish cycle, wave V, is likely to drive Meta to new highs above $906.60 over the long term.
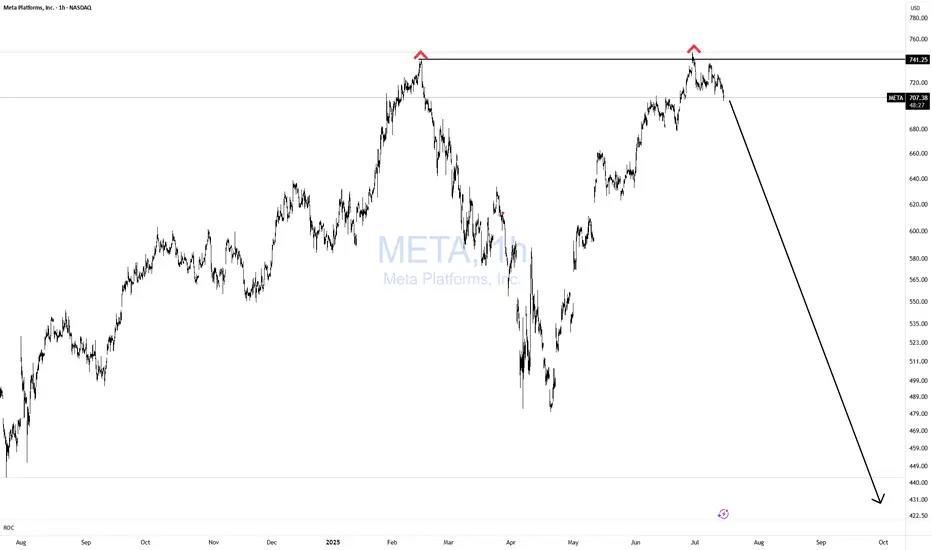
META Double Topping!Does it get any easier than this? NOPE!
If you can't spot this pattern from 1000 miles away, then you need a lot more time in the seat, training yourself in TA.
Simple with great risk reward!
Bulls GTFO!
META: Eyeing a Breakout. Aug.5META: Eyeing a Breakout — GEX Supports Upside Momentum 🚀
Technical Overview
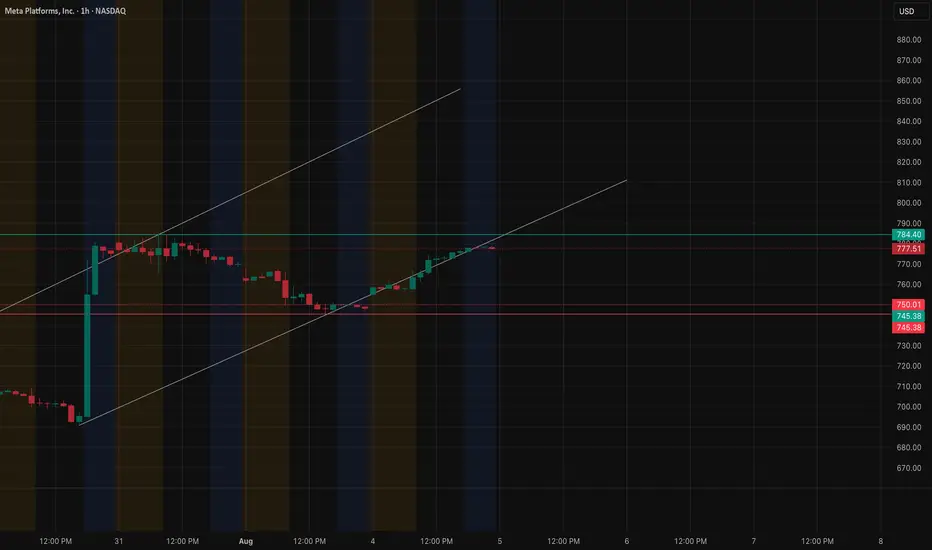
META has been showing consistent bullish recovery off the $691–$707 demand zone, climbing back into its rising channel. Price is now approaching a critical resistance cluster between $784–$790, where prior rejection and current GEX resistance converge.
GEX Insights
Options GEX shows the highest positive NETGEX at $790 — also aligning with the 2nd CALL Wall (91.31%). This means option dealers are heavily short calls at this level, creating a potential gamma squeeze scenario if price breaks and holds above it. Additional CALL interest extends toward $800–$820, suggesting upside expansion if momentum follows through. On the downside, GEX Put Support sits near $698–$707, reinforcing the major swing low zone as strong support.
1H Price Action Structure
* Strong bounce from channel midline support.
* Higher lows and higher highs forming, signaling bullish continuation.
* Resistance test ahead at $784–$790; breakout here may trigger stop runs and call delta hedging.
15M Short-Term View
* META is coiling under resistance with minor intraday pullbacks.
* Watching for breakout above $784 for aggressive scalps toward $790+.
* Failure here could trigger a retest of $770–$775 short-term support.
Options Trade Suggestion Based on GEX
* Bullish Play: Consider call spreads targeting $790–$800 if price clears and holds above $784 with volume.
* Risk Zone: If price fails to hold $770, momentum weakens and $750 becomes the next key support.
* Bearish Hedge: Put spreads only if rejection at $784–$790 is confirmed with breakdown through $770.
My Thoughts
GEX positioning clearly favors upside into $790 as long as $770 support holds. If META triggers the gamma breakout, the move could accelerate toward $800 quickly. Keep in mind that $790 is both a magnet and a ceiling — watch the breakout volume closely.
Directional Bias: Bullish leaning — favor long setups above $784.
Disclaimer: This analysis is for educational purposes only. Always do your own research and manage risk before trading.
METAIf 779.7 cannot hold we will see Meta in the green zone below the breaking trend.
I hope i'm wrong because i'm risking by holding call contracts.
Microsoft, Meta, Nvidia — Lifting Off in the AI MarketThe “Big Three” are breaking new records: #Facebook (Meta) surged to $784.39 as AI-powered targeting tools pushed ad revenues higher, #Microsoft hit $551.10 by combining rapid Azure growth with new monetization from Copilot across its ecosystem, and # Nvidia climbed to a record $183.21, driven by unwavering demand for AI computing.
Key growth drivers:
#Facebook (Meta): Markets welcomed strong ad revenue projections, outweighing concerns about capex. AI tools for ad targeting significantly improved performance.
#Microsoft: Azure’s YoY growth reached ~39%, Copilot crossed 100M monthly users, and the company committed up to $30B in upcoming AI infrastructure.
#Nvidia: Persistent demand for AI GPUs and networking gear from hyperscalers, plus a $4T valuation milestone, keeps momentum strong.
What’s fueling continued upside:
#Facebook (Meta): AI tools like Advantage+ improve audience targeting and ad creatives, while Reels and recommendation feeds increase impressions and eCPM. Large-scale investment in data centers and in-house AI models open new monetization paths. Stable rate expectations also favor growth stocks like META.
#Microsoft: Growth is driven by Azure’s ongoing expansion (~39% YoY), the second wave of cloud migration, and strong monetization via Microsoft 365 and GitHub Copilot. A $30B capex plan will expand data center capacity. A broad portfolio — Windows, Office, Gaming — supports steady margins.
#Nvidia: The AI compute supercycle is in full swing. Demand for H-series GPUs and InfiniBand networks exceeds supply. The clear upgrade roadmap (H200/Blackwell) extends through 2026, while CUDA ecosystem expansion strengthens customer lock-in. Strong cash flow and record valuation support M&A, buybacks, and accelerated development.
According to FreshForex , current price levels make #Meta and #Microsoft attractive for long positions. #Nvidia offers room for both upside and pullbacks, depending on news flow.
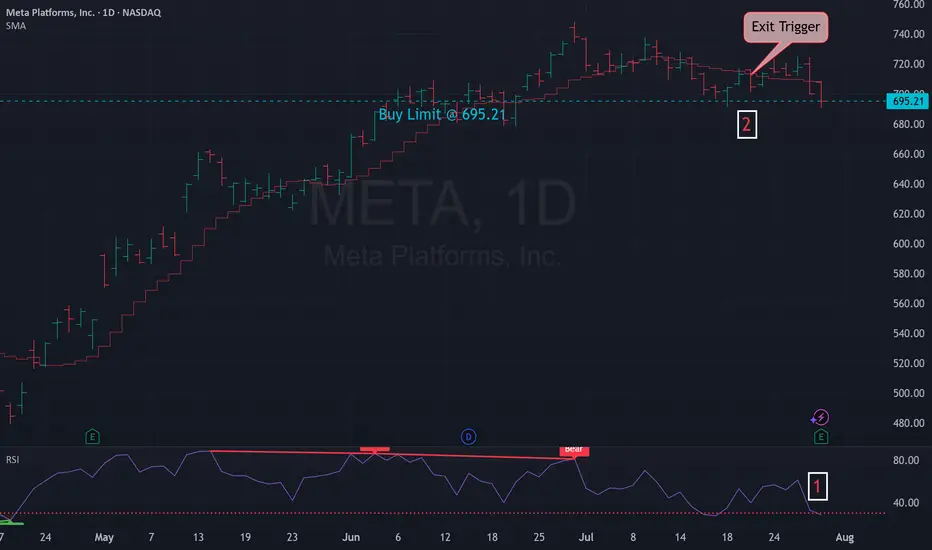
Mean Reversion Trade: META1. RSI in oversold region
2. Price likely to rebound back the the mean
Trade Rules:
Entry Trigger - RSI has cross below oversold region, enter limit buy at close price
Exit Trigger - Close at market when close price cross above exit trigger (Red step line)
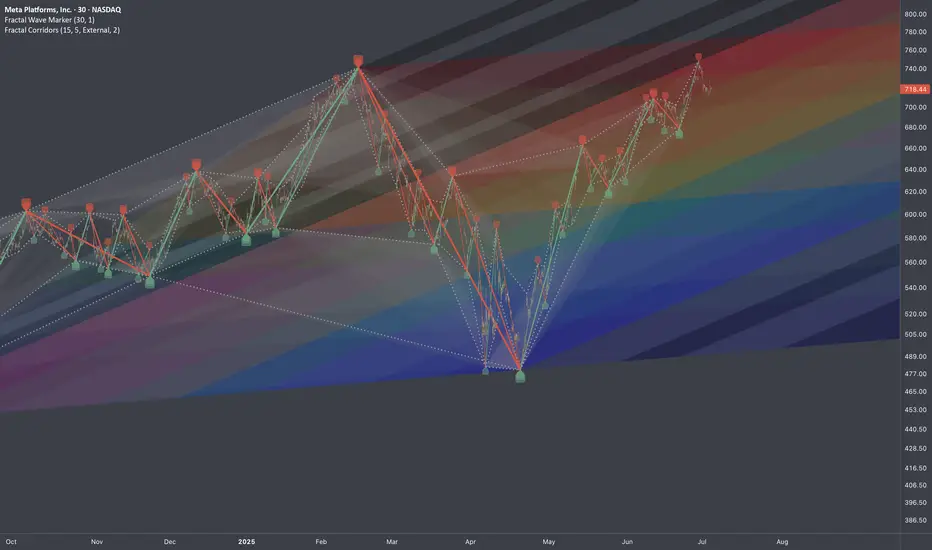
META: Testing Alternative Interconnection TypeResearch Notes
Given expression like this:
Fractal Corridors can be used for horizontal perspective of the same pattern manifestation. Alternative frames of reference exposes how historic swings of various magnitude in some way wire the following price dynamics. tradingview.sweetlogin.com helps to seek a matching commonality in angles of trends which gives a hint how structure evolves in multi-scale perspective.
I use both when it comes to working with complex waves and making interconnections through fibonacci ratios.
To define emerging wave's limits (probable amplitude), I'll test classic rule of Support/Resistance shift in fibs. (When resistance becomes support or vice versa)
By theory it means a trendline can also shift like that.
In our case this can be applied as:
Fibocnacci Structure:
META Double Top? Think Again. Hello, my name is The Cafe Trader.
As part of our MAG 7 Series, we tackle META next on the list.
This article is for:
– Long-Term Investors
– Long-Term Hedges
– Swing Traders
– Options Traders
⸻
Brief Notes:
1. Meta is going all-in on AI, integrating it across all platforms (Instagram, Facebook, WhatsApp…).
2. 97% of Meta’s revenue still comes from ads. They’ve rebounded strongly from Apple’s policy changes—thanks in large part to AI targeting.
3. Meta is thinking long-term with AR/VR.
4. International user growth has exploded.
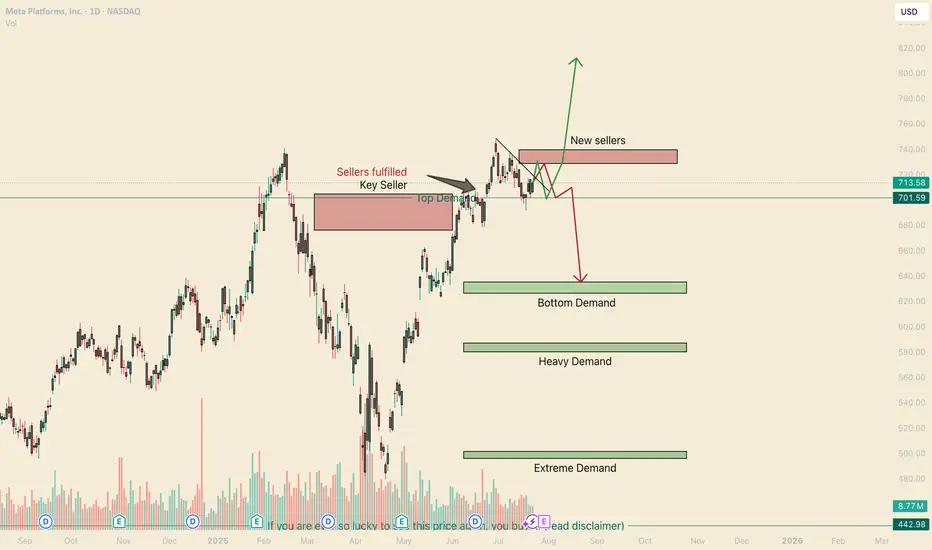
Conclusion: Bullish winds continue to blow behind META.
⸻
Long-Term Levels
• Aggressive Buy = $701.59 → Marked as “Top of Demand.” This is where aggressive buyers are looking to add.
• Good Value = $626–$635 → Marked “Bottom of Demand.”
• STEAL = $496–$501 → Marked “Extreme Demand.”
Why not buy at the ‘Heavy Demand Zone’?
Great question. If bears take out those buyers above this zone, it suggests something major has shifted in sentiment around META.
Even though there’s heavy demand here, I’d want to observe how sellers approach the area. You’ll likely get multiple chances to enter if buyers defend it. But if it breaks down, the best pricing lies at “Extreme Demand.”
For long-term holders looking to hedge downside, I suggest a Bear Put Spread or outright puts. More on this under the Red Scenario Options.
⸻
For Traders
Let me be real—this chart is tricky.
The V-shaped recovery signals strong bullish interest. That insane rally took out a major seller, further fueling the bulls.
That said, how we pulled away from the previous ATH (all-time high) shows weakness—low buying interest, followed by a real seller stepping in.
So yeah, I’m mixed on sentiment. But I’m confident in identifying liquidity and managing exits fast.
⸻
Two Scenarios
✅ Green Scenario
– Stock:
The bounce off “Top of Demand” is a strong bullish signal. Bears will be under pressure around $729, though I expect one more rejection before we break through.
I liked the original entry at “Top of Demand.” If entering again, I’d wait for a crack below that zone and watch the close—if we recover and close above it (especially if the dip was deep), that’s a strong signal to re-enter.
Target: take partial or full profits around $729. Hold the rest for highs or a breakout.
– Options:
If you can grab the 715 Calls with 3–5 days out for under $4.50, this setup could easily hit 2–3R.
Even better if you can get closer-to-the-money contracts for cheaper.
⸻
❌ Red Scenario
– Stock:
I believe this “new seller” is a fabricated seller—likely to get squeezed.
But if no new buying interest shows up to challenge that seller, we could see pressure on “Top of Demand” and a legit correction, maybe even a broader consolidation range.
Next few days will reveal the strength of buyers.
If no aggressive buying steps in, I like the short setup, targeting “Bottom of Demand” for TP.
– Options:
Long-Term Holders:
Use 2–3% of your META share value on a Bear Put Spread or put options.
If using puts, get 2–3 weeks of time. Go as close to the money as your risk allows.
Active Traders:
This could move fast if it plays out. If you can grab a 710 Put with 3–5 days for under $1.00, hold until a big red candle (3–5%) forms.
If it keeps dragging down, roll into a new contract the following week.
⸻
Follow for more analysis and updates — and as always,
Happy Trading.
📲 @thecafetrader
META : Old Peak can be TestedMeta platform has lost altitude from the channel it has formed since 2023, but has gained momentum and re-entered the channel. The possibility of testing the old peak contains a good RR rate.Of course, with a stop-loss close to the 200-period moving average.( Risk/Reward Ratio : 2.48)
Stop-Loss: 605.47
Target : 740.10
META Bearish RSI Divergence?RSI bearish divergence occurs when price makes a higher high, but the Relative Strength Index (RSI) forms a lower high. This mismatch signals weakening bullish momentum and hints at a potential trend reversal to the downside
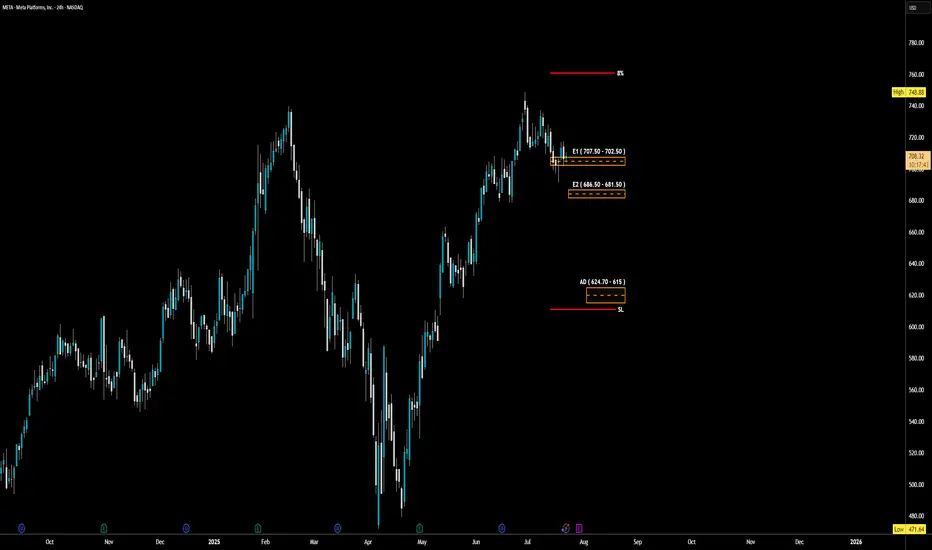
META - LONG Swing Entry PlanNASDAQ:META - LONG Swing Entry Plan
Entry Zone 1: $707.50 – $702.50
→ Open initial position targeting +8% from entry level.
Entry Zone 2: $686.50 – $681.50
→ If price dips further, average down with a second equal-sized entry.
→ New target becomes +8% from the average of Entry 1 and Entry 2.
Edit Zone (Aggressive Demand): $624.70 – $615.00
→ If reached, enter with double the initial size to lower the overall cost basis.
→ Profit target remains +8% from the new average across all three entries.
Risk Management:
Stop Loss:
Risk is capped at 12% below the average entry price (calculated across all executed positions including the Edit Zone).
Position Sizing Approach:
Entry 1: 1x
Entry 2: 1x
Edit Zone: 2x
→ Total exposure: 4x
→ Weighted average determines final TP and SL calculations.
______________________________________
Legal Disclaimer
The information provided in this content is intended for educational and informational purposes only and does not constitute financial, investment, or legal advice or recommendations of any kind. The provider of this content assumes no legal or financial responsibility for any investment decisions made based on this information. Users are strongly advised to conduct their own due diligence and consult with licensed financial advisors before making any financial or investment decisions.
Sharia Compliance Disclaimer: The provider makes no guarantees that the stocks or financial instruments mentioned herein comply with Islamic (Sharia) principles. It is the user’s responsibility to verify Sharia compliance, and consultation with a qualified Sharia advisor is strongly recommended before making any investment decisions
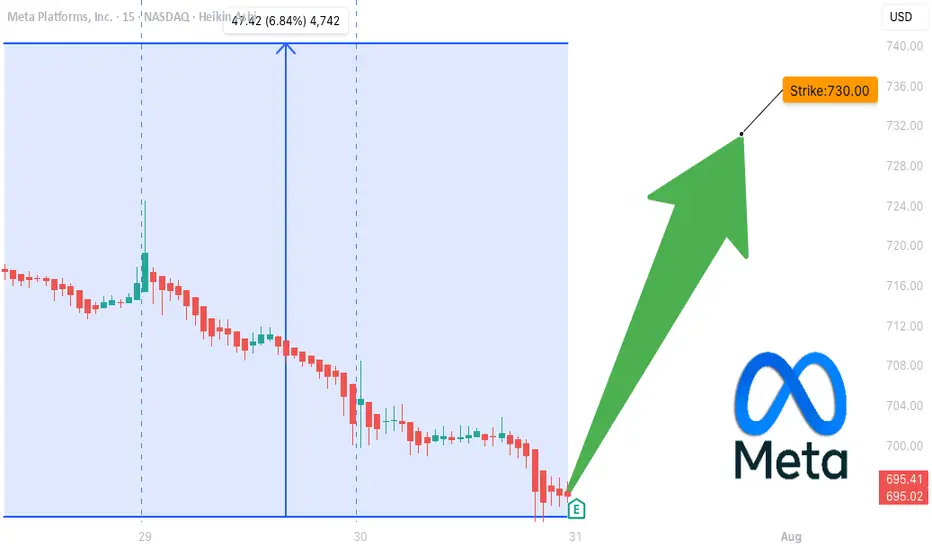
META Earnings Trade Setup — July 30 (AMC)
## 🧠 META Earnings Trade Setup — July 30 (AMC)
📈 **META (Meta Platforms Inc.)**
💥 **Confidence**: 85% Bullish
💡 **Play Type**: Pre-earnings call option
📊 **Fundamentals + Flow + Setup = High Conviction Swing**
---
### 📊 FUNDAMENTALS SNAPSHOT
✅ **Revenue Growth**: +16.1% YoY
✅ **Profit Margin**: 39.1%
✅ **Gross Margin**: 81.8%
📈 **8/8 EPS Beats** — Avg Surprise: +13%
🧠 **Digital Ad Rebound + AI Integration = Growth Engine**
🟢 **Score: 9/10**
📌 Bottom line: Elite execution + consistent guidance beats
---
### 🔥 OPTIONS FLOW CHECK
💰 **Call Walls**: \$720 / \$730
📈 **Call/Put Skew**: Bullish tilt
🔎 **IV Rank**: 0.65 — High enough for a move, not extreme
📈 **Market Expectation**: \~6% move
🟢 **Score: 8/10**
📌 Institutional flow leans long — smart money eyes upside
---
### 📉 TECHNICAL SETUP
📍 **Price**: \~\$700
📉 RSI: 34.34 → OVERSOLD
📉 20D MA: \$713.27 (near-term bounce target)
📌 Support: \$692.50 | Resistance: \$720
🟡 **Score: 7/10**
📌 Post-consolidation rebound setup into earnings
---
### 🌎 MACRO CONTEXT
💡 Growth + AI names in focus
📢 Communication Sector → Risk-On Rotation
📌 META riding digital ad/AI secular trends
🟢 **Score: 8/10**
📌 Macro tailwinds match company strengths
---
## 🎯 TRADE IDEA
**META 08/01 \$730 CALL**
💵 Entry: \$10.00
🎯 Target: \$30.00 (300% ROI)
🛑 Stop: \$5.00 (50% loss cap)
⏰ Entry: Pre-close on July 30 (AMC earnings)
📏 Size: 1 Contract (Risk \$1,000 max)
### ⚖️ Risk/Reward
* Max Risk: \$1,000
* Target Profit: \$3,000
* IV Crush Protection: **Exit within 2 hours post-earnings**
---
## 📌 WHY IT WORKS
✅ Meta beats 8 straight quarters
✅ Fundamentals elite
✅ Bullish options stack
✅ Oversold tech setup
⚠️ Risk? Always — but *structured speculation wins* 📐
---
📣 Tag someone who trades earnings like a sniper 🎯
\#META #EarningsPlay #OptionsTrading #IVCrush #CallOptions #TechStocks #AIStocks #TradingView #DigitalAds #SwingTrade #StructuredRisk
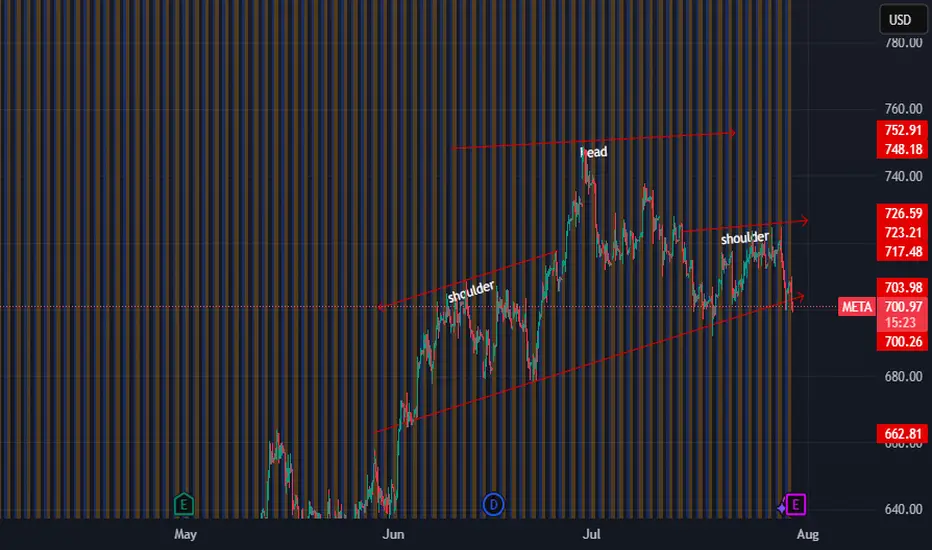
Head and shoulders showing a head and shoulders pattern on the hourly, I am looking for a 680-profit target and a 710 - 715 stop loss with a 700 - 705 entry
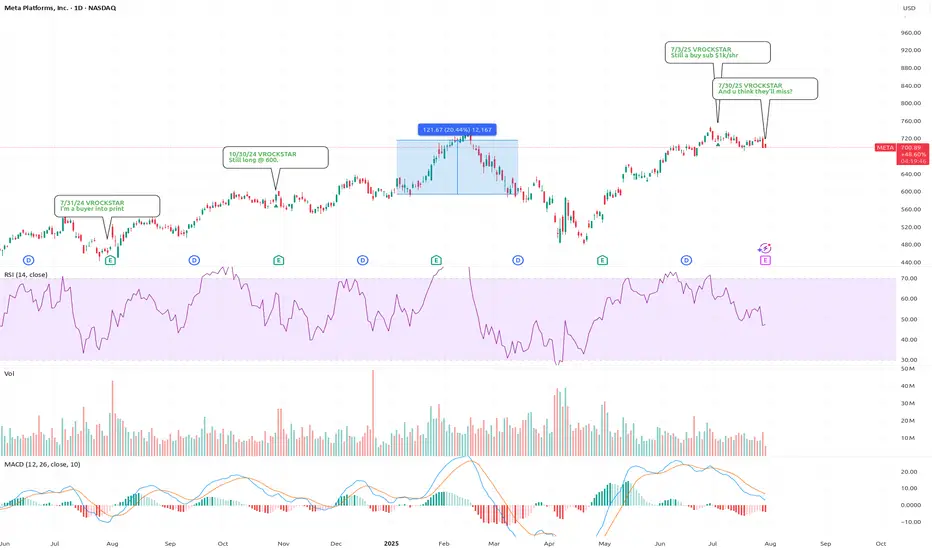
7/30/25 - $meta - And u think they'll miss?7/30/25 :: VROCKSTAR :: NASDAQ:META
And u think they'll miss?
- we continue to collect data pts that the consumer is spending like a drunken sailor and somehow the market still wants to bid the trash meme stocks that will burn cash until kingdom come
- amazon prime day
- dubious/ but still... government data
- yesterday... visa... booking
- we've seen the "oh look at NYSE:DECK , we thought people stopped buying shoes" reaction
- the reality is... the wealth effect has had a bit of a boomerang in my estimation from mar/apl stonk lows to new highs and "all normal" (big quotes)
- so as the king funnel to driving all this conversion, great tools... i don't think zuck's capex and hiring spending is really going to drive the big picture here on results. a strong ads result pays for all this spending... in what, a quarter?
- so no i don't have a crystal ball. but i'm surprised a lot of HQ names that are consumer-adjacent (esp such a dominant portal to the universe-META) aren't ripping into results and it's a harder call.
- this one is a buy into results
- it's a dip buy on a miss
- and it's a buy, probably, even if the stock rips
$1000 by year end is my best guess
V
MSFT & META Daily Trade SetupsIn this update we review the recent price action in Microsoft & Meta and identify the next high-probability trading opportunities and price objectives to target. To review today's video analysis clcik here!
