Is this possible with METAIs this possible with META?
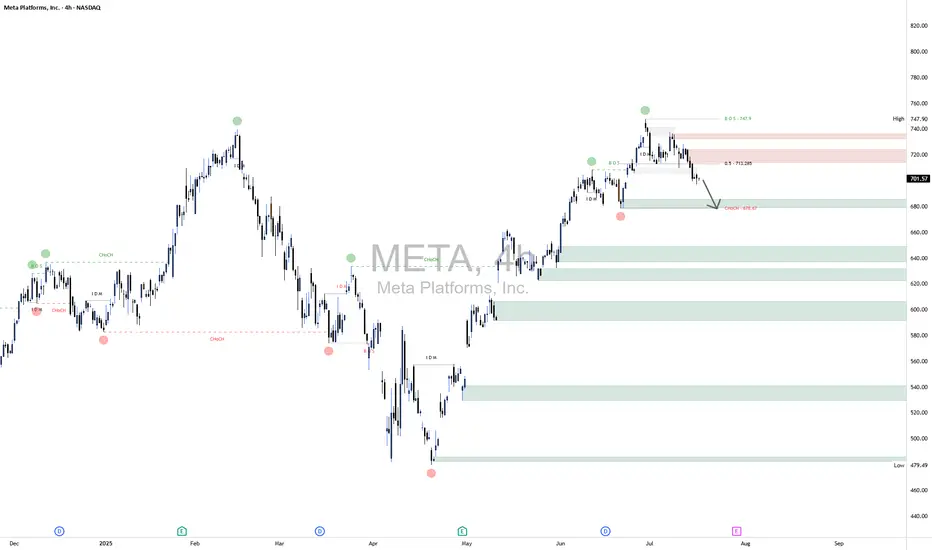
META stock is currently trading at $700.
My technical view as shown on the chart, is looking at a possible retracement to around $650.
The question is ''Is this possible?
If it ever gets to this forecasted zone, I will accumulate massively.
META trade ideas
Meta surprises to the upside & strengthens its leadership in AIBy Ion Jauregui – Analyst at ActivTrades
Meta Platforms (TICKER AT: META.US) has posted strong quarterly results that significantly exceeded market expectations, driven by its solid positioning in artificial intelligence, advertising monetization, and the resilience of its digital ecosystem.
Key Financial Highlights
In the second quarter of 2025, Meta reported revenues of $38.72 billion, representing a 15% year-over-year increase, beating consensus estimates by over $1 billion. Net profit reached $13.46 billion, with an adjusted EPS of $5.22, reflecting strong operating leverage.
The advertising segment remains the main growth driver, but revenue gains from generative AI services and enterprise solutions powered by Meta AI and Llama 3, its proprietary language model, were also noteworthy. Meanwhile, Reality Labs, although still operating at a loss, managed to contain its deficits and improve efficiency, while preparing for upcoming product launches linked to the metaverse.
The company maintains a robust cash position with over $58 billion in liquidity, and announced a new $25 billion share buyback program, reinforcing its commitment to shareholder value creation.
Fundamental Analysis
Meta is solidifying its strategic transition into a tech conglomerate focused on AI, personalized advertising, and immersive environments. Despite ongoing regulatory challenges in the U.S. and Europe—having yielded this time to Brussels—the company has maintained strong growth in daily active users (DAUs) and monthly active users (MAUs) across its core platforms: Facebook, Instagram, and WhatsApp.
Consistent investment in AI infrastructure and data centers, coupled with an improved operating margin now at 39%, positions Meta among the most efficient players in the tech sector.
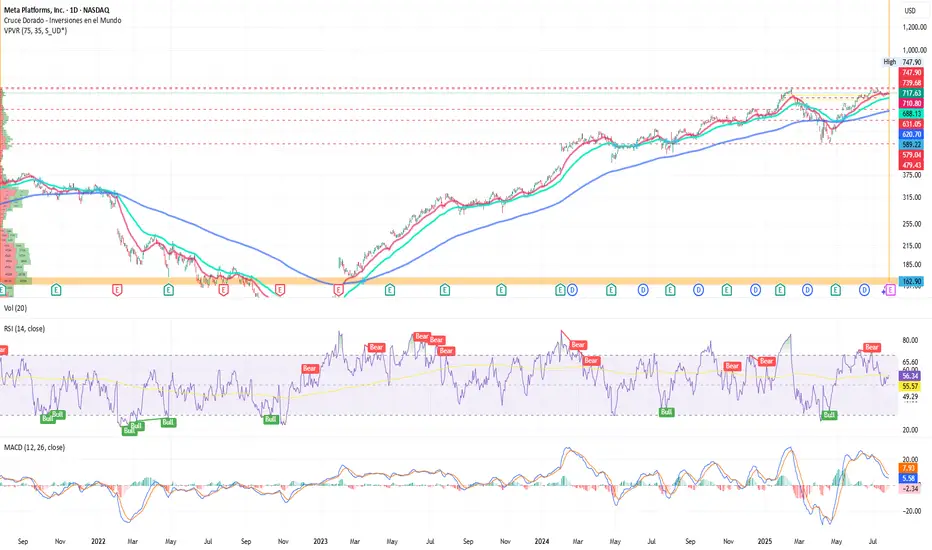
Technical Analysis
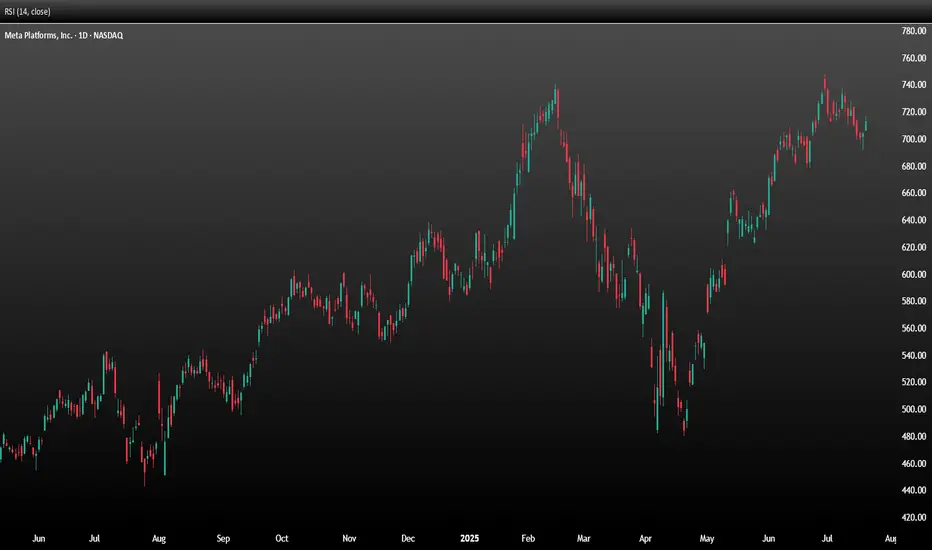
From a technical standpoint, Meta is currently trading around $717, following a near 50% rally since April. The daily chart shows a clear uptrend with higher lows in place since November 2022.
The RSI stands at approximately 56.34%, indicating strength without entering overbought territory.
The 50-, 100-, and 200-day moving averages remain aligned in a bullish formation.
The next resistance level is at the all-time high of $747.90; a breakout could pave the way toward $800 in the short term.
The key support level lies at $689, where the 100-day moving average and recent price action converge.
The Point of Control (POC) sits around $590, marking the base of the previous upward move and the recent golden cross that triggered the current rally.
Conclusion
Meta continues to affirm its leadership in the tech sector—not just as a social media powerhouse, but as a key player in the development and implementation of AI-based solutions. Revenue diversification, cost control, and a solid financial structure reinforce its position in an increasingly competitive market. While macroeconomic volatility and regulatory pressures remain, the combination of technical momentum and strong fundamentals suggests the bullish trend could continue.
*******************************************************************************************
La información facilitada no constituye un análisis de inversiones. El material no se ha elaborado de conformidad con los requisitos legales destinados a promover la independencia de los informes de inversiones y, como tal, debe considerarse una comunicación comercial.
Toda la información ha sido preparada por ActivTrades ("AT"). La información no contiene un registro de los precios de AT, o una oferta o solicitud de una transacción en cualquier instrumento financiero. Ninguna representación o garantía se da en cuanto a la exactitud o integridad de esta información.
Cualquier material proporcionado no tiene en cuenta el objetivo específico de inversión y la situación financiera de cualquier persona que pueda recibirlo. La rentabilidad pasada y las estimaciones no sinónimo ni un indicador fiable de la rentabilidad futura. AT presta un servicio exclusivamente de ejecución. En consecuencia, toda persona que actúe sobre la base de la información facilitada lo hace por su cuenta y riesgo. Los tipos de interés pueden cambiar. El riesgo político es impredecible. Las acciones de los bancos centrales pueden variar. Las herramientas de las plataformas no garantizan el éxito.
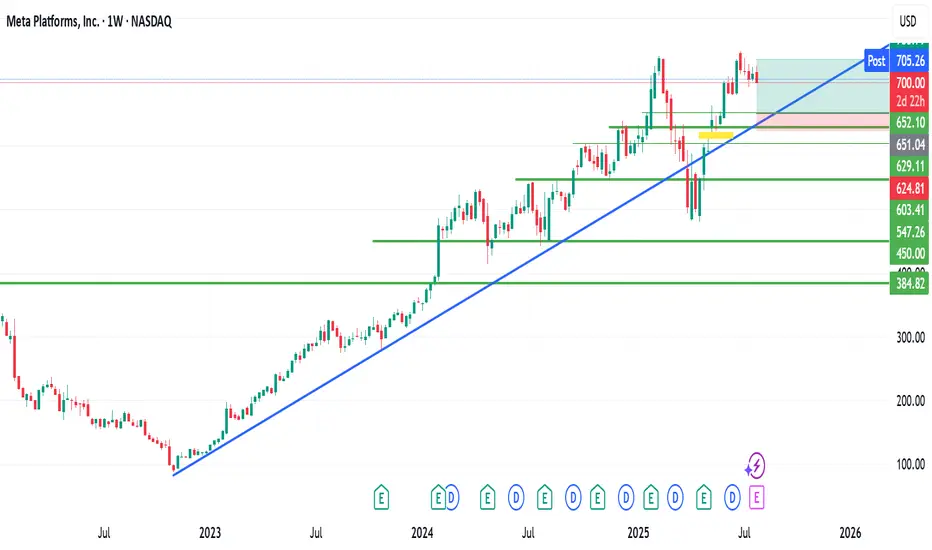
Meta - The breakout in question?🪓Meta ( NASDAQ:META ) is retesting major structure:
🔎Analysis summary:
After Meta perfectly retested a major previous support trendline in 2022, the trend shifted bullish. We have been witnessing an incredible rally of about +700% with a current retest of the previous all time highs. Time will tell but a bullish breakout remains quite likely.
📝Levels to watch:
$750
🙏🏻#LONGTERMVISION
Philip - Swing Trader

Incoming 40% correction for FacebookOn the above 10 day chart price action has rallied 500% since October 2022. It is somewhat unfortunate to see so many long ideas at the moment.
Motley Fool August 8th:
“Here's how Meta could achieve a $2 trillion valuation within three years, and if it does, investors who buy the stock today could earn a 67% return.”
Very misleading.
Why bearish?
Failed support. It is very clear to see, price action has broken through support and confirmed it as resistance. You can see this more clearly on the Log chart below.
Regular bearish divergence. Multiple oscillators now print negative divergence with price action across a 50 day period.
On the monthly chart below a hanging man candle print can be seen. Although the candle does not confirm until the end of the month there is a clear indication of buyer exhaustion. This is an important trend reversal indication.
Is it possible price action continues to rise? Sure.
Is it probable? No.
Ww
Log chart
Monthly hanging man candlestick

BofA note: Revenue strength could ease AI spending uncertaintyStrong Q can reinforce confidence in AI ad engine: With AI ROI a key stock sentiment driver, 2Q positives could include:
1) Ad rev upside reinforcing confidence in Meta’s AI ad engine,
2) strong road map for 2H ad products,
3) optimism on new revenue opportunities for AI (Llama licensing, subscriptions, etc.) With Street likely anticipating 2Q revenue upside, risks are high expectations and higher expenses offset revenue revisions. Also, EU regulatory uncertainty is likely to continue.
AI positioning optimism reinforced by performance:
Given recent CEO posts, we expect big focus on AI investment and opportunities on the call, with possible updates on Llama and AI monetization strategies. Given audience scale, we continue to see Meta as one of the best AI opportunity stocks, with potential revenue upside as AI capabilities are integrated into the ad stack. At 24.5x our 2025 EPS, and with more investment coming, continued rev. momentum (which we expect) and a convincing AI product roadmap are key for maintaining sentiment & multiple.

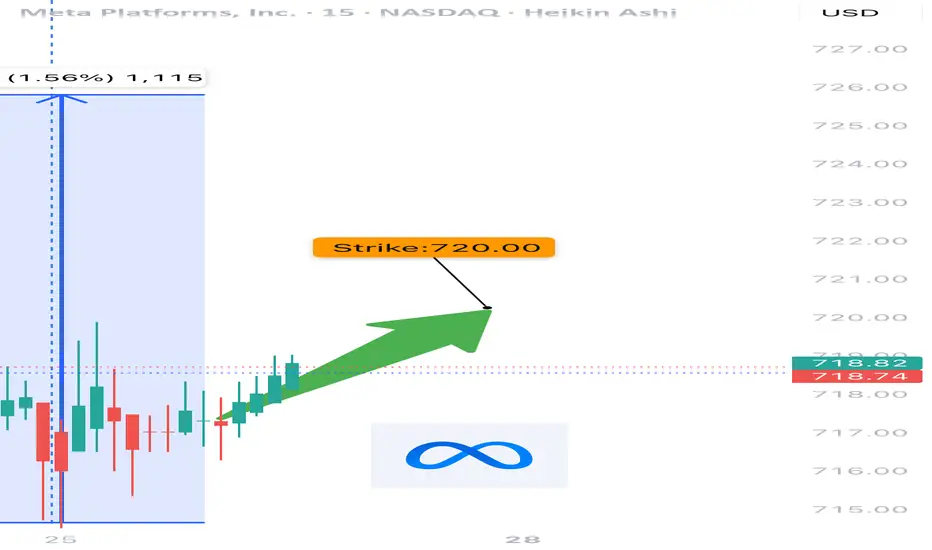
META EARNINGSMETA is consolidating below resistance at 720, with visible absorption just under 710. Institutional activity shows active PUT selling at 700 and directional BUY CALLs around 715–720. This suggests accumulation and potential upside pressure.
If price closes above 715 this week, a breakout toward 725–730 becomes likely, especially ahead of earnings. Support remains firm at 700, with a deeper level at 620 if rejection occurs.
Upside target: 745
Downside target: 700, then 620 if broken
#META #globaltrade #investment #investing #stockmarket #wealth #realestate #markets #economy #finance #money #forex #trading #price #business #currency #blockchain #crypto #cryptocurrency #airdrop #btc #ethereum #ico #altcoin #cryptonews #Bitcoin #ipo

META CANT KEEP THE HULK DOWN!!!!META has been consolidating for a few weeks now, but it's still in this bull flag that looks like it might break out soon, hopefully before earnings on Wednesday, July 30. I love technical analysis on charts, and this inverse head and shoulders pattern has been effective on most semiconductor names lately. We will know for sure next week.
META WEEKLY TRADE SETUP – JULY 25, 2025
📈 META WEEKLY TRADE SETUP – JULY 25, 2025 📈
🔥 Institutional Bulls Are In Control — 3.05 C/P Ratio!
🚨 BUT — It’s 0DTE Friday, so don’t get caught in gamma fire.
⸻
🧠 Model Consensus:
✅ All Models = STRONG BULLISH
⚠️ Entry Timing: Monday preferred (due to gamma + time decay)
📉 Volume still weak = caution on conviction
⸻
🔍 META Flow Stats:
• 🟢 Calls: 65,379
• 🔴 Puts: 21,409
• 📊 C/P Ratio: 3.05 = Institutional bulls stepping in hard
⸻
✅ RECOMMENDED TRADE – PLAN FOR MONDAY
🎯 Instrument: META Call Option
🟢 Strike: $720
📅 Expiry: August 1, 2025
💵 Entry Price: $0.97
💰 Profit Target: $1.45
🛑 Stop Loss: $0.49
⚖️ Confidence: 75%
🕒 Entry Timing: Market open Monday
⸻
⚠️ TRADE NOTES:
• Don’t enter on Friday – too much gamma risk
• Wait for volume confirmation Monday morning
• Expect short-duration swing (hold 3–5 days max)
⸻
📊 Smart money is bullish, timing is everything.
👍 Like & Follow if META is on your radar!
#META #OptionsTrading #0DTE #GammaSqueeze #BullishSetup #TradingView #WeeklyOptions #TechStocks
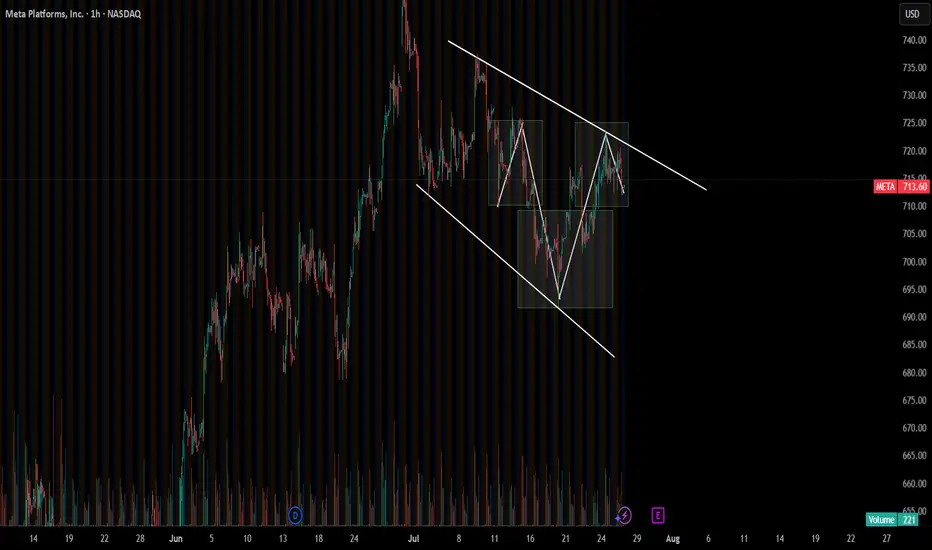
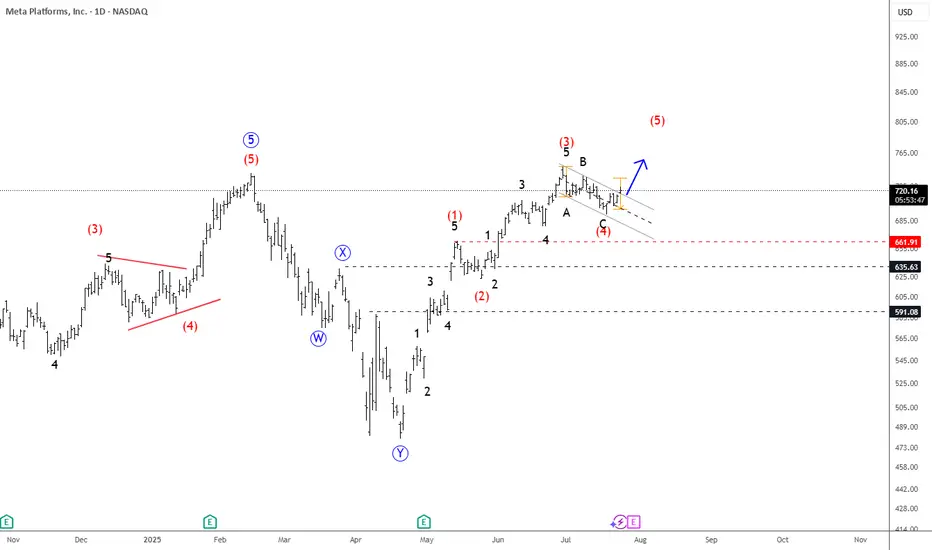
META Slows Down For A Correction Within UptrendMeta has seen a strong recovery recently, but barely retested February highs around 740, from where we can see some nice pullback, but it appears corrective, since it’s unfolding in three waves, and forming a potential bull flag — likely wave 4. A breakout above the downward channel on a daily close could signal the start of wave 5 and a push to new highs.
However, keep a close eye on the 666.1; a break below this level would invalidate the bullish view and suggest a deeper consolidation phase may follow.
Highlights:
Direction: Up (pending breakout)
Structure: Wave 4 bull flag; wave 5 possible soon
Support: 680 / 690
Mean Reversion Trade: META1. RSI in oversold region
2. Price likely to rebound back the the mean
Trade Rules:
Entry Trigger - RSI has cross below oversold region, enter limit buy at close price
Exit Trigger - Close at market when close price cross above exit trigger (Red step line)

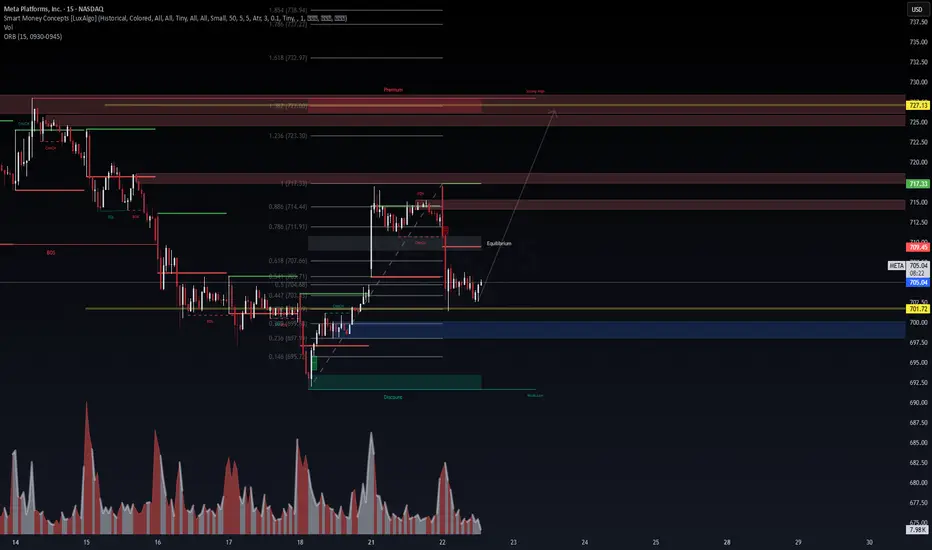
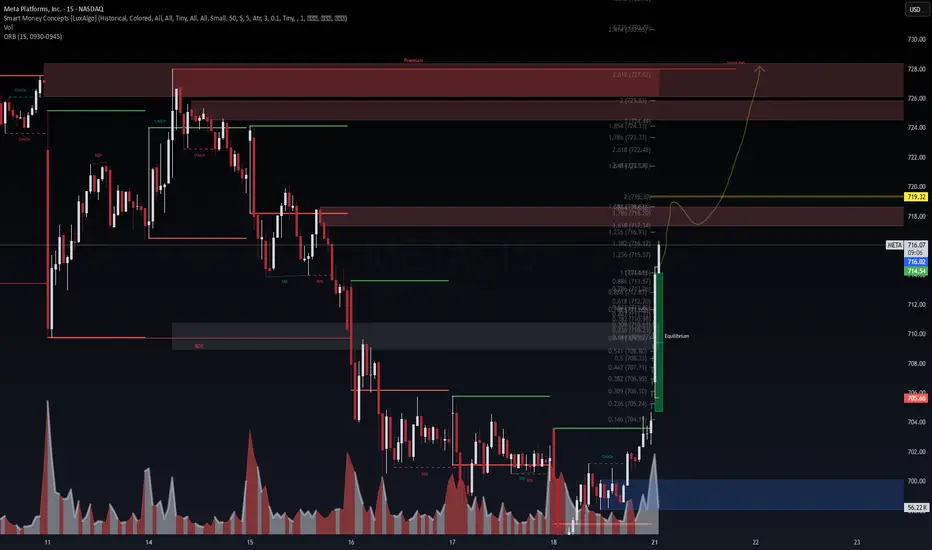
META: That weird drop looks like it was planned :P📊 META (15M) | Smart Money Concepts Setup
🔍 Powered by VolanX Protocol | WaverVanir International LLC
META is showing signs of reclaiming equilibrium after a clear CHoCH -> BOS -> EQH sweep. Price tapped into a premium inefficiency zone and is now consolidating at the equilibrium of the latest impulse leg, suggesting a potential long opportunity.
🧠 Thesis:
Order Block + EQH rejection aligns with a key Fibonacci confluence zone.
Strong demand sits near the 701.72–700.00 area.
Bullish continuation setup toward:
TP1: 717.33 (ORB + EQH target)
TP2: 727.13 (1.382 Fib extension + liquidity sweep zone)
⚠️ Risk Management:
Invalid if price closes below 697.00 (Discount OB)
Ideal entry near 703–705 with confirmation (candle body close over 707.66 Fib)
🛡 VolanX Score: High Confluence | SMC + Fib + Volume Spike
📈 Watching for a bullish engulfing or clean mitigation inside the OB for confirmation.
📎 For educational purposes only – not financial advice.
#VolanX #WaverVanir #META #OptionsFlow #SMC #Fibonacci #SmartMoney #TechStocks #TradingView
New Setup: METAMeta is now setting up for a potential bounce now. If the Markets can be positive tomorrow, we should see Meta also participate.

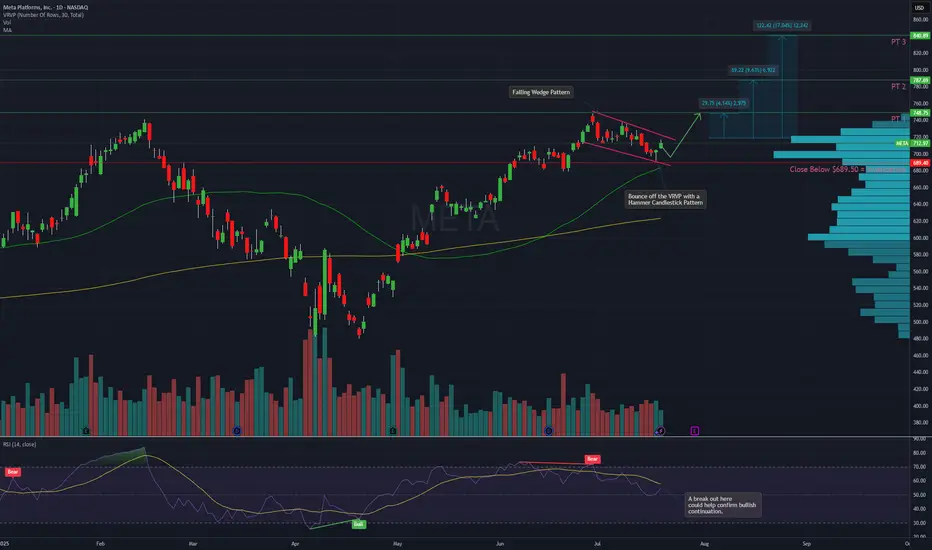
META – Falling Wedge Breakout Setup with Strong Risk/RewardDescription:
Meta (META) has been consolidating within a textbook falling wedge pattern, now showing signs of a potential breakout and bullish continuation.
Price Action Highlights:
Multiple rejections near 748 resistance
Recent bounce off the high-volume node on the VRVP with a hammer candlestick pattern
Holding above the 50-day moving average
RSI showing signs of reversal, approaching a key trendline breakout
Bullish Signal Criteria:
A breakout above the 720–725 range confirms wedge breakout
Watch for volume expansion to validate the move
Targets:
PT1: 748
PT2: 787
PT3: 840
Invalidation Level:
Close below 689.50 invalidates the setup
This setup offers a clear structure for continuation with well-defined risk levels and upside potential. Monitoring volume and RSI confirmation will be critical in the coming sessions.
Meta Stock Risks Breakdown Amid Slowing Growth and Rising CostsMeta (NASDAQ: META), the parent company of Facebook, will report second-quarter 2025 results on Wednesday, 30 July, after the close of trading in New York. The social media giant is expected to report that earnings growth slowed to 14.2% to $5.89 per share, as revenue growth decelerated to 14.4%, reaching $44.7 billion. CAPEX is expected to more than double from a year ago, increasing to $17.5 billion from $8.1 billion.
For the third quarter, analysts expect the company to guide revenue to $46.0 billion. CAPEX for full year 2025 is forecast at $64.7 billion. The options market is pricing in a post-earnings move of about 6.5%.
The stock has formed a potential 2B top reversal pattern when it briefly rose on 30 June, closed above the high seen on 14 February, but was unable to maintain it. Now, the stock has fallen below an uptrend that began on 1 May, as well as below technical support at around $705. Meanwhile, the Relative Strength Index has rolled over, suggesting momentum has shifted from bullish to bearish. There is considerable technical support for Meta between $680 and $700 per share, and a move below that support region could lead to the shares falling below $600 over time.
From an option gamma perspective, $700 appears to be the put wall, which also suggests there is solid support around this level. However, the overall call delta values are high, indicating that the options market is very bullish. Therefore, after the company reports, it is possible there could be significant call value decay, leading to the unwinding of hedges and potentially pushing shares below the $700 support region. However, if the stock can hold support at $700, it stands a chance to move higher towards the call wall at $750 and potentially as high as $800.
Written by Michael J. Kramer, founder of Mott Capital Management.
Disclaimer: CMC Markets is an execution-only service provider. The material (whether or not it states any opinions) is for general information purposes only and does not take into account your personal circumstances or objectives. Nothing in this material is (or should be considered to be) financial, investment or other advice on which reliance should be placed.
No opinion given in the material constitutes a recommendation by CMC Markets or the author that any particular investment, security, transaction, or investment strategy is suitable for any specific person. The material has not been prepared in accordance with legal requirements designed to promote the independence of investment research. Although we are not specifically prevented from dealing before providing this material, we do not seek to take advantage of the material prior to its dissemination.
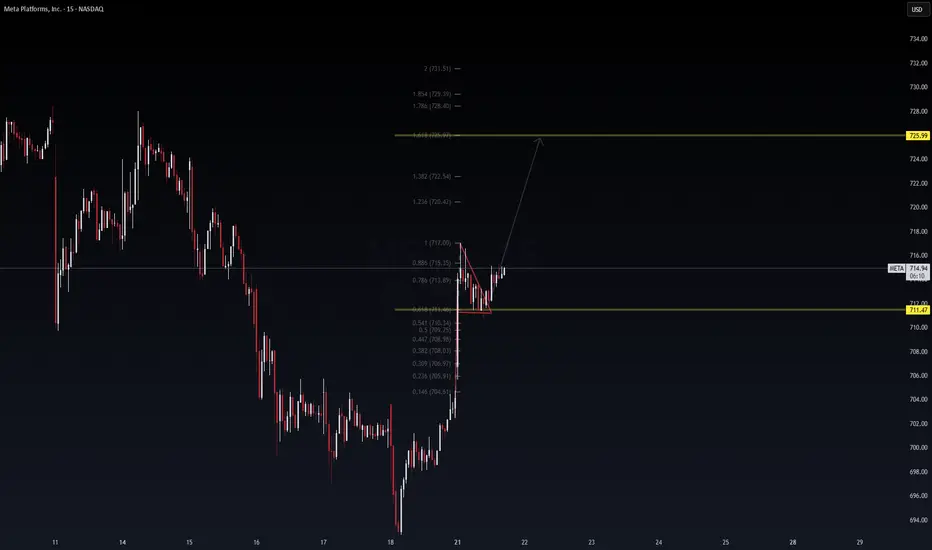
$META Day Trade Update | 15m TF📈 NASDAQ:META Day Trade Update | 15m TF
VolanX DSS framework still intact. Price broke out cleanly from a descending triangle, retested the breakout zone near 713.8, and is now stabilizing above 714.6. We’re printing a bullish structure with momentum building toward:
🎯 Primary Target: 725.99
🧠 Fib Levels in Play:
0.618 = 711.47 (support held)
0.786 = 713.89 (pivot zone)
1.618 = 725.99 (target in sight)
📌 Key Observations:
Retest successful, no wick violation below triangle
Volume holding steady post-breakout
RSI/MACD divergence resolved on lower TFs
If momentum sustains, META may front-run 725 with a sweep into 728–731.5 extension. We’ll adapt based on order flow and price action near 722.5 resistance.
📡 Protocol: VolanX DSS | SMC + Fib + Triangular Structure
🔁 Still stalking. Exit at 725 or scale-out from 722 based on intraday momentum.
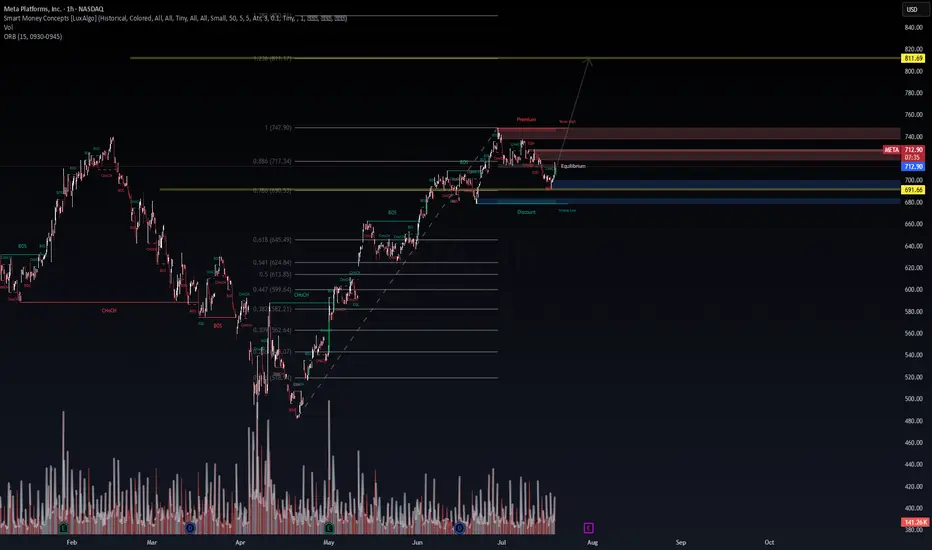
META – Institutional Buy Setup Active | VolanX Protocol Update📡 META – Institutional Buy Setup Active | VolanX Protocol Update
🧠 Price Intelligence Framework: WaverVanir DSS
The institutional model forecasts META to reach $760.64 in the next 15 trading days with a 95% confidence interval between $748.81 – $762.83. Signal is confirmed by 9/9 bullish model consensus.
🔍 Smart Money Concepts (SMC)
Price is rebounding from Equilibrium Zone (~$712.98) after discount mitigation. Liquidity structure favors bullish continuation toward:
🎯 Target 1: $727.63
🎯 Target 2: $760.64
🏁 Extended Target: $811.69 (1.272 extension)
📉 Risk Parameters (From DSS):
Entry: $713.36
Stop: $684.68 (4.0% risk)
Risk/Reward: 1.65:1
Volatility: 1.54% (low)
Capital Allocation: 25% of strategy layer
📈 Options Flow Validation:
Unusual activity observed across $720–$750 calls (Jul 25–Aug 22). Institutions are loading positions aggressively with >$2M notional in call sweeps.
Thesis: META is in an SMC bullish structure with alignment from AI forecasting, liquidity mapping, and options flow. VolanX Protocol confirms directional probability with low variance risk.
📌 Watch zone: $760 → $811
📌 Increased momentum if $717.34 (0.886 Fib) breaks cleanly
📌 Invalidation on close below $684
#META #VolanX #WaverVanir #SmartMoneyConcepts #OptionsFlow #TradingView #AITrading #InstitutionalSignals #Fibonacci #BreakoutSetup #LSTMForecast #TechnicalAnalysis
$META Cup & Handle? Wish I would have posted this pre market but I still like it for this week. Tapped the bottom band and it's bouncing and getting really tight now. Looks like a cup and handle near the all time high.
META 15M | Daytrade Setup – VolanX Protocol📈 META 15M | Daytrade Setup – VolanX Protocol
NASDAQ:META just delivered a high-confidence Break of Structure (BOS) + Change of Character (CHOCH) confluence off a low-volume sweep near the Equilibrium Zone (~$704).
Key Signals (VolanX Protocol):
✅ Smart Money Accumulation confirmed at blue demand zone
✅ Strong impulsive candle post-CHOCH (Volume Spike + Displacement)
✅ Fibonacci extensions line up with institutional targets:
📍 1.618 → $718.28 (First liquidity grab zone)
📍 2.0 → $719.30 (Equilibrium breakout target)
📍 3.618 → $727.62 (Full range sweep + premium zone)
🎯 Trade Thesis:
Targeting $719–$727 based on liquidity engineering and algo sweep probabilities.
🧠 VolanX Probability Curve:
📊 Move to $719.3 = 78% (aligned with 2.0 fib and historical rejection level)
📊 Move to $727.6 = 62% (final premium zone; sweep of June supply + “Strong High”)
⚠️ Retrace to $710.8 = 40% (retest demand or shakeout)
⏱️ Valid only for 07/21 NY session unless full structure invalidated.
💡 This setup reflects institutional liquidity dynamics governed by VolanX Smart Flow model. All insights are educational and part of the DSS framework.
🔁 Stay adaptive. Monitor BOS/CHOCH sequences. VolanX protects capital through real-time recalibration.
#WaverVanir #VolanX #META #DayTrade #SMC #DSS #AITrading #LiquidityHunt #VolumeProfile #TechStocks #TradingView
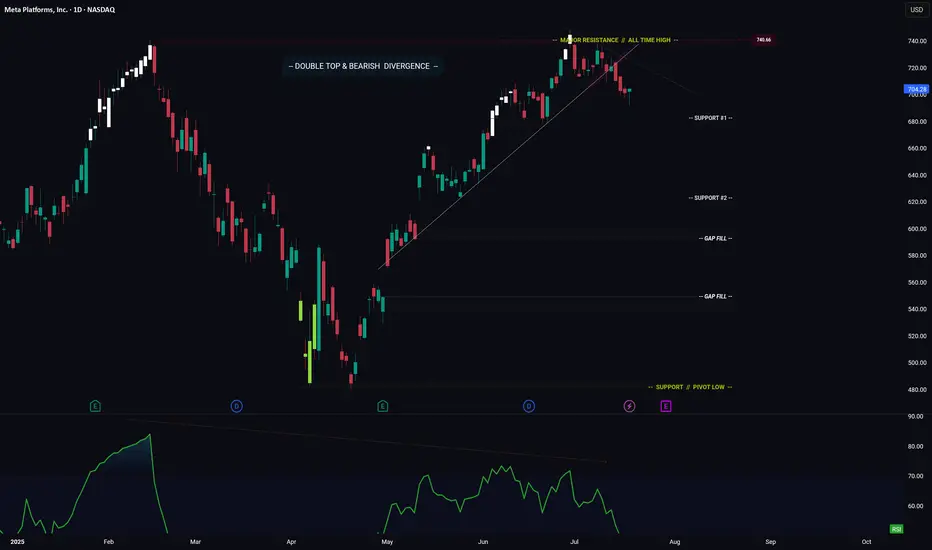
META -- Breakdown? Or Move Higher? Levels To Watch ForHello Traders!
Meta has broken down from its ascending trendline. This is bearish.
In addition price has formed a major Double Top pattern with Bearish Divergence.
Bearish Factors
1) Breakdown of ascending trendline
2) Double top
3) Bearish divergence
Two things need to happen if META is going to make a move higher...
1) Price needs to stay above "Support #1"
2) Price needs to break above the descending trendline (connecting the range highs)
IF price does breaks lower... where do we start looking for long positions?
- Support #2 is a great starting point, however if price makes it to support #2, then I could also see price trading down to fill the gap just below.
- This is where you could enter again to average down your position.
Thanks everyone and best of luck on your trading journey!
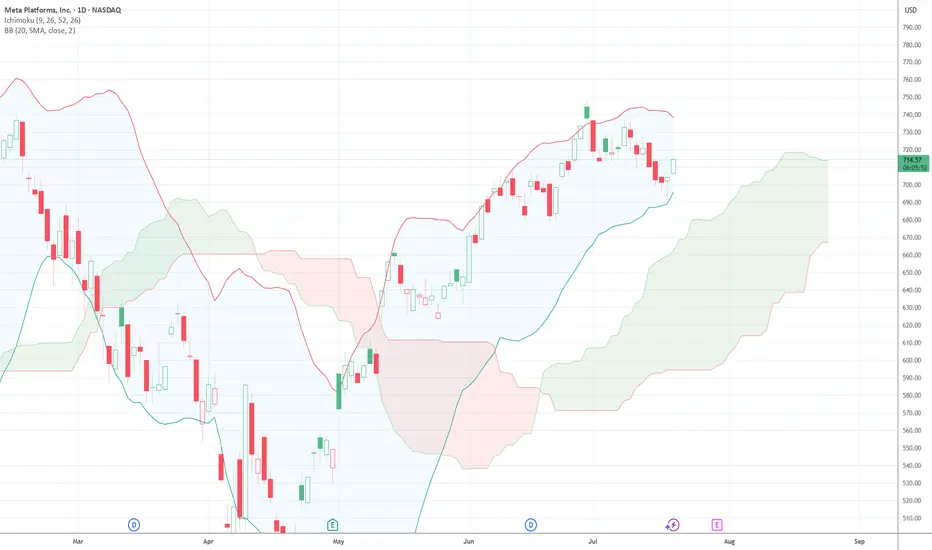
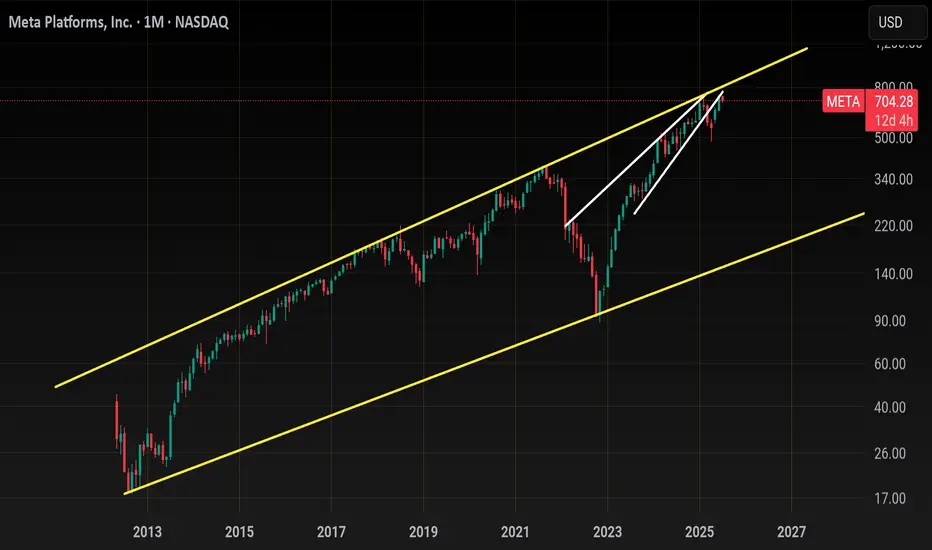
Meta .. (Where we stand)Long term, I think this stock is headed back to 300-400...
Short term I think it's a high chance we see 740-800...
Let me explain
Back in Feb we tagged our long term resistance, corrected and then we retested it with a lower high on the RSI (Bearish divergence) that you can see on the monthly and weekly time frame
Last few weeks Meta has pulled back while chips have pumped with good tariff news. I think Meta could be ready for another bounce here
My reasons
1. On the lower edge of daily Bollingerband
2. The 3-4 hour money flow is too oversold here. Last 4 times this happened, Meta mover 5-7%
3. Daily hammer candle with volume
Near the 50ema
4.
Meta closed below is 20ma at 715 also has stiff price action also at
So the best entry would be either to wait for a break over 720.00 then long it to 740-750..
Or 698-700
Meta would only be bearish immediately with a close below 680 price action and 50sma
Keep on mind googl has earnings this week and Meta will trade in sympathy on any advertising news
The best short setup long term is to wait for a test of 780-800 on the monthly trend .
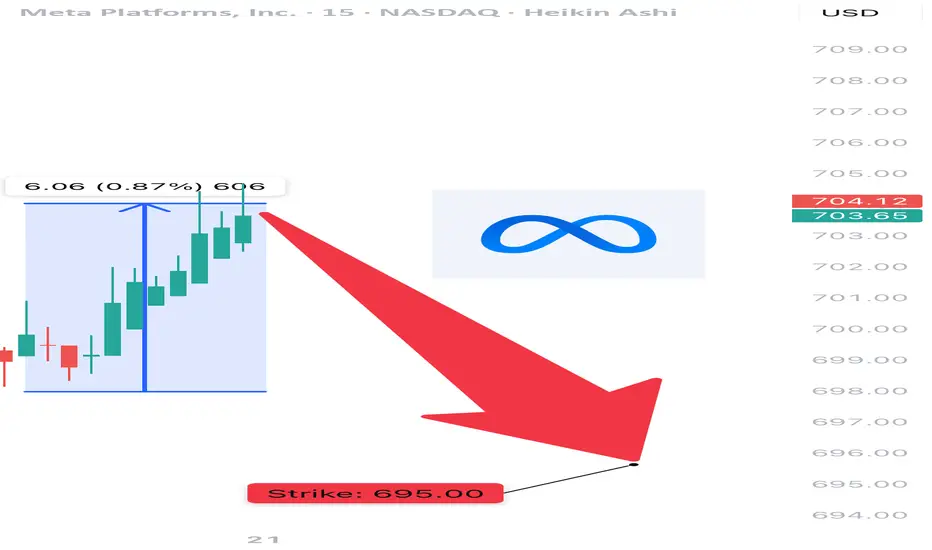
META Bearish Swing Alert – Bear in Hiding? Watch for Breakdown B
🔻 NASDAQ:META Bearish Swing Alert – Bear in Hiding? Watch for Breakdown Below $690 🐻
📅 Posted: July 18, 2025
💡 All models say “bearish,” but volume is the wildcard. Tight play, big potential.
⸻
🧠 AI Consensus Summary: Bearish But Not Triggered
Model Bias Key Notes
Grok 🐻 Bearish RSI 40.5, weak volume, neutral options flow. No clear flow bias.
Claude 🐻 Bearish Same indicators. Recommends conditional entry.
Gemini ⚠️ Bearish Wait Bearish bias but no trigger yet due to low volume.
Llama 🐻 Cautious Bear Trade only if breakdown below $678 with volume.
DeepSeek 🐻 Bearish No bull signals. Neutral options flow confirms low conviction.
⸻
⚙️ Setup Details – META Naked Put
🎯 Strike: $695.00
📅 Expiry: August 1, 2025
💰 Entry Price (Premium): $22.70
💵 Profit Target: $30.00
🛑 Stop Loss: $14.00 (~40% of premium)
📏 Contract Size: 1
📈 Confidence Level: 70%
⏰ Entry Timing: Market open — only if price breaks below $690 with volume confirmation
🕒 Signal Timestamp: 2025-07-18 @ 10:54 AM EDT
⸻
🔍 Why This Works
• ✅ Technical Trend: RSI < 45, negative 5-day/10-day momentum
• 🧊 Options Flow: Flat — no bullish bias = clean downside setup
• 🧨 Trigger Level: Breakdown below $690 = institutional exit confirmed
• ⚠️ Key Caveat: Weak volume = don’t front-run the breakdown
⸻
📌 Levels to Watch
• ⚠️ Breakdown Confirm: Below $690 with volume > 1.25x
• 🧱 Target Zone: $678 support
• ❌ Invalid If: Bounces back over $705 on volume
⸻
🚨 Risk Warning
This isn’t the “all-in” moment — it’s a sniper trade.
No volume = no entry. Tight stop. Fast hands. Smart size.
⸻
📊 TRADE SNAPSHOT
{
"instrument": "META",
"direction": "put",
"strike": 695.0,
"expiry": "2025-08-01",
"confidence": 0.70,
"profit_target": 30.00,
"stop_loss": 14.00,
"size": 1,
"entry_price": 22.70,
"entry_timing": "open",
"signal_publish_time": "2025-07-18 10:53:53 UTC-04:00"
}
⸻
🔁 Follow for more AI-backed trades
💬 Is META breaking down — or faking out?
👀 Drop your entry thoughts in the comments.
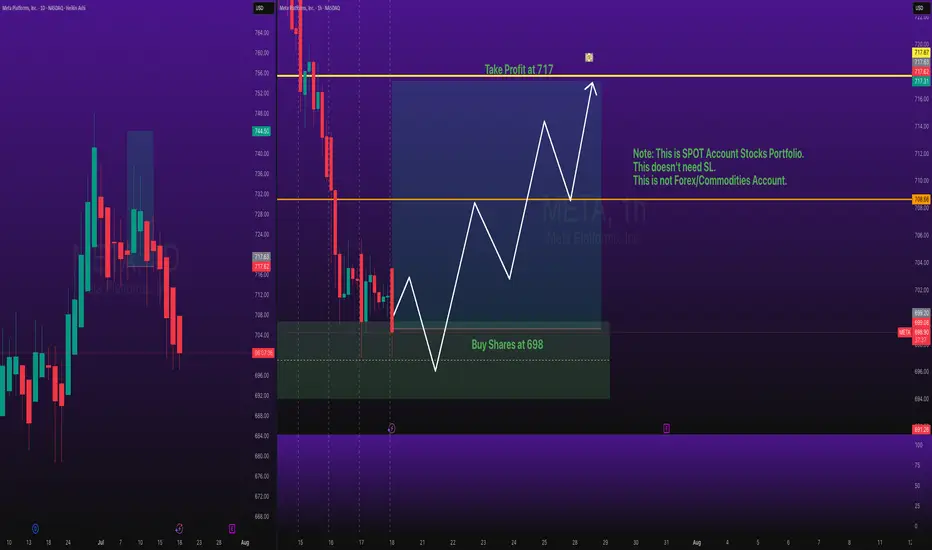
Stocks SPOT ACCOUNT: META Shares Buy Trade with Take ProfitStocks SPOT ACCOUNT:
NASDAQ:META shares: my buy trade with take profit.
This is my SPOT Accounts for Stocks Portfolio.
Trade shows my Buying and Take Profit Level.
Spot account doesn't need SL because its stocks buying account.
Looks good Trade.
Disclaimer: only idea, not advice
META Short📈 Scenario Outlook:
Bias: Bearish
Primary Expectation: Price is currently in a corrective decline and is expected to continue toward the 676.67 CHoCH level.
Bearish confirmation was seen upon rejection from the 713.20 mid-level, with price now printing lower highs and lower lows on the 4H chart.
This move may ultimately form a larger distribution pattern on the daily timeframe.
📌 Key Zones ("Your Borders"):
🔴 Mid-Supply Rejection Zone (Resistance)
Level: ~713.20 (50% equilibrium of last bearish swing)
This level acted as the midpoint during the retracement following the initial selloff from the top.
The market respected this region as a mid-range rejection, further reinforcing bearish momentum.
Failure to reclaim this level confirms bearish dominance in the short-to-medium term.
⚪ Target Zone / CHoCH Demand Test
Zone: 676.67 (CHoCH)
This is your projected draw on liquidity and primary downside target. It marks a structurally significant low where prior bullish order flow initiated.
If this level fails to hold, META may shift into a broader corrective phase, potentially unwinding a large portion of the prior rally.