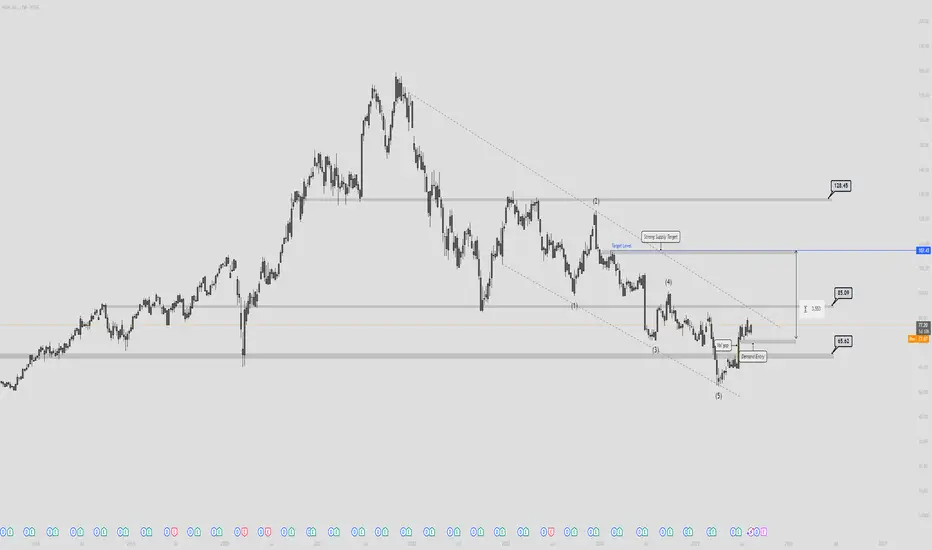
Nike - Time to breakout?!Nike (NKE) – Just Do It… Bullish Edition 🏆
After running a marathon straight downhill, Nike finally tied its laces at $65.62 and said, “Enough!” That demand zone was like a comfy Air Max cushion — price bounced right off it.
We’ve got a completed 5-wave drop ✅, a nice reaction out of the vol gap ✅
Key facts today
Next report date
—
Report period
—
EPS estimate
—
Revenue estimate
—
1.91 EUR
2.84 B EUR
40.90 B EUR
1.17 B
About Nike
Sector
Industry
CEO
Elliott J. Hill
Website
Headquarters
Beaverton
Founded
1964
FIGI
BBG00GQ6S7P9
NIKE, Inc engages in the design, development, marketing, and sale of athletic footwear, apparel, accessories, equipment, and services. It operates through the following segments: North America; Europe, Middle East & Africa; Greater China; Asia Pacific & Latin America; Global Brand Divisions; Converse; and Corporate. The North America; Europe, Middle East & Africa; Greater China; and Asia Pacific & Latin America segments refers to the design, development, marketing, and selling of athletic footwear, apparel, and equipment. The Global Brand Divisions represents NIKE Brand licensing businesses. The Converse segment designs, markets, licenses, and sells casual sneakers, apparel, and accessories. The Corporate segment consists of unallocated general and administrative expenses. The company was founded by William Jay Bowerman and Philip H. Knight on January 25, 1964 and is headquartered in Beaverton, OR.
Related stocks
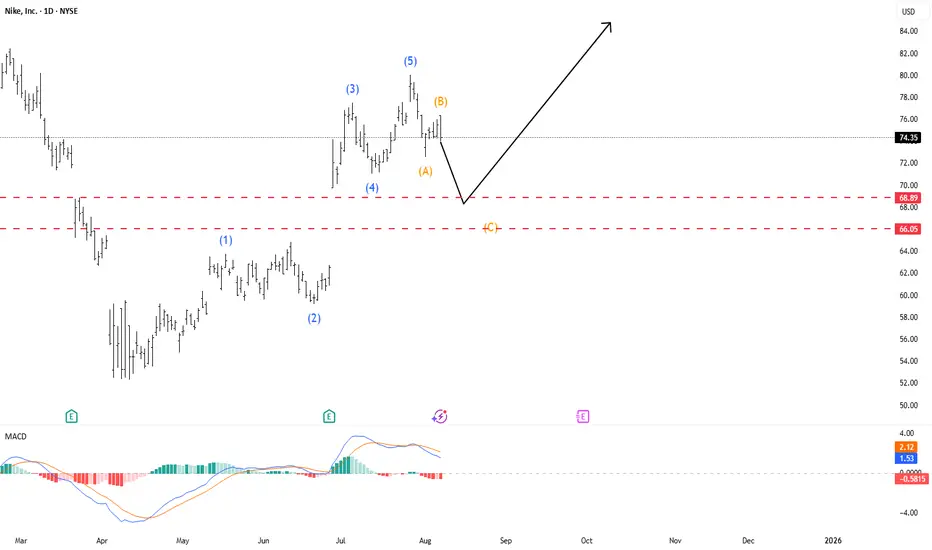
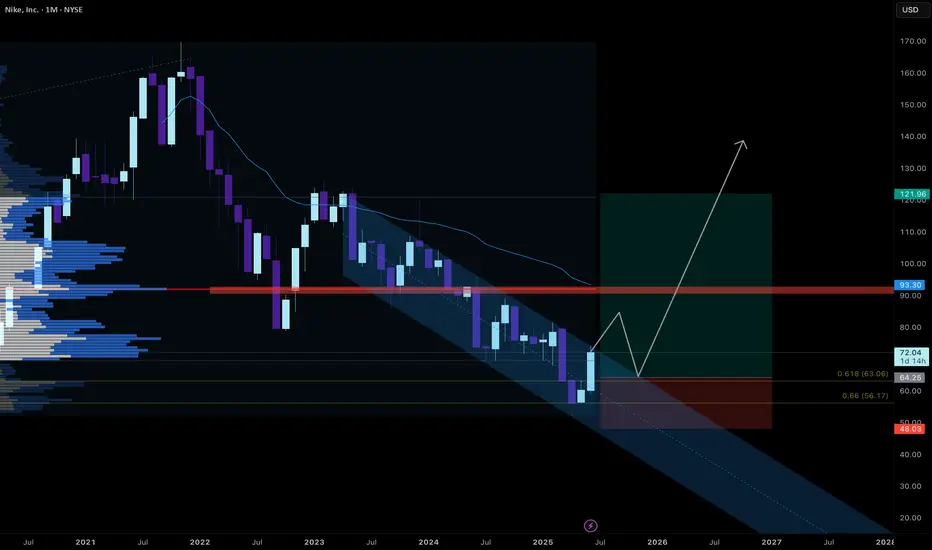
Nike - A buy after pullbackNike's daily chart shows a competed five-wave advance off the lows from 52.28, with a subsequent correction underway. We believe that we are in wave C of this correction which could take prices back to 68-66 levels before another move higher unfolds towards 100.00
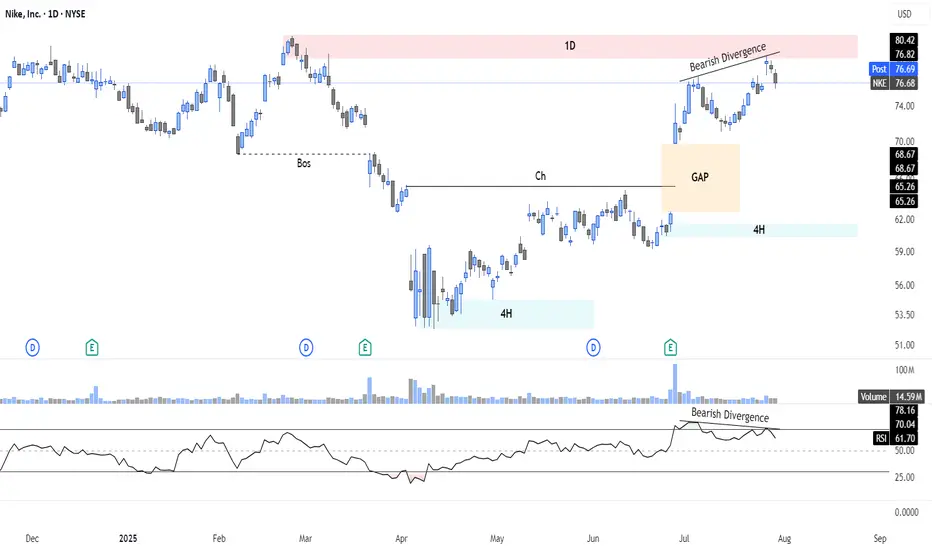
Bearish Setup on Nike ($NKE): Divergence + Supply Rejection📉 I'm watching a high-probability bearish setup on NYSE:NKE , with price rejecting a key 1D supply zone ($77–80) on bearish RSI divergence and fading momentum. A downside gap below adds further confluence.
📊 Technical Context:
Clear 1D supply rejection with divergence
Lower RSI highs vs higher pri
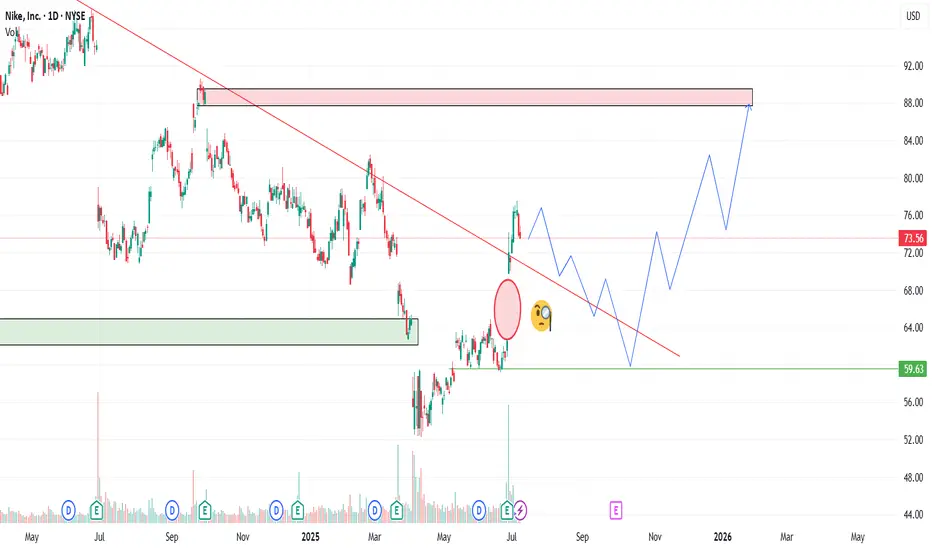
NIKE Confirms A Bullish Reversal With An Impulsive RecoveryWe talked about Nike on July 10 with our members, where we mentioned and highlighted a completed higher degree ABC correction in wave IV on the monthly and weekly charts.
Today we want to represent a closer view, as we see a five-wave impulsive recovery away from the lows on a daily chart. It actua

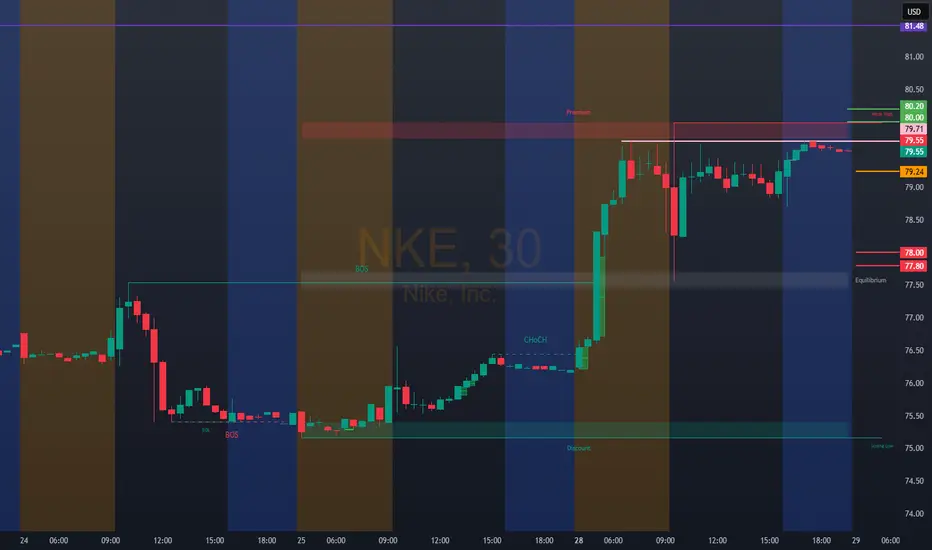
NKE: 79.24BULLISH ENTRIES 80.00/80.20 Target 81.00 Stop 79.00 BEARISH ENTRIES 78.00/77.80 Target 77.00 Stop 79.10
Nike - This is the bottom!💉Nike ( NYSE:NKE ) creates the bottom now:
🔎Analysis summary:
More than four years ago, Nike created its previous all time high. We have been witnessing a downtrend ever since and a correction of about -70%. But with the recent retest of an important horizontal structure and bullish confirmat

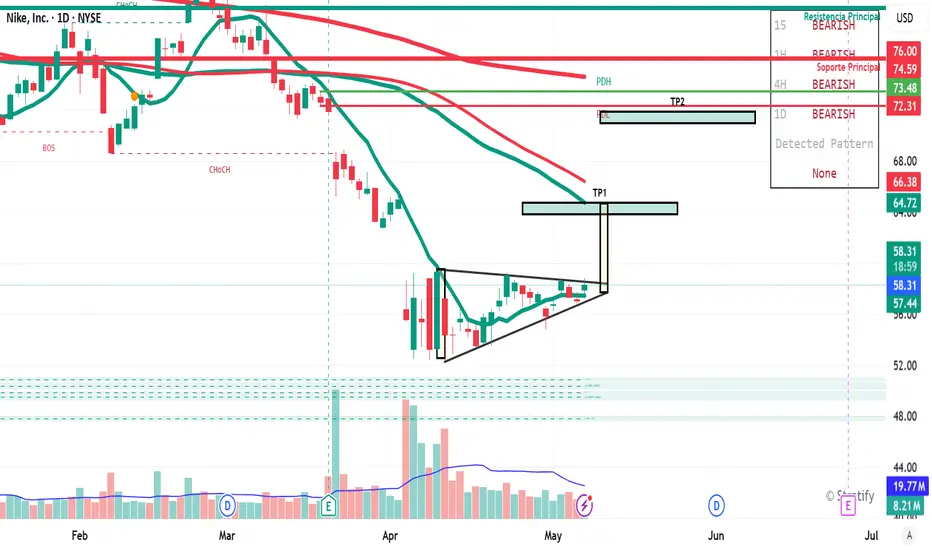
Possible Scenarios for Nike🔺 Pattern:
An ascending triangle is forming, which is a bullish technical pattern if it breaks out with volume above the resistance level.
The TP1 (Take Profit 1) marked in the $64.72–$66.38 USD zone is logical and aligns with previous resistance levels.
🟢 Bullish Signals:
Imminent triangle break
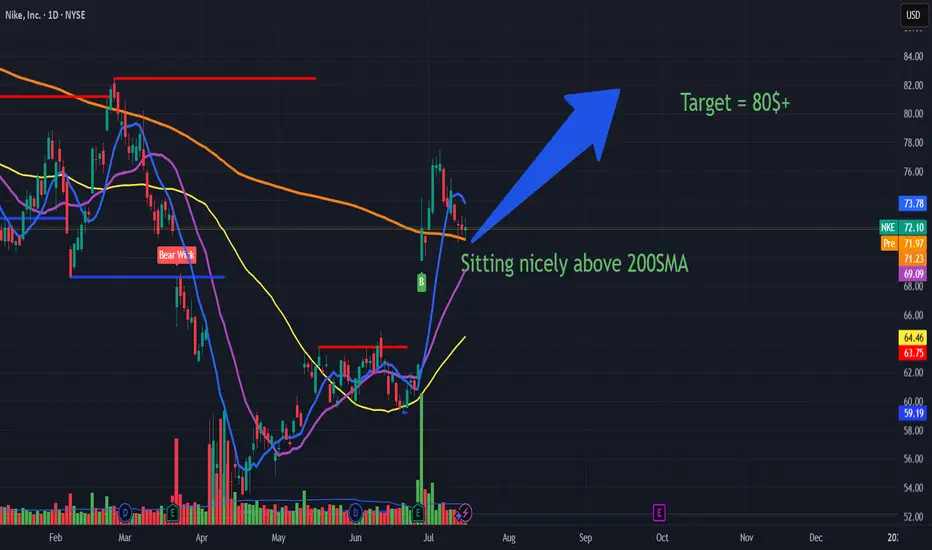
Nike is a screaming BUY with target above 80$ in the short termSummary: In short NKE is on reversal mode to the upside and 80$ is on the horizon and 100$+ by next quarter Earnings call which is an upside over 40% NYSE:NKE
Nike (NKE): Technical Strength Above the 200 SMA 🟢
Nike (NKE): Recent Earnings Overview 🏅
Above the 200-Day Simple Moving Average (S
Break of downward sloping channel LongNike has swept liquidity and is now showing a strong bounce to the upside.
Although I didn’t manage to enter the initial long, I am monitoring for a break above the current downward-sloping channel. A clean breakout followed by a retest would provide a more reliable entry point. I’m not aiming to c
NKE Pullback-I'm Buying the DipNike (NKE) is under pressure — post-earnings volatility, macro noise, and sentiment all weighing in. But for swing traders, this looks like a textbook accumulation setup.
📌 Entry Zones I’m Targeting:
🔹 $70.00
🔹 $65.00
🔹 $60.00
Profit Targets (Taking wins before 88):
✅ $78.80
✅ $82.50
Let the m
See all ideas
Summarizing what the indicators are suggesting.
Neutral
SellBuy
Strong sellStrong buy
Strong sellSellNeutralBuyStrong buy
Neutral
SellBuy
Strong sellStrong buy
Strong sellSellNeutralBuyStrong buy
Neutral
SellBuy
Strong sellStrong buy
Strong sellSellNeutralBuyStrong buy
An aggregate view of professional's ratings.
Neutral
SellBuy
Strong sellStrong buy
Strong sellSellNeutralBuyStrong buy
Neutral
SellBuy
Strong sellStrong buy
Strong sellSellNeutralBuyStrong buy
Neutral
SellBuy
Strong sellStrong buy
Strong sellSellNeutralBuyStrong buy
Displays a symbol's price movements over previous years to identify recurring trends.
US654106AG8
NIKE 16/46Yield to maturity
6.43%
Maturity date
Nov 1, 2046
NKE4971170
NIKE, Inc. 3.375% 27-MAR-2050Yield to maturity
6.35%
Maturity date
Mar 27, 2050
NKEB
NIKE 15/45Yield to maturity
6.15%
Maturity date
Nov 1, 2045
NKEA
NIKE 13/43Yield to maturity
6.10%
Maturity date
May 1, 2043
NKE4971169
NIKE, Inc. 3.25% 27-MAR-2040Yield to maturity
5.82%
Maturity date
Mar 27, 2040
NKE4971168
NIKE, Inc. 2.85% 27-MAR-2030Yield to maturity
4.28%
Maturity date
Mar 27, 2030
US654106AF0
NIKE 16/26Yield to maturity
4.18%
Maturity date
Nov 1, 2026
NKE4971167
NIKE, Inc. 2.75% 27-MAR-2027Yield to maturity
4.03%
Maturity date
Mar 27, 2027
See all NKE bonds
Curated watchlists where NKE is featured.


Frequently Asked Questions
The current price of NKE is 65.56 EUR — it has decreased by −1.15% in the past 24 hours. Watch NIKE INC -CL B stock price performance more closely on the chart.
Depending on the exchange, the stock ticker may vary. For instance, on VIE exchange NIKE INC -CL B stocks are traded under the ticker NKE.
NKE stock has risen by 0.85% compared to the previous week, the month change is a 5.41% rise, over the last year NIKE INC -CL B has showed a −10.79% decrease.
We've gathered analysts' opinions on NIKE INC -CL B future price: according to them, NKE price has a max estimate of 99.00 EUR and a min estimate of 32.71 EUR. Watch NKE chart and read a more detailed NIKE INC -CL B stock forecast: see what analysts think of NIKE INC -CL B and suggest that you do with its stocks.
NKE stock is 0.69% volatile and has beta coefficient of 0.97. Track NIKE INC -CL B stock price on the chart and check out the list of the most volatile stocks — is NIKE INC -CL B there?
Today NIKE INC -CL B has the market capitalization of 96.85 B, it has decreased by −1.05% over the last week.
Yes, you can track NIKE INC -CL B financials in yearly and quarterly reports right on TradingView.
NIKE INC -CL B is going to release the next earnings report on Sep 30, 2025. Keep track of upcoming events with our Earnings Calendar.
NKE earnings for the last quarter are 0.12 EUR per share, whereas the estimation was 0.11 EUR resulting in a 7.45% surprise. The estimated earnings for the next quarter are 0.23 EUR per share. See more details about NIKE INC -CL B earnings.
NIKE INC -CL B revenue for the last quarter amounts to 9.78 B EUR, despite the estimated figure of 9.46 B EUR. In the next quarter, revenue is expected to reach 9.42 B EUR.
NKE net income for the last quarter is 185.99 M EUR, while the quarter before that showed 765.41 M EUR of net income which accounts for −75.70% change. Track more NIKE INC -CL B financial stats to get the full picture.
Yes, NKE dividends are paid quarterly. The last dividend per share was 0.35 EUR. As of today, Dividend Yield (TTM)% is 2.06%. Tracking NIKE INC -CL B dividends might help you take more informed decisions.
NIKE INC -CL B dividend yield was 2.59% in 2024, and payout ratio reached 72.55%. The year before the numbers were 1.53% and 38.91% correspondingly. See high-dividend stocks and find more opportunities for your portfolio.
As of Aug 15, 2025, the company has 77.8 K employees. See our rating of the largest employees — is NIKE INC -CL B on this list?
EBITDA measures a company's operating performance, its growth signifies an improvement in the efficiency of a company. NIKE INC -CL B EBITDA is 3.77 B EUR, and current EBITDA margin is 9.21%. See more stats in NIKE INC -CL B financial statements.
Like other stocks, NKE shares are traded on stock exchanges, e.g. Nasdaq, Nyse, Euronext, and the easiest way to buy them is through an online stock broker. To do this, you need to open an account and follow a broker's procedures, then start trading. You can trade NIKE INC -CL B stock right from TradingView charts — choose your broker and connect to your account.
Investing in stocks requires a comprehensive research: you should carefully study all the available data, e.g. company's financials, related news, and its technical analysis. So NIKE INC -CL B technincal analysis shows the buy rating today, and its 1 week rating is buy. Since market conditions are prone to changes, it's worth looking a bit further into the future — according to the 1 month rating NIKE INC -CL B stock shows the sell signal. See more of NIKE INC -CL B technicals for a more comprehensive analysis.
If you're still not sure, try looking for inspiration in our curated watchlists.
If you're still not sure, try looking for inspiration in our curated watchlists.