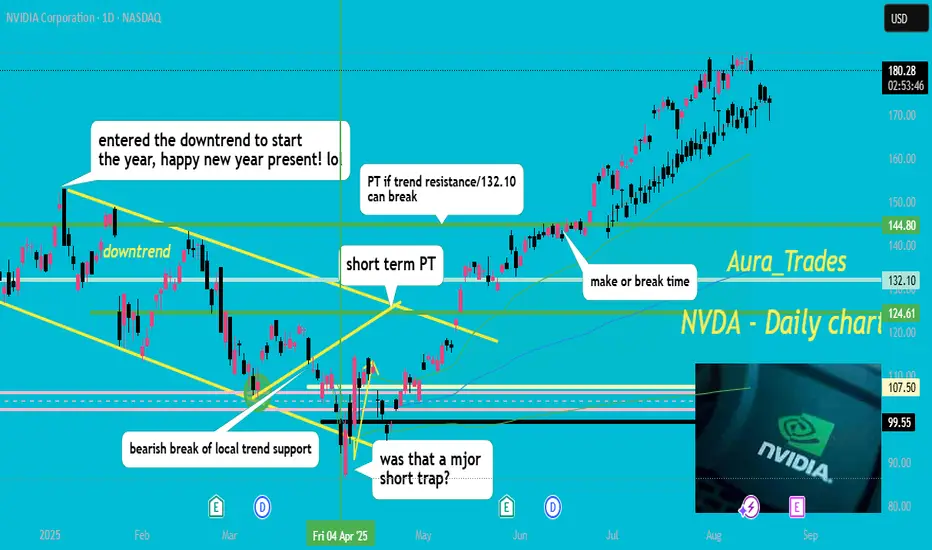
NVDA cant stop wont stop! in my last updated I said watch the 144.80 level.. if we could get a clean daily close over that then 175-200 should follow! well my 175 target is smashed, we could dip to 170 short term but I expect my 200 target to get smashed in the next month ;)
congrats to all longs, see you soon.. boost and follow for more!
NVDA trade ideas
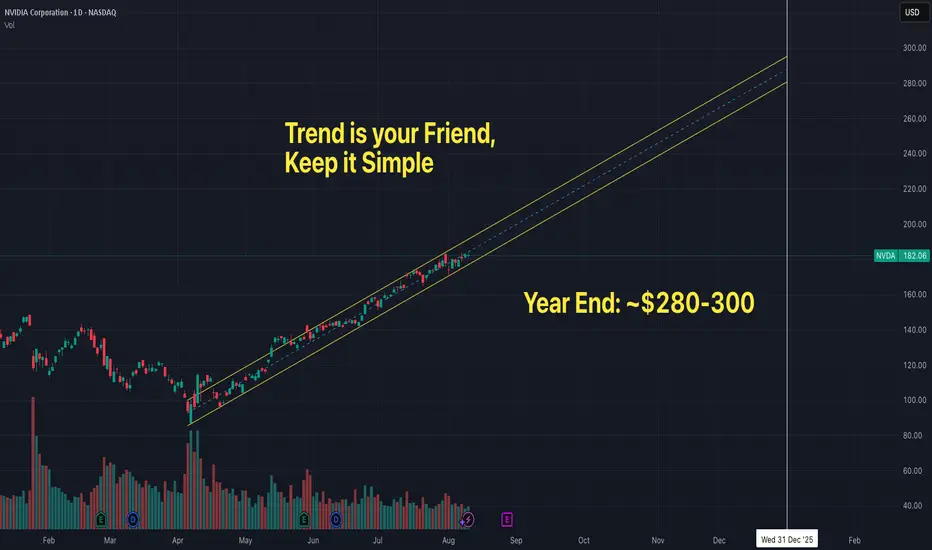
$NVDA - $280-300 YEAR END TARGET Trend is your friend, just keep it simple. Lots of runway ahead accompanied with improved gross margins of mid 70% during back half of the year on already high margins. Technical trend channel has a price objective between $280 to almost $300.
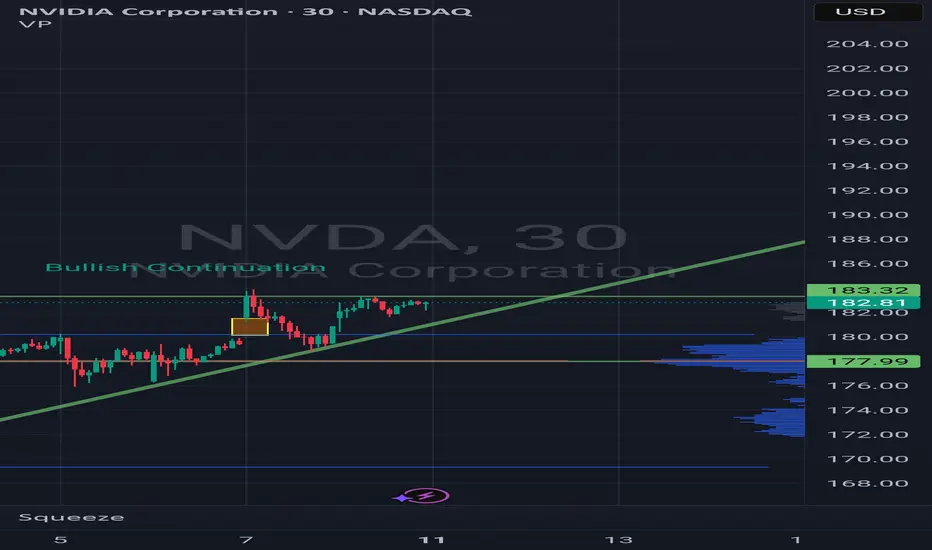
Bullish Continuation Based on this strong resistance here around 183.82, there's some strong upside if price breaks through. If it rejects there's light support around 179 and strong support around 178.
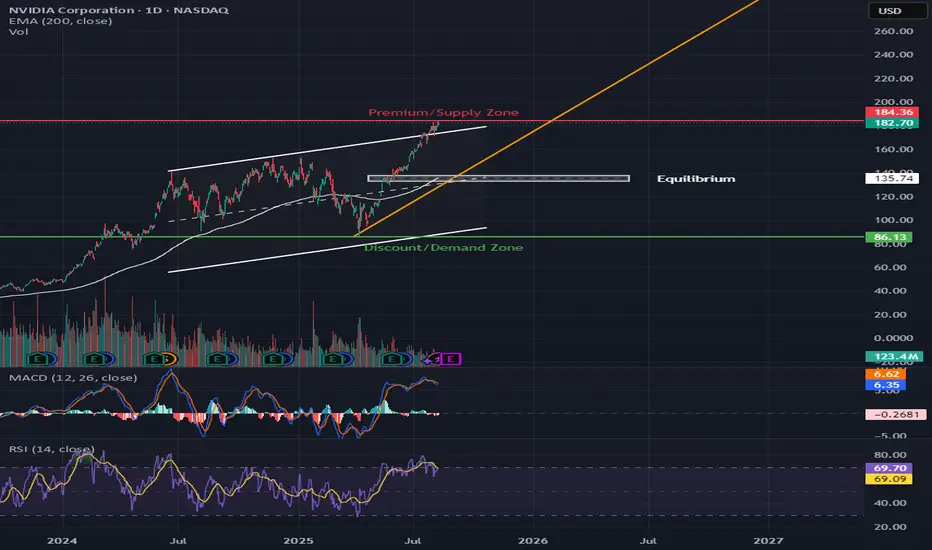
NVDA Approaching Premium Supply – Breakout or Double Top?📊 Market Breakdown
NVDA is trading at $182.70 and pressing into the Premium/Supply Zone ($184.36). The stock is riding a strong ascending wedge pattern, but with RSI at 69.70 (near overbought) and price stretched from the equilibrium, we’re at a critical decision point.
Trend: Strong uptrend from the $123–$135 base, breaking above previous highs.
Key Structure: Price launched from the equilibrium zone (~$135), skipping retests and heading straight toward supply.
Volume: Recent push has healthy volume, but we’re starting to see signs of slowing.
Indicators:
MACD: Bullish but momentum is flattening.
RSI: 69.70 – close to overbought, increasing risk of pullback.
🛒 CALLS (Bullish Scenario)
Buy Zones:
🎯 Aggressive Entry: Bounce from $175–$178 support within wedge
✅ Confirmation Entry: Break & daily close above $185 with volume
Take Profits:
1️⃣ $195 – Psychological round number
2️⃣ $210 – Wedge breakout target
3️⃣ $225 – Extension target if momentum remains strong
Stop-Loss: $172
Why This Works: Breakout above $185 clears supply and could spark a momentum run to $195+ in 2–3 weeks.
🛑 PUTS (Bearish Scenario)
Sell Zones:
🚨 Aggressive Entry: Rejection at $184–$185 supply zone
📉 Breakdown Entry: Close below $175 support
Take Profits:
1️⃣ $160 – Mid-wedge support
2️⃣ $135 – Equilibrium zone
3️⃣ $123 – Major prior demand
Stop-Loss: $188
Why This Works: Rejection at supply with overbought RSI could send NVDA back toward $160–$135 in 1–2 weeks.
🔍 Technical Highlights
Pattern: Ascending wedge nearing apex; breakout or breakdown imminent.
Supply Zone Test: $185 is a key resistance level; watch reaction closely.
Macro Watch: NVDA is highly sensitive to AI sector momentum and NASDAQ performance.
⏳ Option Expiration Strategy:
1 Week: Rejection play off $185
2–3 Weeks: Breakout targeting $195–$210
Proprietary SupportIn this slowly but continuously updating idea I will be posting an interesting way to analyze charts. It is something old but also new, like duality.
We all know that the stock market continuously grows.
But it doesn't always grow.
For markets lie between worlds.
The reasonable and the unreasonable.
The free choice and the illusion of free choice.
Let me explain...
In micro scale, we seem to believe that the markets follow the "support / resistance" rule.
An (over)simplification necessary for us to comprehend the infinities of the quantum world.
There are lots of stories told in the picture above...
- Prices are chaotic and completely incomprehensible.
- We have to smooth-out to get a clearer picture.
- Is Support / Resistance real or a result of crowd psychology?
- At what point horizontal action "ceases" to exist and "trend" takes over?
Either we call it a "power law" or a Lin-log regression, charts in macro scale seem to trend.
So prices sometimes move with one "law" (support) and sometimes with another (trend).
Do we remember / know what is the foundation of price movement?
A century ago, Wyckoff came up with his theory of accumulation and distribution.
We can safely say that his research was not a result of crowd psychology. He backtested countless price charts, in a period (1920s) when trading was purely psychological, with traders having little experience to modern ideas of "trend", "support" etc.
Just like the new modern technology design principles, ahem aapl, technological information lies inside bubbles. Transparent but distorted. Clear but fuzzy. Duality once again.
Modern trading is a self sustaining loop. The "freedom" of our actions is trapped inside a bubble. Most of us "trade" with similar strategies, and end up in the mass pool of barely-profitable-investors. Unconventional strategists like Hedge Funds must have "alien" technology to overcome such psychological traps.
Back to the main chart:
It is one attempt to bring a new dimension to chart analysis. To merge these two worlds of "support" and "trend". I cannot possibly reach the expertise of massive corporations, but I can bodge something out, and I did.
Price charts can be analyzed with unconventional / proprietary methods to conclude into the chart above. It is a little rough but bear with me. I had to perform complex calculations which I couldn't compile into a Pine Indicator. There is a reason that the top lines are not exactly straight. Their calculations depend on a blend between micro and macro movements.
A couple of interesting charts to conclude the first update of this idea:
BTC Daily
BTC Weekly
A Perfect Fractal.
I hate bubbles. Mental ones, Soapy ones, Stock ones and UI ones.
- An angry Father Grigori.

Nvidia - This is clearly not the end!📐Nvidia ( NASDAQ:NVDA ) will simply rally more:
🔎Analysis summary:
Yes, over the past couple of months, Nvidia has been rallying another +100%. But looking at the higher timeframe, this is still not the end of the unbelievable bullrun. Following the rising channel pattern, Nvidia can rally another +20% before we might see a potential retracement.
📝Levels to watch:
$250
SwingTraderPhil
SwingTrading.Simplified. | Investing.Simplified. | #LONGTERMVISION

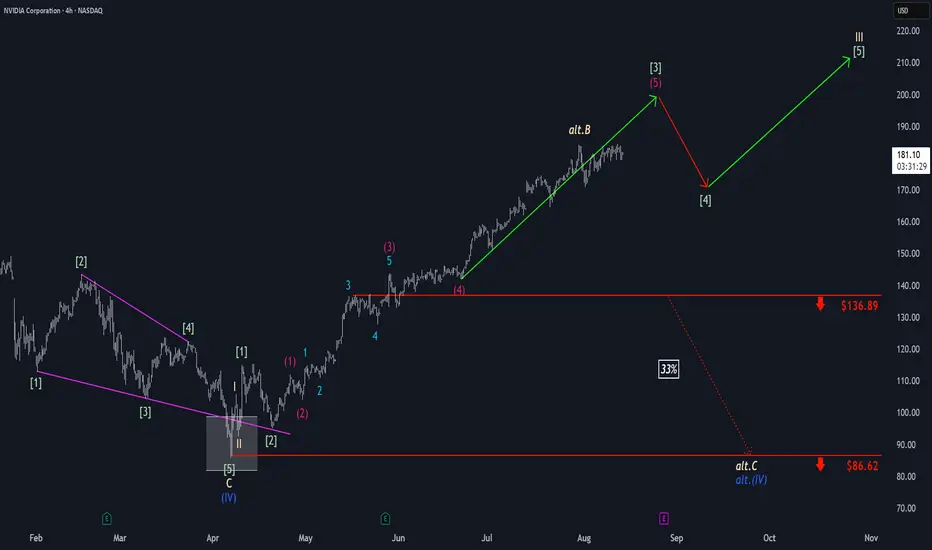
Nvidia: Extending the RallyThe bulls have maintained their momentum in Nvidia, effectively managing any interim pullbacks and allowing the stock to make further gains within the framework of green wave . We still see some additional upside potential at this stage before an interim correction of wave is likely. Well above support at $136.89, wave should then begin, pushing the stock even higher and completing the larger beige wave III. That said, we still see a 33% chance that NVDA has only recently marked the corrective top of beige wave alt.B and could soon fall below $136.89, setting a new correction low for blue wave alt.(IV) near the $86.62 level. Primarily, however, we believe wave (IV) has concluded.
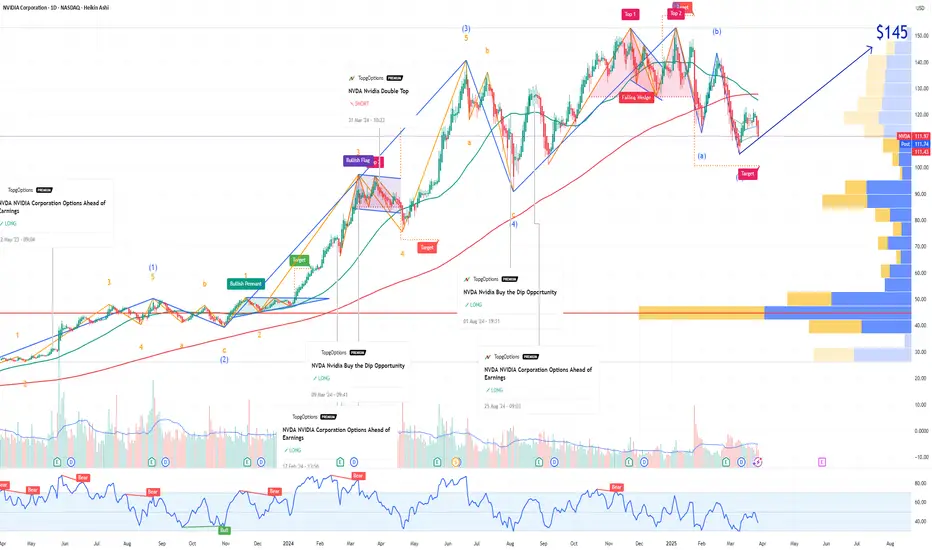
NVDA NVIDIA Price Target by Year-EndNVIDIA Corporation (NVDA) remains a dominant force in the AI and semiconductor markets, with its forward price-to-earnings (P/E) ratio currently at 19.37—a reasonable valuation considering its growth trajectory and market position.
NVIDIA’s leadership in the AI sector, particularly through its cutting-edge GPUs, has driven strong demand from data centers, cloud providers, and AI developers. The company’s recent product launches, including the Hopper and Blackwell architectures, have further solidified its competitive edge.
Despite recent market volatility, NVIDIA's consistent revenue growth and expanding profit margins support the bullish case. The current P/E of 19.37 reflects a balanced risk-reward profile, suggesting that the stock is not overvalued despite its impressive performance.
A price target of $145 by year-end reflects approximately 15% upside from current levels, driven by sustained AI demand and growing market penetration. Investors should watch for quarterly earnings reports and updates on AI chip demand, as these will likely act as key catalysts for upward momentum.
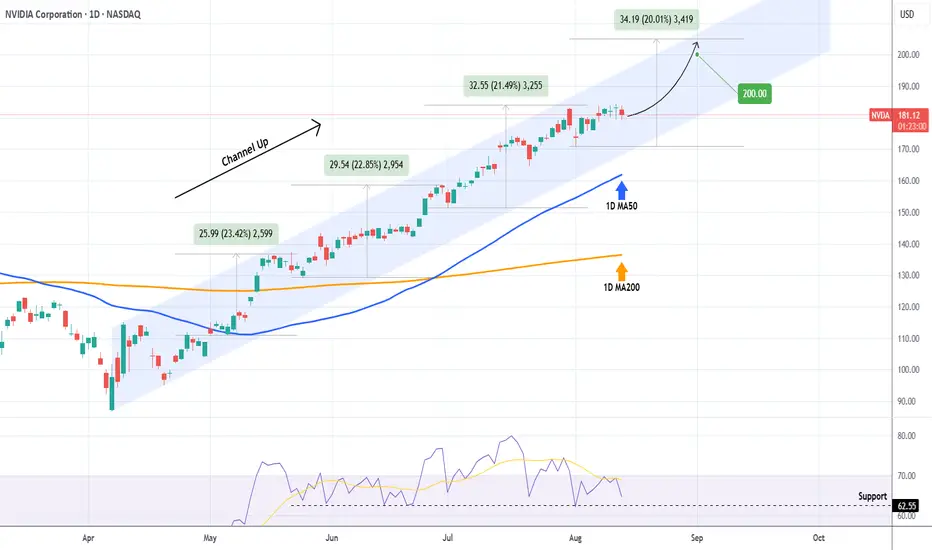
NVIDIA Is the path to $200 that easy?NVIDIA Corporation (NVDA) has been trading within a Channel Up since the April 07 market Low, being so aggressive that it has turned its 1D MA50 (blue trend-line) into Support since May 01.
The last 3 main Bullish Legs all rose by at least +20%. As long as the 1D RSI Support holds, we expect another such Leg, which would be enough for NVIDIA to reach the all important $200 psychological Target.
-------------------------------------------------------------------------------
** Please LIKE 👍, FOLLOW ✅, SHARE 🙌 and COMMENT ✍ if you enjoy this idea! Also share your ideas and charts in the comments section below! This is best way to keep it relevant, support us, keep the content here free and allow the idea to reach as many people as possible. **
-------------------------------------------------------------------------------
💸💸💸💸💸💸
👇 👇 👇 👇 👇 👇
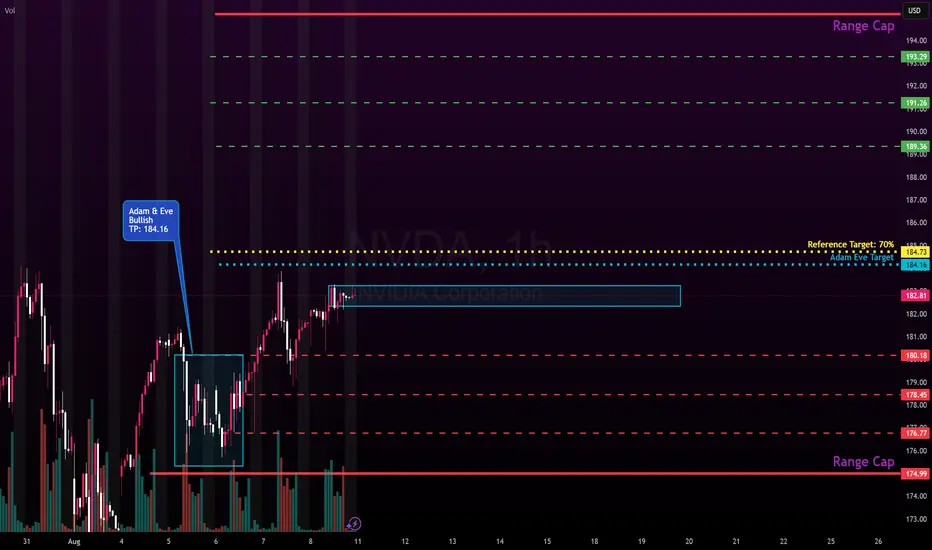
NVDA: Week of Aug 11Expectations for NVDA is.. shocker.. continuation up .
Here is the summary of what to know for next week on NVDA:
Forecasts
Weekly 30 minute: bullish, trending up after initial consolidation into beginning of week.
Weekly hourly: bullish trending up.
Daily for Monday: Rally off open but fades and consolidates for the day. Consistent between 1-minute and 5-minute forecasts.
Fibs
183 is 0% retracement, expect initial resistance here.
Chart Patterns
Bullish adam eve on the hourly formed, with TP listed in chart.
Math Projections
In addition to forecast, the following are modelled projections for next week:
Projected high: 191.65
Projected low: 179.73
Reference target (modelled target) 184 with a 70% hit rate, so watch that. Open above it, its a bearish target. Open below it, its a bullish target.
Options:
Flow alert on a really random ITM 2.0 contract of 614.7K premium with 2026-01-06 expiry.
Put/call skew PUTs 19.6% / CALLs 80.4%
Also 1.59 Mil in premiums on the 120 strike
Implied high: 191.50
Implied low: 173.89
CPI and PPI into Tuesday and Wednesday so be watchful of that.
Just sharing observations and projections, not advice.
Safe trades!
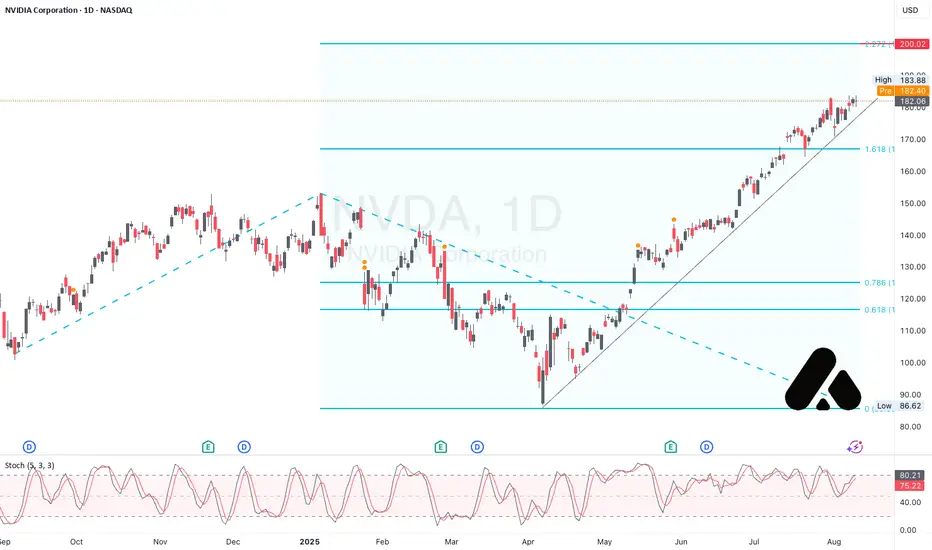
NVDA goes to $200NVDA keeps pushing towards $200 major resistance area, a very good momentum showed by a clear bullish trendline and stochastic momentum. No sign of bearish yet but still we've seen a slow but steady gain over the last couple days. Trend-based fibonacci is used to project the target price for NVDA. Short-term downward momentum might appear, however if NVDA isn't break down the 1.618 fibonacci level ($165-$170 price range) from the previous trend-based fibonacci, we could say that NVDA still remain bullish. Stop loss is optional on that level.
Nvidia (NVDA) Share Price Growth SlowsNvidia (NVDA) Share Price Growth Slows
Equity markets are on the rise:
→ The S&P 500 index (US SPX 500 mini on FXOpen) has reached a new all-time high;
→ The Nikkei 225 (Japan 225 on FXOpen) hit a fresh record high yesterday;
→ Gains are also seen across other assets — for example, Ethereum has climbed to its highest level since November 2021.
The CNN Fear & Greed Index indicates market “greed”, but it is worth noting that one of the market leaders, Nvidia (NVDA), is not matching the broader bullish momentum.
Technical Analysis of Nvidia (NVDA)
Although NVDA’s share price remains within a long-term ascending channel (shown in blue), holders have valid reasons for concern.
The NVDA chart shows that price growth is capped by the $183 resistance level, with a series of bearish signals emerging (as indicated by the arrows):
→ Following a bullish gap in late July, the price failed to sustain its highs and quickly retreated, erasing the upbeat sentiment;
→ A bearish engulfing pattern on 7 August suggests that the median line of the ascending channel is acting as resistance;
→ The RSI indicator peaked on 29 July, but subsequent price increases have not been accompanied by higher RSI highs — a sign of bearish divergence.
As a result, NVDA price is consolidating within a narrowing triangle:
→ On the one hand, higher lows indicate that buyers are still supporting the price;
→ On the other hand, the $183 level continues to cap the advance of this market leader despite the broader bullish environment.
Bulls need to show determination soon to break through the key $183 resistance; otherwise, the ascending channel in place since early July risks being breached. In that scenario, the August low near $172 could be retested.
This article represents the opinion of the Companies operating under the FXOpen brand only. It is not to be construed as an offer, solicitation, or recommendation with respect to products and services provided by the Companies operating under the FXOpen brand, nor is it to be considered financial advice.
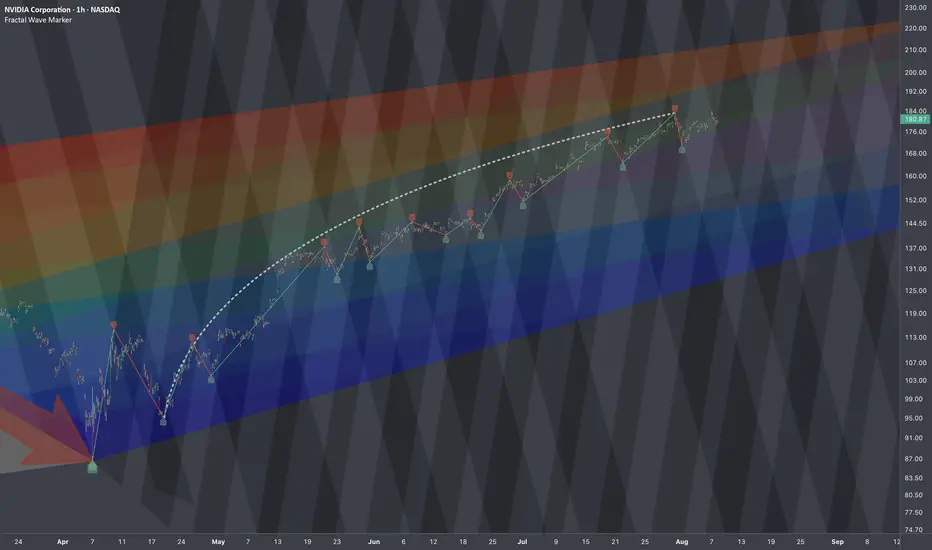
$NVDA: Tracking Formations🏛️ Research Notes
Frames of Reference
Interconnection of 3rd degree points fractal hierarchy
Multi-scale Interconnection
Merging into probabilistic layout
Market movement reflects proportional relationships inherent to its own scale. Fibonacci ratios, appear not by accident but as structural constants within this probabilistic environment. Price and time intervals often align with these ratios because markets are recursive systems where past structures inform the formation of new ones through scaled transformation. In this framework, the golden ratio serves as more than a tool for retracements or extensions, as encodes the geometry of market behavior itself via frames of reference. Whether in the spacing of pivots, the rhythm of cycles, or the layering of trends, its presence points to a self-organizing principle at work.
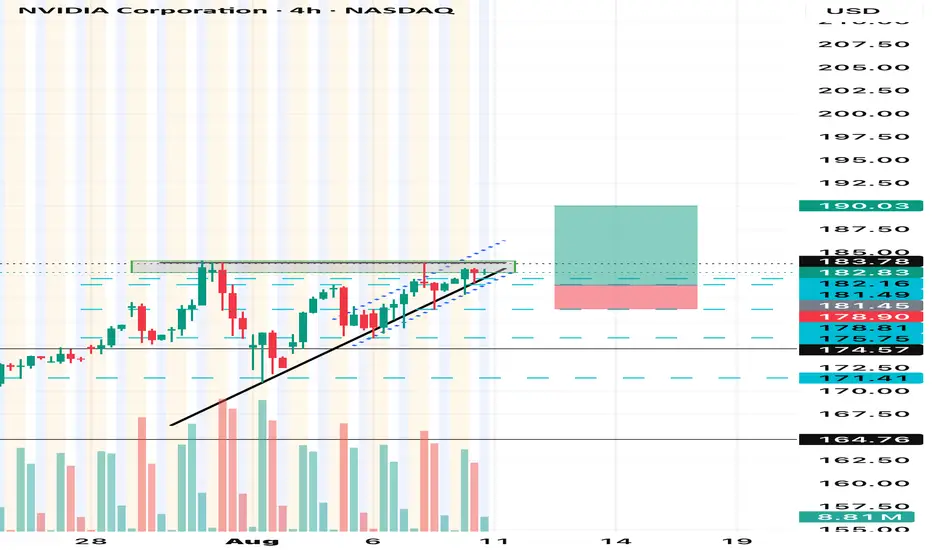
Nvidia 184 CallsNvidia 184 Calls
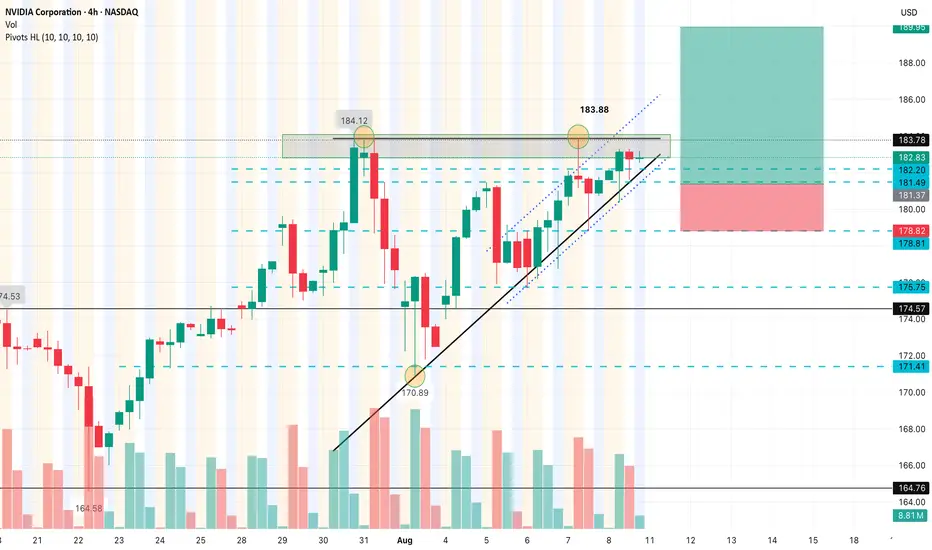
🔍 Pattern Analysis
• You’ve identified an ascending triangle pattern:
• Rising trendline support (black line).
• Flat resistance near the $183.78 level (green box).
• This is a bullish continuation pattern, especially in an uptrend like NVDA has been in.
Key Levels
• Current Price: ~$182.83
• Resistance / Breakout Zone: ~$183.78 (clearly marked)
• Support Levels:
• Short-term: $182.16, $181.49
• Risk Level (Stop): ~$178.90
• Stronger Support: $175.75, $174.57
• Target (Take Profit): ~$190.03 (marked in green)
Trade Setup (Buy Breakout)
• Entry: Around the breakout of $183.78
• Stop Loss: ~$178.90 (below recent lows)
• Take Profit: ~$190.03
• Risk/Reward Ratio: Roughly 1:2, which is solid
Volume Observation
• Volume has been decreasing during consolidation, which is typical before a breakout.
• Watch for a volume spike to confirm the breakout above $183.78.
Risks & Notes
• Price is currently near resistance; wait for a confirmed breakout (candle close above $183.78).
• If it rejects this level again, a break below the ascending trendline could flip the setup bearish.
• If support at $181.49 or $178.90 breaks, NVDA could pull back toward $175 or even $171.
Final Thought
This is a bullish setup, but confirmation is key. Either:
• Enter on breakout with volume confirmation.
• Or wait for a retest of $183.78 as support after the breakout.
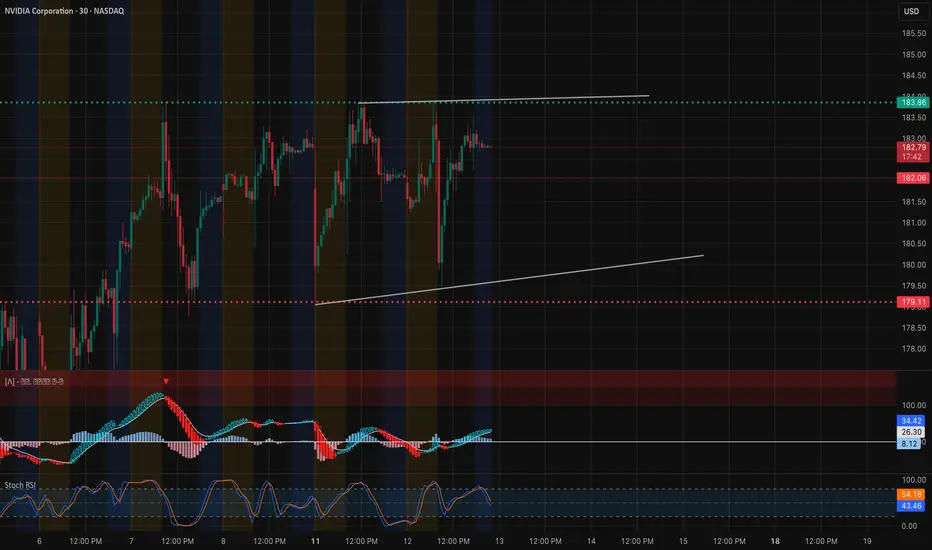
NVDA – TA + GEX Confluence for August 13, 202530-Minute Price Action
NVDA is trading in a tight consolidation range near $183.86, repeatedly testing resistance without a confirmed breakout.
* Resistance: $183.86 – multiple tests with no close above, forming the top of the range.
* Support: $182.06 – intraday pivot; $179.11 – deeper support and prior demand zone.
* Indicators:
* MACD is flat, reflecting indecision and reduced momentum.
* Stoch RSI is mid-range, suggesting room for either a breakout or a fade depending on market catalysts.
1-Hour GEX Insights
* Highest Positive NET GEX / Gamma Wall: $183.86 – matches perfectly with 30m resistance, showing strong hedging activity.
* Call Walls Above: $187.5 (2nd gamma wall), $190 (major call wall & 3rd gamma level).
* Put Support: $177.5 (1st defense), $175 (stronger floor), $172.5 (secondary gamma floor).
* IVR: 16.2 – relatively low implied volatility rank, keeping long option premiums reasonable.
TA + GEX Combined Read
The 30m chart’s repeated tests of $183.86 line up exactly with the largest GEX wall on the 1h chart.
* A breakout above $183.86 could trigger gamma-driven momentum into $187.5 and potentially $190 if volume supports.
* A rejection at $183.86 could bring a retest of $182.06, and if that fails, a move toward $179.11 and $177.5 GEX support.
Trading Scenarios for August 13
* Bullish Breakout: Long calls or debit spreads above $184 targeting $187.5–$190.
* Bearish Rejection: Puts or put spreads if $183.86 rejects and $182.06 breaks, targeting $179.11–$177.5.
* Neutral Range: Credit spreads between $179–$184 may work if consolidation continues, but be ready to close early on breakout.
Reasoning
The 30m chart’s tight range reflects market indecision, but the 1h GEX data highlights $183.86 as a key pivot for tomorrow. Breaks above this level open the path to the next gamma cluster, while rejection keeps NVDA in range or triggers a pullback toward strong GEX-supported floors.
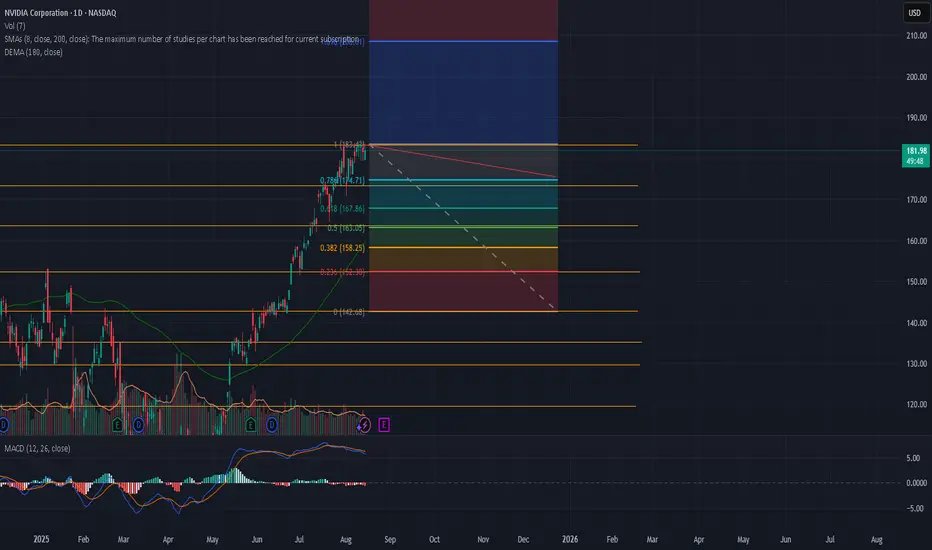
NVDA overextended?NASDAQ:NVDA going a bit over the moving average..... and for good reason. China's gonna make them a growth giant. Please go back down! Pullback/correction probably 175ish to low 160ish. I've always hated the Fib... but it kinda fitting on the chart.
Watchlist Only
No entry yet...
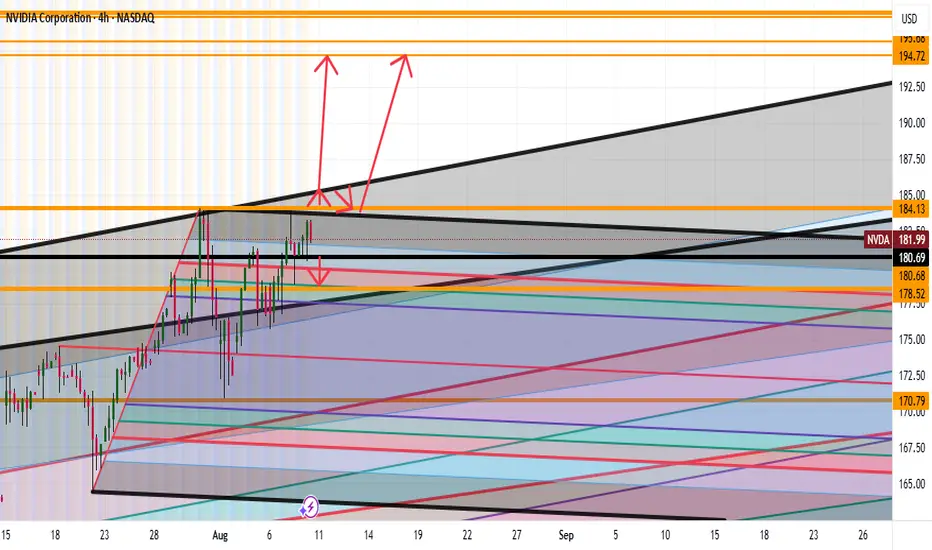
NVDA Going to 194 Full AnalysisGood afternoon Traders
So looking at NVDA we have a strong monthly bullish trend
Micro though we see the following:
Bearish: If we break the lows of 180 expect to see 178 getting hit
Bullish: Break 184 highs then expect to see a punch up to 185 then small correction then a big up to 190's or we miss the correction and blow right through to the 190's
Happy Trading Folks
Trade Smarter Live Better
Kris
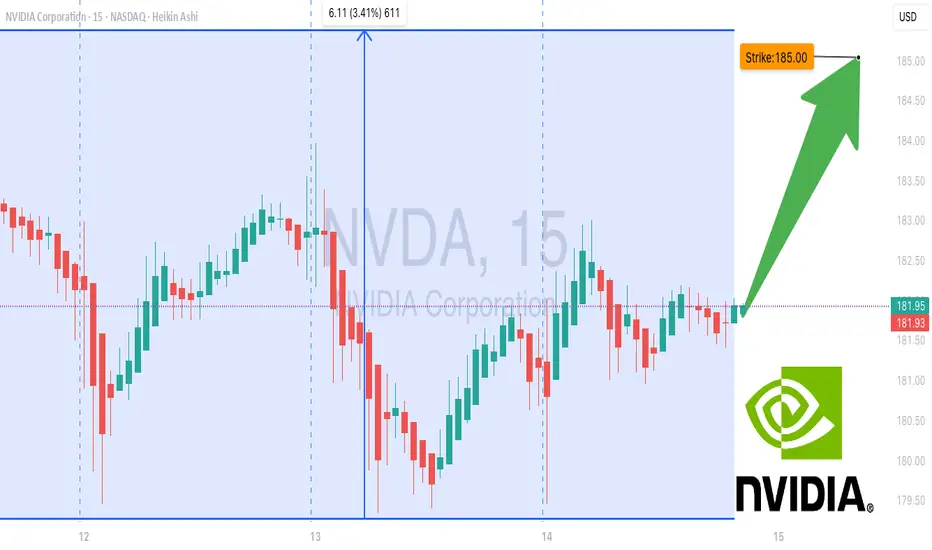
NVDA Gamma Showdown: Will Bulls Break $185 Before Time Runs Out? 🚀 NVDA Gamma Showdown: Will Bulls Break \$185 Before Time Runs Out?
**Sentiment:** ⚖️ *Moderate Bullish, High Risk*
* **Call/Put Ratio:** 1.78 📈
* **Daily RSI:** Mixed → Losing momentum
* **Weekly RSI:** Still bullish
* **Volume:** Weak → Low institutional conviction
* **Gamma Risk:** 🔥 HIGH — expiry in 1 day
* **Time Decay:** Accelerating ⚡
---
### 📊 **Consensus Highlights**
✅ Bullish options flow supports upside potential
⚠️ Weak volume + gamma risk = cautious sizing
💡 Tight stop loss and fast profit-taking advised
---
### 🎯 **Trade Setup**
* **Type:** CALL (Naked)
* **Strike:** \$185.00
* **Expiry:** 2025-08-15
* **Entry:** \$0.62
* **Profit Target:** \$0.86 (+30%)
* **Stop Loss:** \$0.31 (–50%)
* **Confidence:** 65%
* **Entry Timing:** Market open
---
💬 *This is a high-risk, high-reward expiry play — watch it like a hawk.*
📌 *Not financial advice. DYOR.*
---
**#NVDA #OptionsTrading #GammaSqueeze #DayTrading #StocksToWatch #OptionsFlow #TradingSignals #StockMarket**
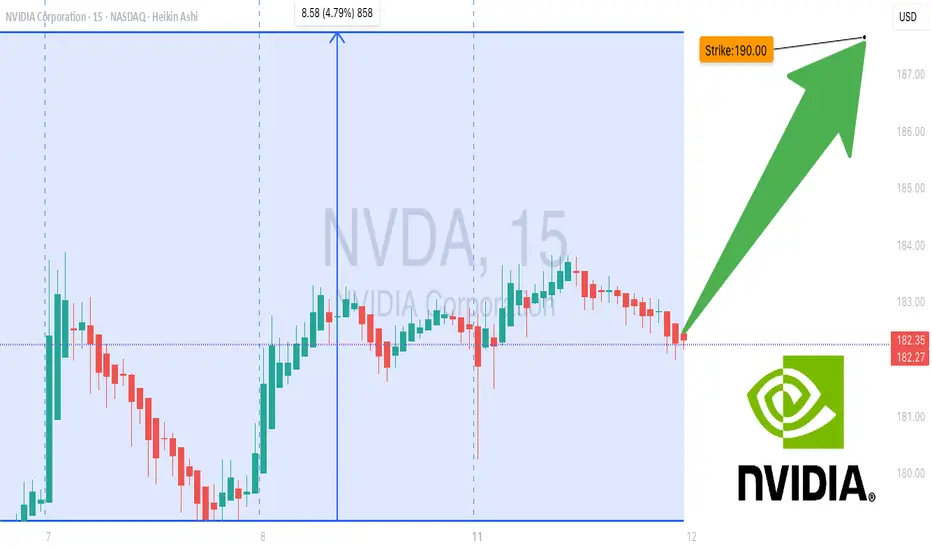
NVDA don’t Miss Out--$190 Call Target, Momentum on Fire## 🚀 NVDA Weekly Options Breakdown (Aug 11, 2025) 🚀
### 🔥 Market Sentiment: Bullish Bias Across Models
* **Grok/xAI**: Strong Bullish — rising RSI & bullish flow, but *watch weak volume*.
* **Claude/Anthropic**: Moderate Bullish but *no trade* due to policy risks & volume doubts.
* **Gemini/Google**: Moderate Bullish, recommends **\$192.5 calls** with stop loss — volume risk noted.
* **Llama/Meta**: Bullish — buy **\$190 calls**, manage volatility & premium decay.
### ✅ Consensus Trade Setup:
**Buy \$190 Calls** expiring Aug 15 @ \$0.70 premium
* 🎯 Profit Target: \$0.91
* 🛑 Stop Loss: \$0.35
* 📊 Confidence: 70%
* ⏰ Entry: Market Open Next Trading Day
### ⚠️ Key Risks:
* Policy/news impact on semiconductor sector
* Moderate gamma risk & possible volatility spikes near expiry
---
### 🔍 Model Insights Breakdown
| Model | Sentiment | Trade Idea | Confidence |
| ---------------- | ---------------- | ------------------------------ | ---------- |
| Grok/xAI | Strong Bullish | Buy \$190 Calls | 70% |
| Claude/Anthropic | Moderate Bullish | No trade (high news risk) | 45% |
| Gemini/Google | Moderate Bullish | Buy \$192.5 Calls w/ stop loss | 65% |
| Llama/Meta | Bullish | Buy \$190 Calls w/ risk mgmt | 70% |
---
### 💡 Why This Matters
* RSI and options flow point strongly bullish — calls dominate puts 1.2+ ratio
* Volume confirmation weak, so *manage risk tightly*
* Position best for aggressive traders ready to manage fast moves
---
📈 **NVDA Weekly Options Trade Summary**
```json
{
"instrument": "NVDA",
"direction": "call",
"strike": 190.0,
"expiry": "2025-08-15",
"confidence": 0.70,
"profit_target": 0.91,
"stop_loss": 0.35,
"size": 1,
"entry_price": 0.70,
"entry_timing": "open",
"signal_publish_time": "2025-08-11 10:33:48 UTC-04:00"
}
```
Nvidia 184.00 Calls aboveNvidia 184 Calls
🔍 Pattern Analysis
• You’ve identified an ascending triangle pattern:
• Rising trendline support (black line).
• Flat resistance near the $183.78 level (green box).
• This is a bullish continuation pattern, especially in an uptrend like NVDA has been in.
⸻
📊 Key Levels
• Current Price: ~$182.83
• Resistance / Breakout Zone: ~$183.78 (clearly marked)
• Support Levels:
• Short-term: $182.16, $181.49
• Risk Level (Stop): ~$178.90
• Stronger Support: $175.75, $174.57
• Target (Take Profit): ~$190.03 (marked in green)
⸻
📈 Trade Setup (Buy Breakout)
• Entry: Around the breakout of $183.78
• Stop Loss: ~$178.90 (below recent lows)
• Take Profit: ~$190.03
• Risk/Reward Ratio: Roughly 1:2, which is solid
⸻
📌 Volume Observation
• Volume has been decreasing during consolidation, which is typical before a breakout.
• Watch for a volume spike to confirm the breakout above $183.78.
⸻
⚠️ Risks & Notes
• Price is currently near resistance; wait for a confirmed breakout (candle close above $183.78).
• If it rejects this level again, a break below the ascending trendline could flip the setup bearish.
• If support at $181.49 or $178.90 breaks, NVDA could pull back toward $175 or even $171.
⸻
🧠 Final Thought
This is a bullish setup, but confirmation is key. Either:
• Enter on breakout with volume confirmation.
• Or wait for a retest of $183.78 as support after the breakout.
Let me know if you want a bearish scenario or a shorter time frame breakdown.
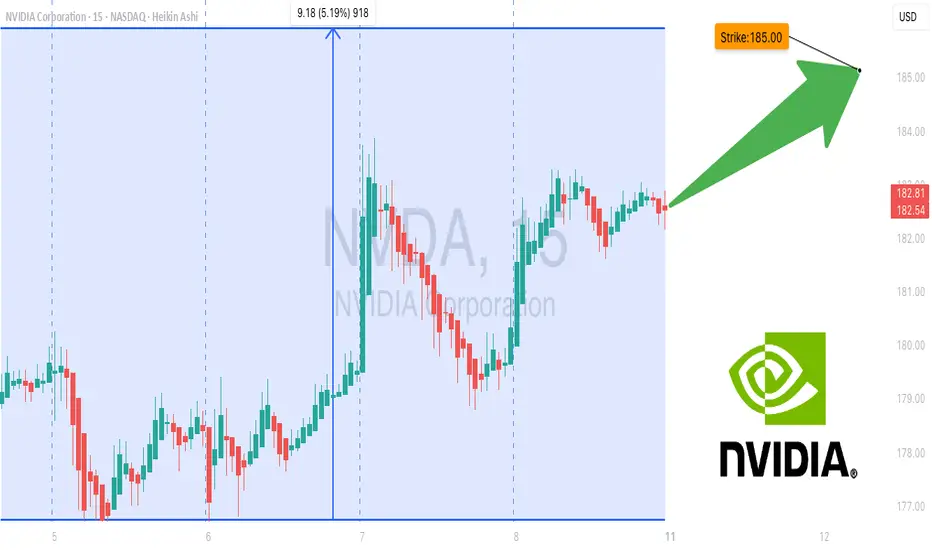
NVDA Don’t Miss Out## ⚡ NVDA Swing Setup (2025-08-08) ⚡
**Bias:** 📈 **Moderate Bullish** — RSI hot (67), trend up, low VIX, but volume still meh.
**🎯 Trade Plan**
* **Ticker:** \ NASDAQ:NVDA
* **Type:** CALL (LONG)
* **Strike:** \$185.00
* **Entry:** \$3.15 (near open)
* **Profit Target:** \$4.65 (+48%)
* **Stop Loss:** \$2.13 (-30%)
* **Expiry:** 2025-08-22 (14DTE)
* **Size:** 1 contract
* **Confidence:** 75%
**📊 Key Notes**
* RSI strong = momentum on your side ✅
* VIX favorable for calls ✅
* Weak volume & neutral flow = confirm before adding size ⚠️
* Watch breakout above **\$183.88** for momentum kick
**💡 Play Idea:**
Ride momentum to \$195+, take 50% profits at \$4.65, trail stops to lock gains.
$NVDA filled the gap. NASDAQ:NVDA filled the gap on the downside. A lot of bearish flow came in yesterday. But today the flow was bullish early.

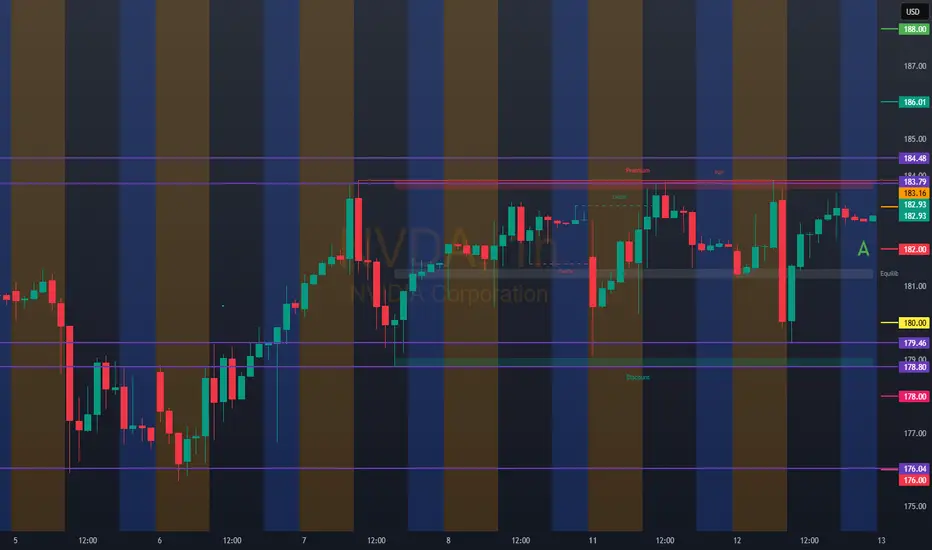
NVDA: 183.16 WEDNESDAYBullish Entry: 186.00 / 188.00 – Target: 188.00 – Stop: 184.00
Bearish Entry: 182.00 / 180.00 – Target: 180.00 – Stop: 183.50
breaks out with strength and volume, it could extend even to 190.00 intraday.
180.00 could act as a potential rebound.