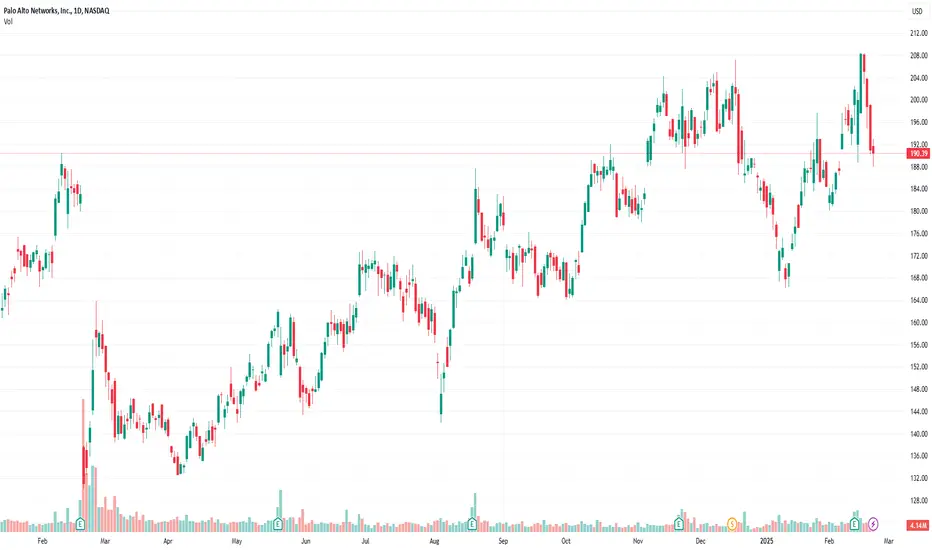
LONG PANW targeting 190-200After the announcement of buying cyber ark the stock took a major hit. We could see that buyers decided to step in at ~170, and the stock was trading around this price for several trading days and it is basing around that level. from here we could have a potential run up towards 190 for the up coming earning reports.
I think, that if the company decided to purchase cyberark for 20B, it is more likely that it had some success in the last quarter. therefore, I'm bullish on the stock.
losing 165-170 price level would be a negative sign, therefore stop should be placed bellow at ~163.
BZH
PANW trade ideas

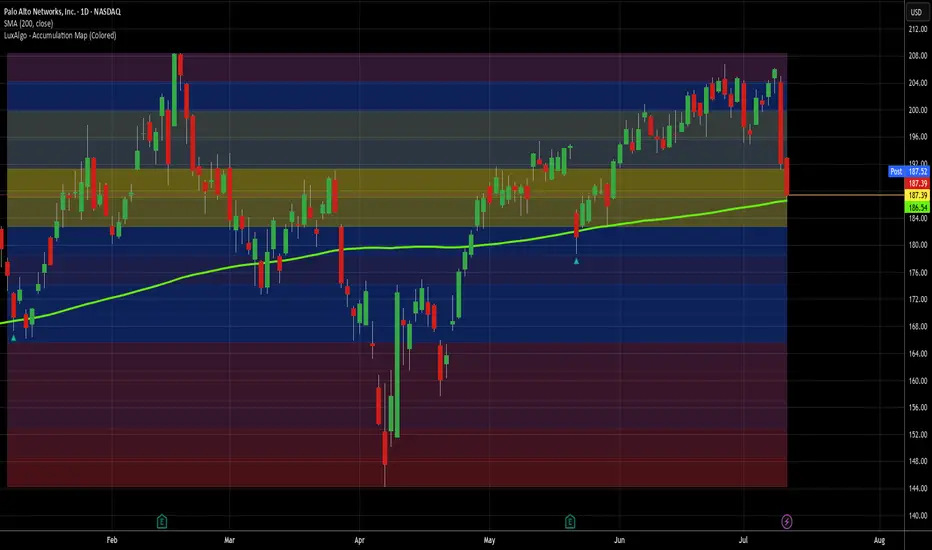
Palo Alto Networks Has Stumbled YTD. What Does Its Chart Say?Cybersecurity firm Palo Alto Networks NASDAQ:PANW will report fiscal Q4 results next week at a time when the stock is up 300%+ over five years, but down some 4% year to date. What does PANW's fundamental and technical analysis say?
Let's take a look:
Palo Alto Networks' Fundamental Analysis
PANW, CrowdStrike Holdings NASDAQ:CRWD and Zscaler NASDAQ:ZS are arguably the "Big Three" cloud-based, AI-assisted software cybersecurity platforms -- a group that's done well over the past year, but has been under pressure in recent weeks.
PANW has lost some 16% since its July 29 intraday peak, while CRWD has shed about 18% since its July 3 near-term top and ZS has given back 15% since its July 8 session high.
The group has pulled back even as the S&P 500 and Nasdaq Composite set new all-time highs. Cybersecurity firms have suffered as passive capital has been pulled from software in general.
However, that could change when the group reports quarterly earnings, starting with Palo Alto Networks.
PANW will release fiscal Q4 results next Monday after the bell, with analysts' consensus estimate calling for the firm to disclose $0.89 in adjusted earnings per share on $2.5 billion of revenue.
That would represent an 18.7% gain from the $0.75 in adjusted EPS that PANW reported in the same period last year, as well as a roughly 14% growth from the year-ago quarter's $2.2 billion in revenue.
In fact, Palo Alto Networks has reported 12%-15% year-over-year sales growth for five consecutive quarters.
Brad Zelnick of Deutsche Bank this week upgraded PANW to a "Buy" from a from a "Hold" this week, while increasing the stock's price target to $220 from an earlier $200.
Six other analysts also reiterated "Buy" or "Buy-Equivalent" ratings on Palo Alto Networks this week, with one increasing his price target to $225 from a prior $200.
That said, Roger Boyd of UBS recently took his PANW price target down to $185 from a previous $200, although the analyst reiterated his "Hold" grading of the stock.
All in, these eight analysts have collectively assigned Palo Alto Networks a $219.63 average target price vs. the $174.68 PANW was trading at Friday morning.
And interestingly, of the 44 sell-side analysts that I can find that cover PANW, 37 have revised their earnings estimates for the quarter higher since the period began. Just one has lowered his numbers, while six left their forecasts unchanged.
Palo Alto Networks' Technical Analysis
Now let's check out PANW's chart going back 12 months and running through Wednesday afternoon:
Readers will first notice that this chart shows an overarching "Triple Top" pattern of bearish reversal that began in earnest about a year ago.
This pattern's "neckline" or "pivot" is at $144 -- much lower than PANW's $174.68 Friday morning price. So, the chart is showing some risk for the stock.
On the other hand, PANW is looking to possibly test its 21-day Exponential Moving Average, or "EMA," marked by green line at $181.30 in chart above.
Taking that line could get the swing crowd behind Palo Alto Networks and potentially allow for a run at the stock's all-important 200-day Simple Moving Average, or "SMA" (denoted with a red line at $187.40 above).
Meanwhile, PANW's Relative Strength Index (or "RSI," marked with a gray line at the chart's top) is off of its weakest readings and approaching a more neutral level.
Similarly, the stock's daily Moving Average Convergence Divergence indication (or "MACD," denoted by black and gold lines and blue bars at the chart's bottom) has been weak, but appears to be strengthening going into earnings.
The histogram of the stock's 9-day EMA (the blue bars) is still in negative territory, but is ascending towards the zero-bound rather quickly.
Similarly, the 12-day EMA (the black line) is curling up towards the stock's 26-day EMA (the gold line). Although both are still in negative territory, a crossover there would be technically helpful for the bulls.
(Moomoo Technologies Inc. Markets Commentator Stephen “Sarge” Guilfoyle was long PANW and CRWD at the time of writing this column.)
This article discusses technical analysis, other approaches, including fundamental analysis, may offer very different views. The examples provided are for illustrative purposes only and are not intended to be reflective of the results you can expect to achieve. Specific security charts used are for illustrative purposes only and are not a recommendation, offer to sell, or a solicitation of an offer to buy any security. Past investment performance does not indicate or guarantee future success. Returns will vary, and all investments carry risks, including loss of principal. This content is also not a research report and is not intended to serve as the basis for any investment decision. The information contained in this article does not purport to be a complete description of the securities, markets, or developments referred to in this material. Moomoo and its affiliates make no representation or warranty as to the article's adequacy, completeness, accuracy or timeliness for any particular purpose of the above content. Furthermore, there is no guarantee that any statements, estimates, price targets, opinions or forecasts provided herein will prove to be correct.
Moomoo is a financial information and trading app offered by Moomoo Technologies Inc. In the U.S., investment products and services on Moomoo are offered by Moomoo Financial Inc., Member FINRA/SIPC.
TradingView is an independent third party not affiliated with Moomoo Financial Inc., Moomoo Technologies Inc., or its affiliates. Moomoo Financial Inc. and its affiliates do not endorse, represent or warrant the completeness and accuracy of the data and information available on the TradingView platform and are not responsible for any services provided by the third-party platform.
PANW Long to close the gap after earnings next Aug 18Because of the fall of NASDAQ:PANW was due to the acquisition of CyberArk and as sympathy fall from NASDAQ:FTNT but not because of fundamental reasons or sector/market issues, I used 1 year Fib Retracement to see what would be the worst bottom and best probability bounce taking in consideration that earnings will be very soon (Aug 18) and every short position will be most likely covered before earnings and the stock price taking a more down neutral level to go up or down after earnings.
So, considering this risk reward factors, last August 07th, when the stock went down to $166, I bought one Call Option OCT17 175 @7.75 just because this is the first time I trade this stock and it's not very liquid, and theta decay was less than -8, so I decided to place a swing trade and needed an option with low theta decay but maintaining 0.50 Delta.
The next day I say a Big Delta Long Vertical Trade made from a larger investor:
SELL -5,000 PANW 17OCT25 195 @2.82
BUY +5,000 PANW17OCT25 180 @6.45
That gave me more patience to wait for the bounce because the stock wasn't having the hard bounce I expected right away but someone invested almost 2 millions in this trade, which can be confirmed as Open Interest in the options chain.
Because this company has slightly beaten earnings expectations in the last quarters, and until now, there are no downgrades justifying the current price level:
UBS maintains Neutral at $185 lowering the PT from $200
Piper Sandler Upgraded PT from $200 to $225
And almost all ratings from the last months were in the bullish side.
I think the stock will close the gap after earnings around $195 where the explanation on how the CyberArk acquisition will be in the long term something beneficial, although this stock won't go back soon to its higher $210 price, I will expect a drop in the following days after earnings to around $180.
I'll close my position around $180 Before earnings or around $190 After earnings.
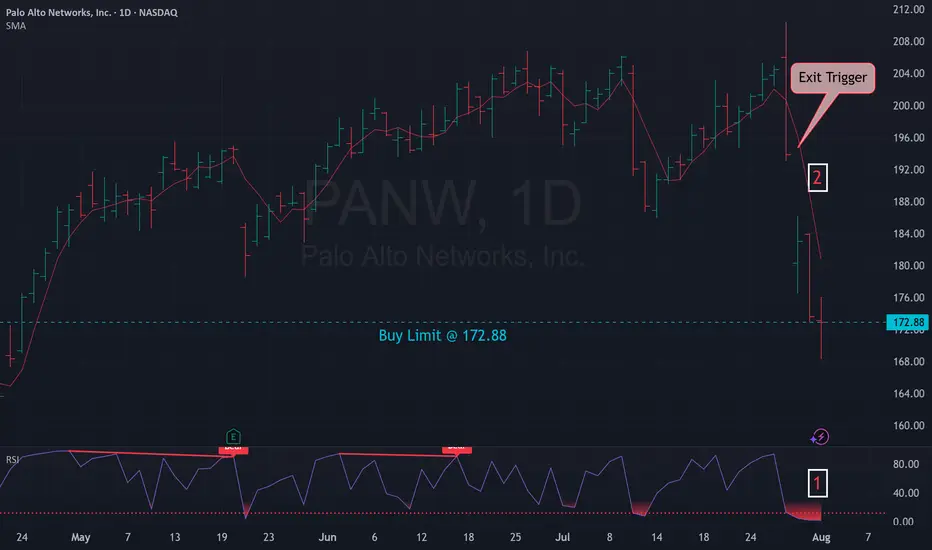
Mean Reversion Trade: PANW1. RSI in oversold region
2. Price likely to rebound back the the mean
Trade Rules:
Entry Trigger - RSI has cross below oversold region, enter limit buy at close price
Exit Trigger - Close at market when close price cross above exit trigger (Red line)
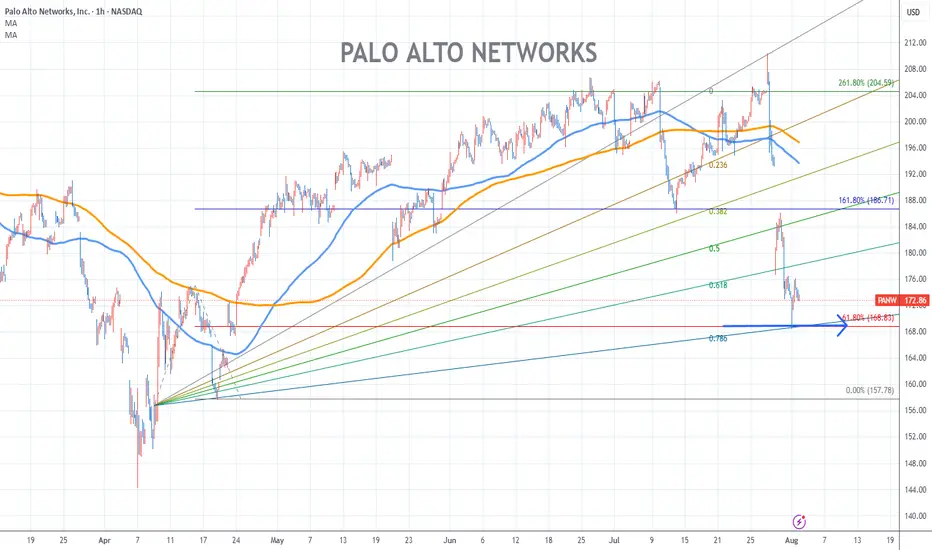
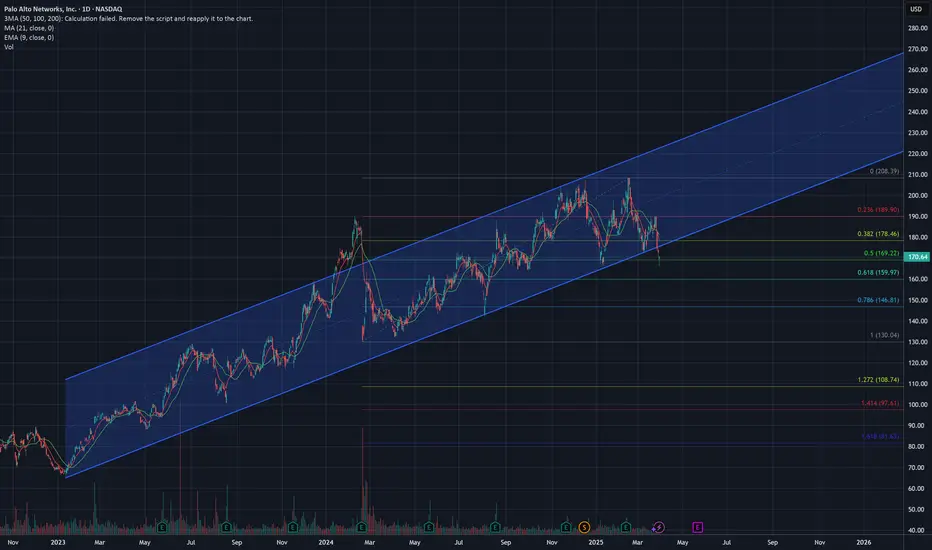
Palo Alto Networks Chart Fibonacci Analysis 080125Trading Idea
1) Find a FIBO slingshot
2) Check FIBO 61.80% level
3) Entry Point > 169/61.80%
Chart time frame:B
A) 15 min(1W-3M)
B) 1 hr(3M-6M)
C) 4 hr(6M-1year)
D) 1 day(1-3years)
Stock progress:C
A) Keep rising over 61.80% resistance
B) 61.80% resistance
C) 61.80% support
D) Hit the bottom
E) Hit the top
Stocks rise as they rise from support and fall from resistance. Our goal is to find a low support point and enter. It can be referred to as buying at the pullback point. The pullback point can be found with a Fibonacci extension of 61.80%. This is a step to find entry level. 1) Find a triangle (Fibonacci Speed Fan Line) that connects the high (resistance) and low (support) points of the stock in progress, where it is continuously expressed as a Slingshot, 2) and create a Fibonacci extension level for the first rising wave from the start point of slingshot pattern.
When the current price goes over 61.80% level , that can be a good entry point, especially if the SMA 100 and 200 curves are gathered together at 61.80%, it is a very good entry point.
As a great help, tradingview provides these Fibonacci speed fan lines and extension levels with ease. So if you use the Fibonacci fan line, the extension level, and the SMA 100/200 curve well, you can find an entry point for the stock market. At least you have to enter at this low point to avoid trading failure, and if you are skilled at entering this low point, with fibonacci6180 technique, your reading skill to chart will be greatly improved.
If you want to do day trading, please set the time frame to 5 minutes or 15 minutes, and you will see many of the low point of rising stocks.
If want to prefer long term range trading, you can set the time frame to 1 hr or 1 day.
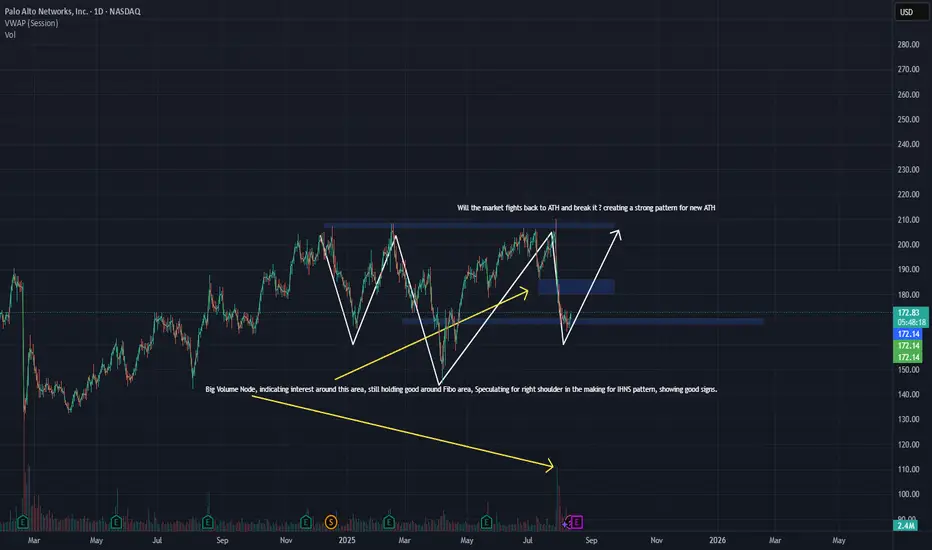
$PANW Showing signs.Showing signs of market appreciation, good response from the last dip market showing some resistance when it happened. the current price around 172, still trading around golden Fibonacci area, im positive that it would bounce back seeing the market appreciation by big volume node around 30 July, there is no anomaly seen. Forming the right shoulder for IHNS pattern, a good signs showing by touching the ATH area 4 times already means that the market is now speculating to test it on the 5th time while the price is guarded heavily, lets see can we have another breakout soon? or not.
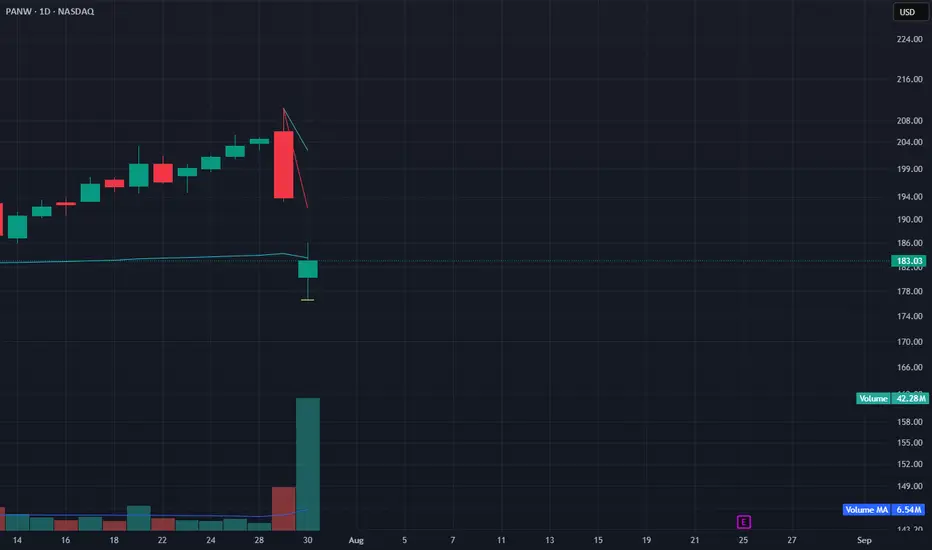
PANW Prints High-Volume Reversal Candle – VWAP Defense Holds forPANW followed yesterday’s breakdown with a high-volume reversal candle today, closing back above the anchored VWAP after flushing below it. Volume exploded to 42.28M (vs. 6.54M avg), confirming institutional activity.
Today’s green candle after a massive red bar forms a potential bullish reversal, especially with the wick undercutting VWAP and closing strong. The failed follow-through by bears may signal seller exhaustion — but confirmation is needed with a close above $186–188 in the next session.
The 30-min chart shows tight consolidation near VWAP intraday. Cautious long setups may emerge if bulls hold this reclaimed zone and break the short-term downtrend.
Indicators used:
Anchored VWAP (support briefly violated but reclaimed)
Volume surge (capitulation + reversal potential)
Price action (bullish reversal candle at key level)
Entry idea: Long above $186 with strength
Target: $194–198
Stop: Below $178 or today's low
7/30/25 - $panw - Adding back slowly7/30/25 :: VROCKSTAR :: NASDAQ:PANW
Adding back slowly
- leader is extending it's lead w/ NASDAQ:CYBR
- NASDAQ:CYBR was a top 3 name for me in the sector
- so yeah, i'm buying ITM leaps here, slowly
- welcome back to the long book NASDAQ:PANW
V
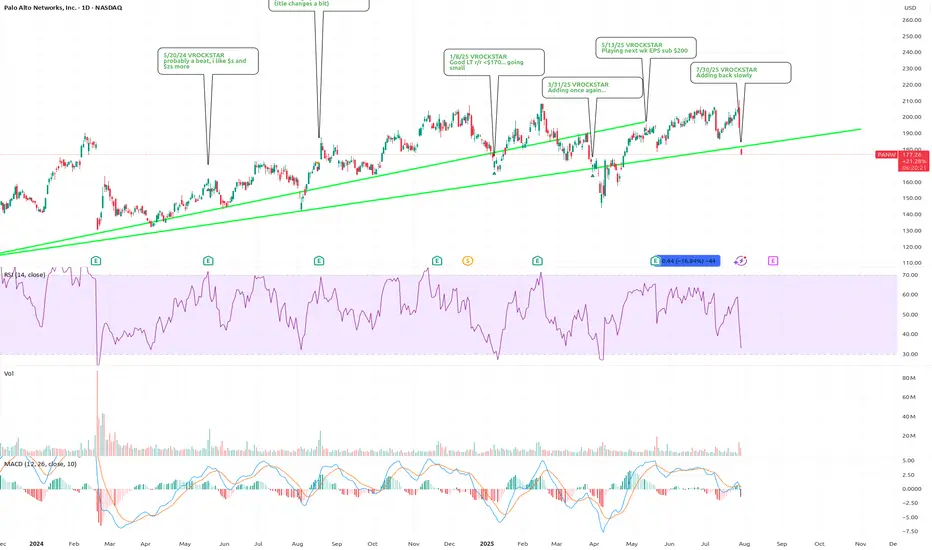
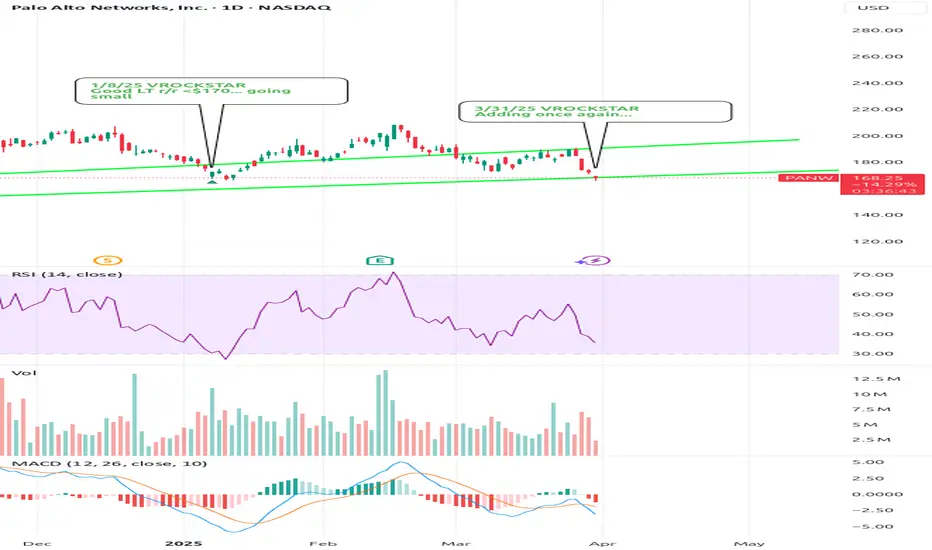
Taking another trip to Palo Alto for a quick flip If you want all the details on why I'm taking this trade, refer back to my Palo Alto ideas from Jan 8th and May 21st of this year. The only thing that has changed since May is 4 more profitable trades on PANW, so it's now 25-0. The longest of those 4 has taken 4 days and the average return on them has been 2.16%. So I'm going to Palo Alto again.
The entire cybersecurity sector took it on the chin yesterday, with NET, CRWD, ZS and others all down big and it continued today for them. I know PANW the best, so that's why I'm choosing it, but I think any of them could do well here. PANW is right on its 200d MA and has been above it for the better part of the last 3 years. Even if this trade takes longer than expected to produce, PANW and cybersecurity are not going anywhere. If I had to hold this one for years, I'd be happy to. Well, not "HAPPY" happy, but you get the point.
My exit is signal-based rather than price level based, but I'm targeting under a week for a return of 1-3% on average. Let's hope PANW keeps its record intact and makes this my best trade of the day.
As always - this is intended as "edutainment" and my perspective on what I am or would be doing, not a recommendation for you to buy or sell. Act accordingly and invest at your own risk. DYOR and only make investments that make good financial sense for you in your current situation.
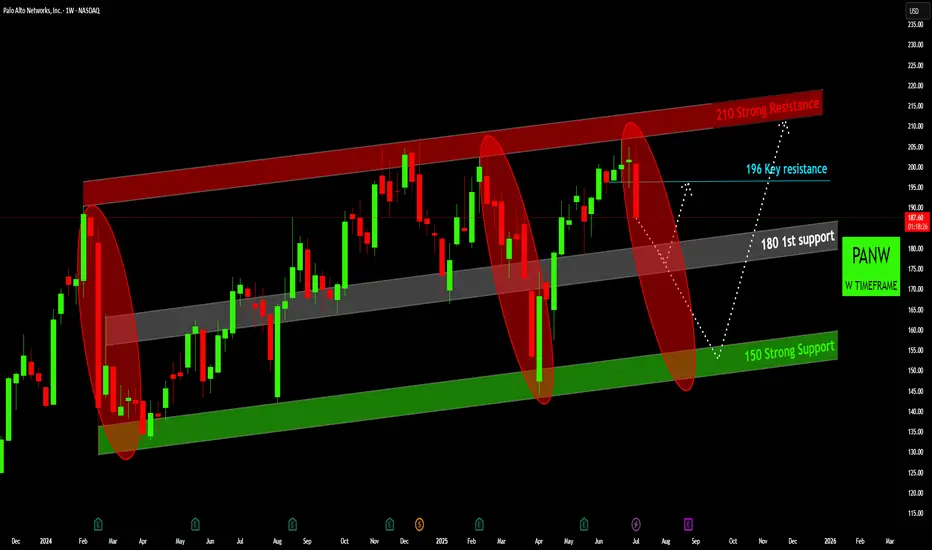
PANW: Following a Rhythmic Path Within a Clear TrendWhat we're looking at on this weekly chart for PANW is a very clear and structured uptrend, essentially a roadmap for the stock's price. The entire movement is contained within a well-defined ascending channel, which is broken down into three key zones:
The Lower Green Band (around 150): This is the "Strong Support" or the ultimate buy zone. Historically, whenever the price has pulled back to this level, buyers have stepped in aggressively, marking a significant bottom.
The Upper Red Band (around 210): This is the "Strong Resistance" or the primary sell zone. When the price gets up here, it tends to run out of steam, and sellers take control, pushing the price back down.
The Middle Grey Band (around 180): This acts as the market's centerline or "1st support." It's a pivot area that the price frequently interacts with.
The most interesting feature highlighted here is the cyclical or rhythmic pattern of the price action, marked by the red ovals. The chart shows a recurring theme: the stock rallies toward the upper red resistance, gets rejected, and then experiences a sharp, multi-week pullback.
Putting it all together:
The chart suggests that PANW is currently in the middle of one of these pullback phases after being rejected from the upper part of its channel. The analyst has laid out a potential scenario based on this historical rhythm:
The price may continue its descent, potentially breaking the 180 1st support level.
The ultimate target for this pullback would be the 150 Strong Support zone, where the stock has historically found its footing.
From there, the pattern would suggest a new rally could begin, with an initial target back up towards the 196 Key resistance area.
In short, while the long-term trend is up, the chart implies the current correction may have more room to run before the next major buying opportunity presents itself around the 150 level.
Disclaimer:
The information provided in this chart is for educational and informational purposes only and should not be considered as investment advice. Trading and investing involve substantial risk and are not suitable for every investor. You should carefully consider your financial situation and consult with a financial advisor before making any investment decisions. The creator of this chart does not guarantee any specific outcome or profit and is not responsible for any losses incurred as a result of using this information. Past performance is not indicative of future results. Use this information at your own risk. This chart has been created for my own improvement in Trading and Investment Analysis. Please do your own analysis before any investments.
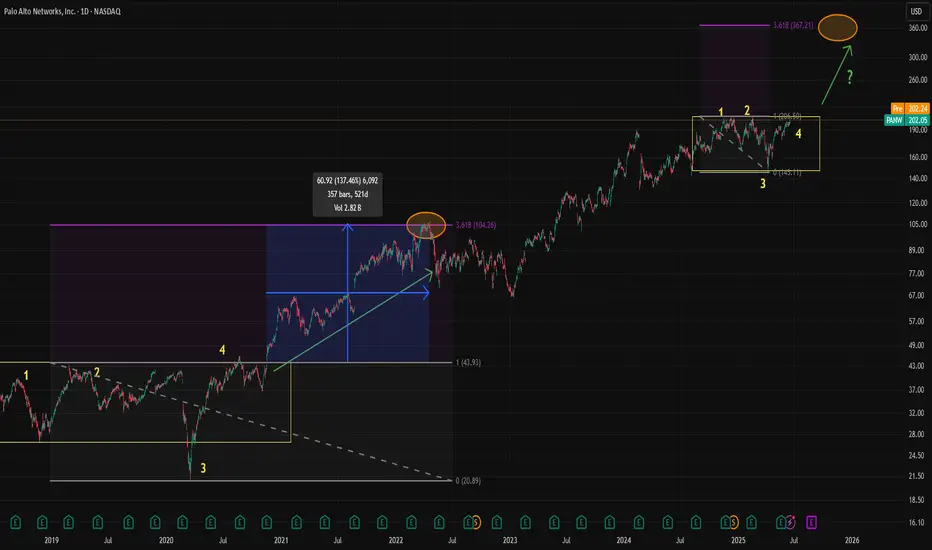
Palo Alto Formed Bullish Pattern with 80% Return PotentialPalo Alto Networks (PANW) has technically formed a pattern similar to its 2019–2021 flat period. Back then, after two tops (points 1 and 2) and a sharp bear trap breakdown below the current range (point 3), PANW retested the upper side of the range once more (point 4), which was followed by a massive breakout. From point 3 to the top, PANW rallied 361.8% of the range width, delivering more than a 130% return in about a year and a half.
Currently, PANW appears to be forming a smaller version of that same pattern. Points 1, 2, and 3 seem to be in place, and we are now at point 4. Excluding fundamentals, if the same pattern completes, the technical target could be around $367, an over 80% potential return from current levels. However, it may be wise to wait for a confirmed breakout for validation.
On the fundamental side, PANW appears to be trading at a high valuation compared to both its historical averages and sector peers. The 2-year forward P/E average is 51.2x, while the current forward P/E sits at 55.5x not drastically higher, but still elevated. That said, Palo Alto is expected to post 14.29% year-over-year revenue growth with a strong operating margin in the upcoming earnings report.
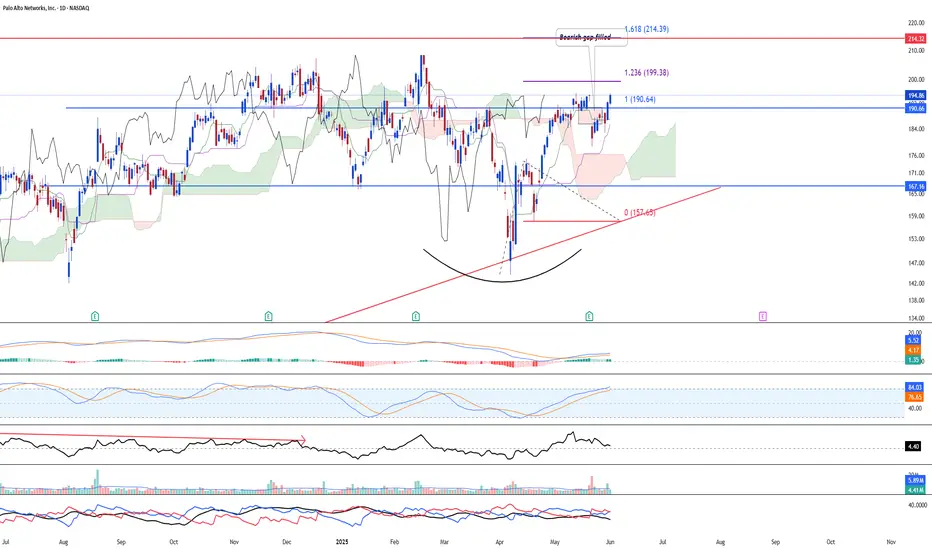
PANW - Upside remain strong NASDAQ:PANW has turned positive and is still lagging behind its peer NASDAQ:CRWD as CRWD has made new high in recent days. Furthermore, PANW has close above the key resistance turned support and closed above the bearish gap on 21 May 2025.
Momentum wise, the stock is on the rise, with the exception of the 23-period ROC which saw slight decline BUT remain elevated above the zero line.
Volume remain healthy and as such, we maintain buy for PANW over the longer-term period with near-term target at 218.00. Support to watch is at 172.00 in a major correction.
Quick flip idea - long at 181.26Today was a rough day for the market, but rough days are opportunities. Days like this require confidence in what you do, though. For me, confidence comes from data. Could there be more downside ahead? Yep. Taking the time to mine data to understand whether what you are doing has been successful in past circumstances where corrections have been involved helps me trade with confidence in these situations.
Since May of 2022, this particular setup is 20-1 and has an average return of 1.82% in and average of under 9 trading days. That's over 4x the average daily return of the market overall. Of the 21 trades, all but 3 closed in 6 trading days or less, with 10 of them closing in one day. During that same time, PANW had corrections of 10% or more over a dozen times, and several 20%+ drops. Those results give me confidence that the trade will work out, and more likely than not, do so quickly.
I normally don't trade stocks right after earnings, I usually like to wait 3 days for selling pressure to subside, but this setup has proven successful regardless of the proximity to earnings. In fact, some of its best returns are from just after earnings.
Per my usual strategy, I'll add to my position at the close on any day it still rates as a “buy” and I will use FPC (first profitable close) to exit any lot on the day it closes at any profit.
As always - this is intended as "edutainment" and my perspective on what I am or would be doing, not a recommendation for you to buy or sell. Act accordingly and invest at your own risk. DYOR and only make investments that make good financial sense for you in your current situation.

PANW – ABCDE Pattern Nearing BreakoutWe're tracking Palo Alto Networks (PANW) on the 5-minute chart, showing a textbook ABCDE triangle formation.
Leg E is nearly complete, with price respecting the rising support line and volume compressing.
We expect a potential breakout above $194.30, with first target at $195.50 (TP1)
and extended targets at $208 and $220, depending on post-earnings momentum.
Setup Highlights:
Symmetrical triangle with well-defined legs
RSI holding between 55–60 → healthy pre-breakout energy
Low volume → potential energy build-up before move
Invalidation if price breaks below $192.70 – setup is off.
"No FOMO. No guessing. Just structure and confirmation."
We don’t chase the move – we position for the breakout.

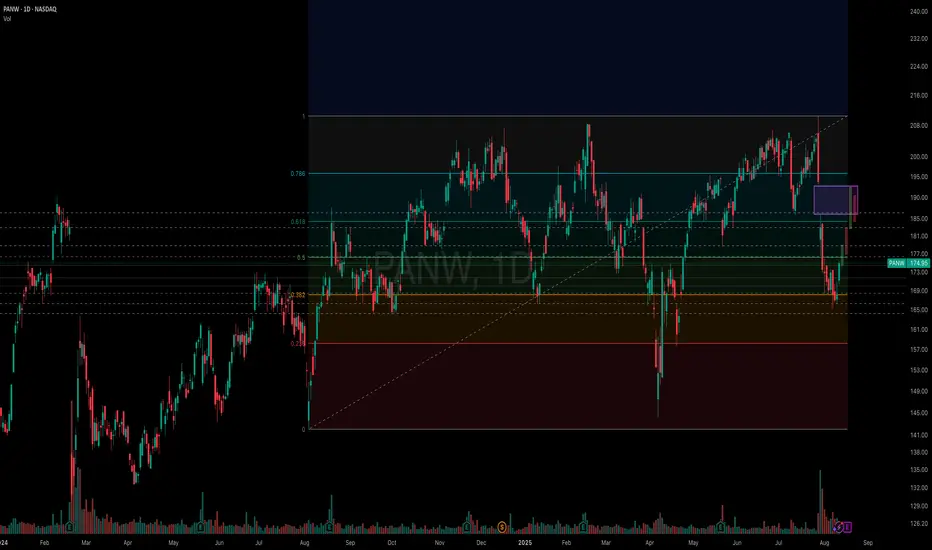
PANW Weekly Chart Analysis - Bullish Reversal or Just a Bounce
PANW has staged a strong comeback from a major support zone, reclaiming its bullish channel and now knocking on the door of previous highs. With key indicators flashing early bullish signals, the stock is setting up for a potential breakout — but the overhead resistance remains a critical hurdle.
Technical Breakdown
Trend Structure
Rebounded from long-term demand zone (~$136–$145)
Back inside the ascending price channel
Testing major resistance at $208.25 (previous high)
Fibonacci Levels
0.786 retracement (support): $168.27 — respected perfectly
0.618 support zone: $136.77 — long-term base
Fib extension resistance: $226.87 — aligns with channel top
Indicators
PMO: Bullish crossover from bottom range; early upside signal
RSI: At 55.93, trending upward; plenty of room before overbought
Bullish Scenario
If PANW closes above $208.25 with volume:
Opens clean breakout potential to $226.87 (Fib extension & channel top)
Momentum indicators support trend continuation
Pullbacks toward $182–$185 likely to get bought aggressively
Trigger: Weekly close > $208.25
Target: $226.87
Support levels for re-entry: $185, $175, and $168
Bearish Scenario
If PANW gets rejected at $208.25:
Could form a double top and trigger a reversal
Breakdown below $175 would invalidate near-term bullish setup
Watch for retest of $168.27 (Fib + demand zone) — losing that risks flush toward $137
Trigger: Rejection at $208 + close below $175
Downside risk levels: $168 → $145 → $137
Final Thoughts
The weekly structure leans bullish — but the next $10 range is a battlefield. If buyers clear $208, there’s room to run. Until then, manage risk and watch for decisive confirmation before committing full capital.

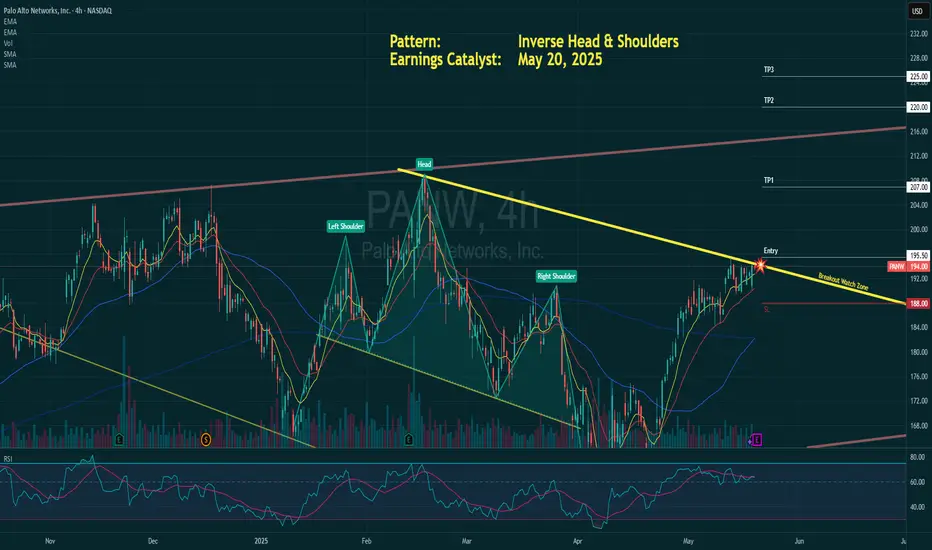
$PANW – Inverse Head & Shoulders + Earnings CatalystThis is a textbook pattern combined with a high-impact earnings event:
- Pattern: Inverse Head & Shoulders
- Neckline Breakout Zone: ~$195.50
- Stop Loss: $187.97
- TP1: $207
- TP2: $220
- TP3: $225
Catalyst:
Earnings on May 20th – AI product suite and strong cybersecurity demand could trigger breakout momentum.
Volume is still below average, which is typical pre-earnings. A breakout with volume confirmation could ignite a high-conviction move.
Not financial advice. Just sharing my technical perspective. Let the market decide.
What Palo Alto Networks’ Chart Says Heading Into EarningsCybersecurity giant Palo Alto Networks NASDAQ:PANW plans to release earnings next Tuesday (May 20) at a time when the stock has gained more than 30% since just April 7. Let’s check out the stock’s fundamental and technical picture heading into the results.
Palo Alto Networks’ Fundamental Analysis
PANW has benefited in recent weeks from Wall Street’s view that cybersecurity is one area that could avoid serious impacts from the still-unresolved global trade wars.
Many also think the sector could benefit from potentially inelastic long-term demand going forward.
In fact, 28 of the 35 sell-side analysts that cover the stock have increased their earnings estimates since the current quarter began.
All in, Wall Street was looking at last check for Palo Alto Networks to report $0.77 of fiscal Q3 adjusted earnings per share on roughly $2.3 billion of revenue.
That would compare unfavorably to the $1.33 in adjusted EPS that Palo Alto Networks reported in the same period last year, but would reflect a 15% increase from Q3 2024’s roughly $2 billion of revenues.
Beyond the headline numbers, one item that investors will closely watch will be what PANW reports for Next Generation Security annually recurring revenue (or “ARR”).
Back in February, the firm projected $5.03 billion to $5.08 billion for this metric and $13.5 billion to $13.6 billion in remaining performance obligation.
Palo Alto Networks’ Technical Analysis
Now let’s look at PANW’s chart going back roughly six months and running through Wednesday:
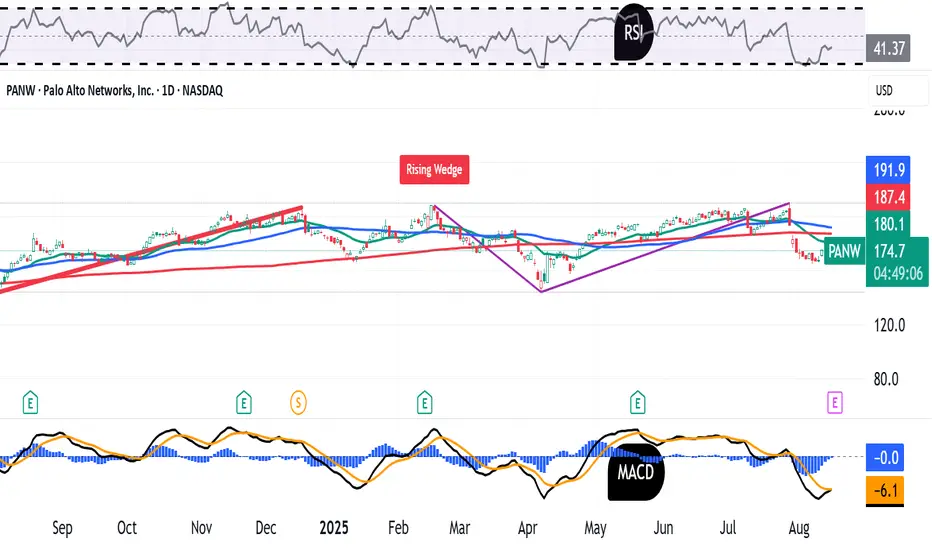
Readers will first see that the stock recently came out of a so-called “double top” pattern of bearish reversal, as denoted with the two red boxes marked “Top 1” and “Top 2.”
However, that pattern appears to have run its course with a sell-off that culminated in early April.
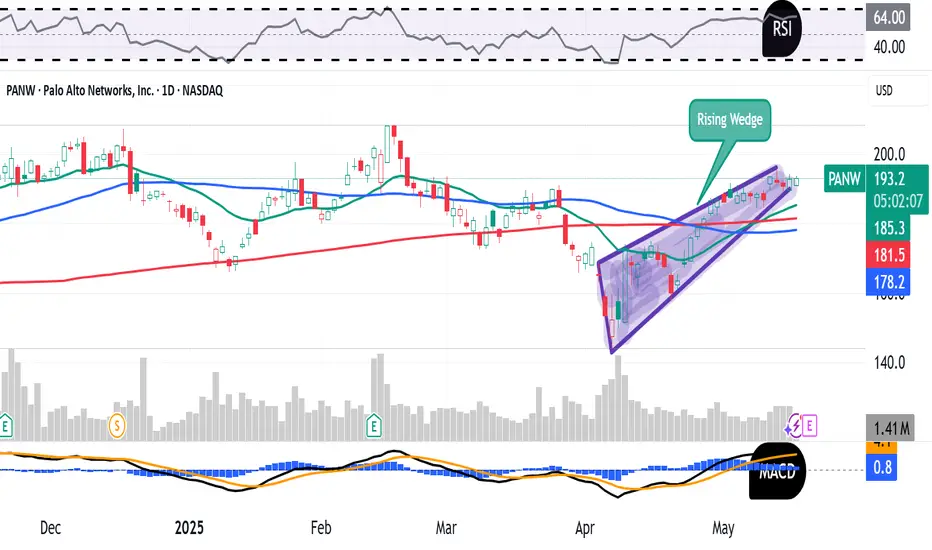
Since then, Palo Alto Networks has rallied into what looks to me like a so-called “rising wedge” pattern, marked with a green box above. Unfortunately, for PANW investors, that’s also traditionally a pattern of bearish reversal.
Does that mean PANW’s price should fall from here? Going into earnings, that's a tricky question.
The shares are trading above their 200-day Simple Moving Average (the red line above), their 50-day SMA (the blue line) and their 21-day Exponential Moving Average (the green line).
That traditionally would keep swing traders and portfolio managers invested in the stock going into next week’s earnings report. But what comes out of those earnings and whatever guidance the company provides could be another story.
Meanwhile, PANW’s Relative Strength Index (the gray line at the chart’s top) is better than neutral, but seems to be declining.
That said, the stock’s daily Moving Average Convergence/Divergence indicator (or “MACD,” denoted by the black and gold line and blue bars at the chart’s bottom) looks like it’s in good shape.
The histogram of Palo Alto Networks’ 9-day EMA is in positive territory, while the 12-day EMA is riding above the 26-day EMA. Both of those lines are also in positive territory. Many would view all of that as a bullish set-up.
Add it all up and whatever guidance the company issues next week will very likely be what either pushes capital into PANW or pulls it out.
The stock’s upside pivot in the chart above is its $208 February high, while PANW’s downside pivot is its 200-day SMA at $181.20. When a stock’s 200- and 50-day SMAs run close together, the 200-day SMA historically takes precedence.
(Moomoo Technologies Inc. Markets Commentator Stephen “Sarge” Guilfoyle had no position in PANW at the time of writing this column.)
This article discusses technical analysis, other approaches, including fundamental analysis, may offer very different views. The examples provided are for illustrative purposes only and are not intended to be reflective of the results you can expect to achieve. Specific security charts used are for illustrative purposes only and are not a recommendation, offer to sell, or a solicitation of an offer to buy any security. Past investment performance does not indicate or guarantee future success. Returns will vary, and all investments carry risks, including loss of principal. This content is also not a research report and is not intended to serve as the basis for any investment decision. The information contained in this article does not purport to be a complete description of the securities, markets, or developments referred to in this material. Moomoo and its affiliates make no representation or warranty as to the article's adequacy, completeness, accuracy or timeliness for any particular purpose of the above content. Furthermore, there is no guarantee that any statements, estimates, price targets, opinions or forecasts provided herein will prove to be correct.
Moomoo is a financial information and trading app offered by Moomoo Technologies Inc. In the U.S., investment products and services on Moomoo are offered by Moomoo Financial Inc., Member FINRA/SIPC.
TradingView is an independent third party not affiliated with Moomoo Financial Inc., Moomoo Technologies Inc., or its affiliates. Moomoo Financial Inc. and its affiliates do not endorse, represent or warrant the completeness and accuracy of the data and information available on the TradingView platform and are not responsible for any services provided by the third-party platform.
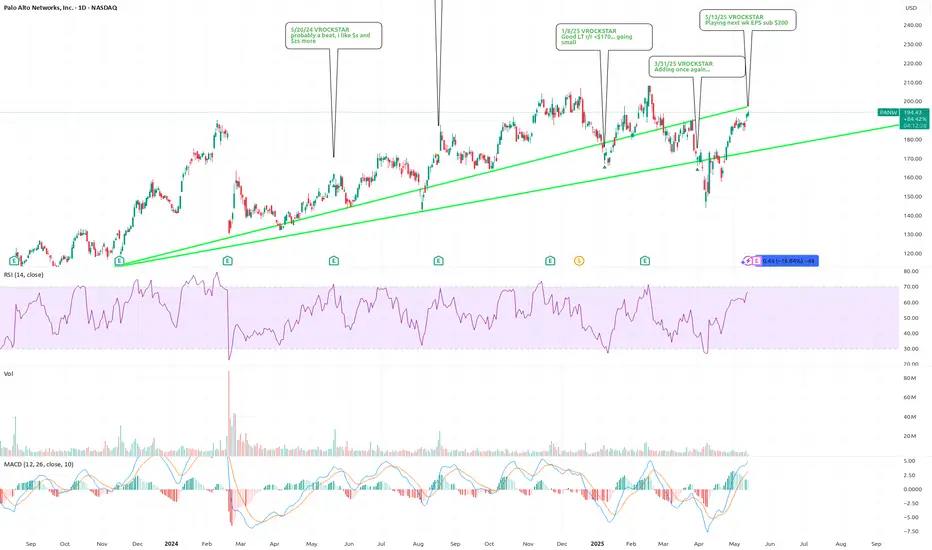
5/13/25 - $panw - Playing next wk EPS sub $2005/13/25 :: VROCKSTAR :: NASDAQ:PANW
Playing next wk EPS sub $200
- not the cheapest
- but the leader
- and also not pltr-style expensive
- rule of 40 applies here
- like the CEO, a lot
- chart excellent
- call spreads to play the move above $200 next week, without necking out too much (because i'm using the dip buys and calls in the last few weeks - which were the *chuckles* """easy money""" buys) to cash up a bit
- but i like this sector
- i like the mcap/ size
- cyber still an underowned sector w good tailwinds
- not tariff/ IRL exposed
V
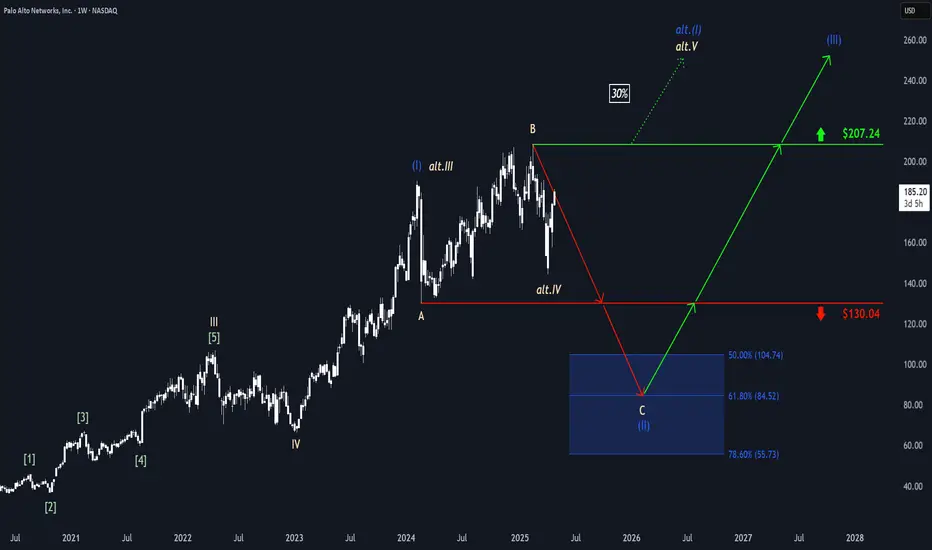
Palo Alto Networks: Countermovement or Breakout?Palo Alto has faced increasing upward pressure and has been noticeably pushed higher. Thus, the stock is ogling our alternative scenario, which envisions a direct breakout above the resistance level at $207.24. In this 30% likely scenario, we would attribute the last low to the beige wave alt.IV and prepare for a new high of the blue wave alt.(I). Primarily, however, we classify the recent gains as a countermovement and locate the stock already in the bearish blue wave (II), which should settle its low within the blue Target Zone between $104.74 and $55.73; prior to that, the price must fall below the support at $130.04. After the wave (II) low, a new (wave (III)) uptrend should begin and eventually lead to new all-time highs above $207.24.
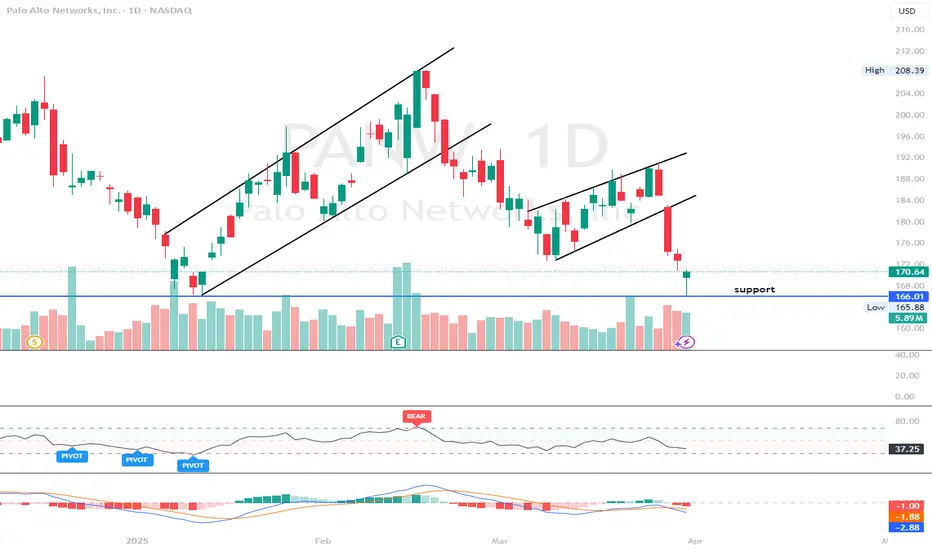
$PANW - support bounce plus hammer candlePANW - Stock making a hammer candle on the daily. on watch for reversal to the upside if pattern completes. Stock bounced of $166 previous support level. looking for calls as long as $170 holds for a move towards $180 and higher
PANW Rising ChannelI'll be waiting to see if this can make it back into the rising channel before making a buy.
3/31/25 - $panw - Adding once again...3/31/25 :: VROCKSTAR :: NASDAQ:PANW
Adding once again...
- trading position
- but >3% fcf yields on industry winner
- u see that google txn on Wiz for $32 bn? here's 109 bn and dominant
- mid teens growth unaffected by tariffs
- if anything more cross border cyber warfare is secular "issue" that benefits these guys
- since last writing, they put up a great quarter
- but the mkt just correlation 1 here
- so trading this long. would love to size it up, but of course that would probably require closer to $150 to add it to the MT/ LT book
- nonetheless, it's a buy here.
V
Anticipated Growth Post-CorrectionKey arguments in support of the idea.
We view the current correction as an advantageous entry point for investors.
The negative effects of U.S. tariffs imposed on other countries are expected to be minimal for Palo Alto Networks.
Investment Thesis
Palo Alto Networks, Inc. (PANW) is a U.S. company dedicated to cybersecurity. It develops cutting-edge solutions designed to protect enterprise networks, cloud environments, and endpoints from cyber threats. The company’s flagship offerings include next-generation firewalls (NGFW), SASE security platforms (Prisma Access), and cloud infrastructure protection solutions (Prisma Cloud). PANW leverages artificial intelligence and machine learning extensively to detect and thwart cyber attacks. The company serves a diverse clientele that spans large enterprises, government agencies, and cloud service providers worldwide. It is headquartered in Santa Clara, California.
We view the current correction as an advantageous entry point. Despite the robust first-quarter FY 2025 financial results that exceeded both internal forecasts and market expectations, Palo Alto Networks’ stock is experiencing nearly a 5% decline in the premarket. The main disappointment for investors was the weakerthan-expected guidance for the third quarter of FY 2025 adjusted diluted EPS. However, the company has raised its financial performance forecast for FY 2025, amid stronger revenue growth. The fundamentals of the business remain strong. Palo Alto Networks is aggressively expanding its platform solutions with AI integration, enhancing its competitive edge in the industry. In the second quarter, the company secured approximately 75 new platformization deals, a substantial increase from 45 in the same period last year. Overall, the number of platforms adopted by its top 5,000 customers exceeded 1,150, compared to 850 a year earlier. Additionally, the number of customers utilizing two platforms increased by more than 50% y/y in the second quarter, and the number of customers using three platforms tripled compared to the previous year. The adoption of a platform approach within Cortex also more than tripled y/y, signaling significant growth in XSIAM’s popularity. This trend reinforces the view that the future of cybersecurity lies in AI-driven platforms that can dramatically accelerate threat response. We view the current market correction as an opportune entry point.
The negative effects of U.S. tariffs imposed on other countries are expected to be minimal for Palo Alto Networks. The company upgrades its contract manufacturing facility in Texas to a primary manufacturing and order fulfillment center. This enables the company to scale and innovate its devices while benefiting from the foreign trade zone status. This move will help mitigate tariff costs on international shipments. Furthermore, all firewalls are assembled and manufactured in the U.S., rendering the impact of tariffs against China negligible on the company’s future earnings.
The target price for the shares is $220, the rating is Sell. We recommend setting a stop loss at $167.