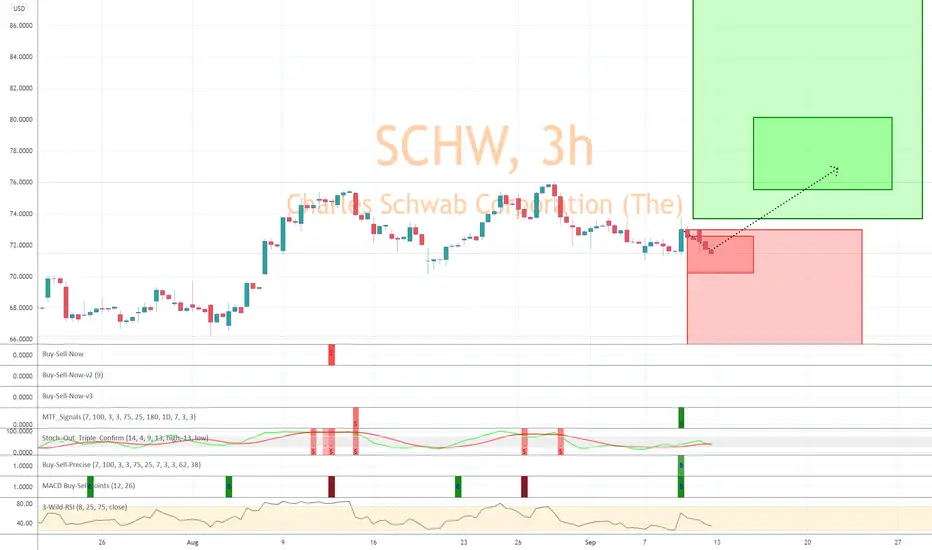
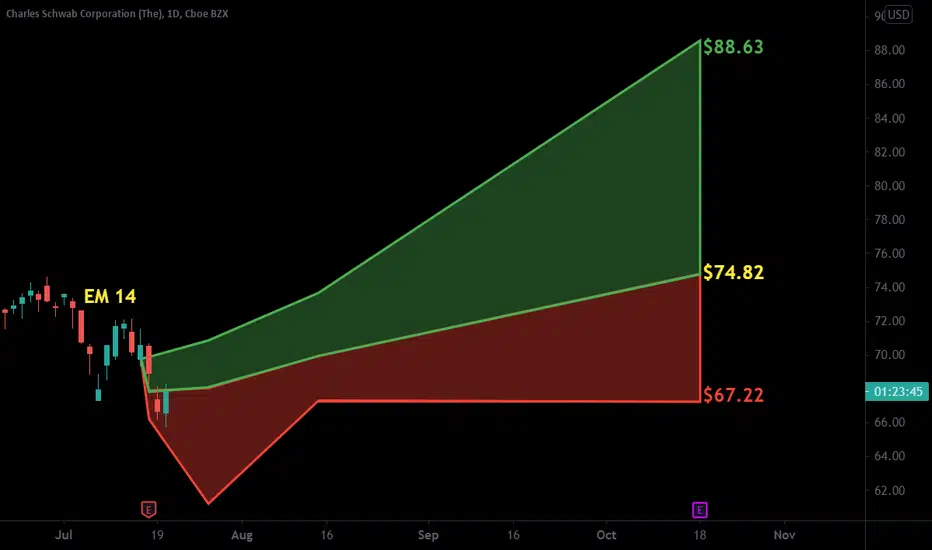
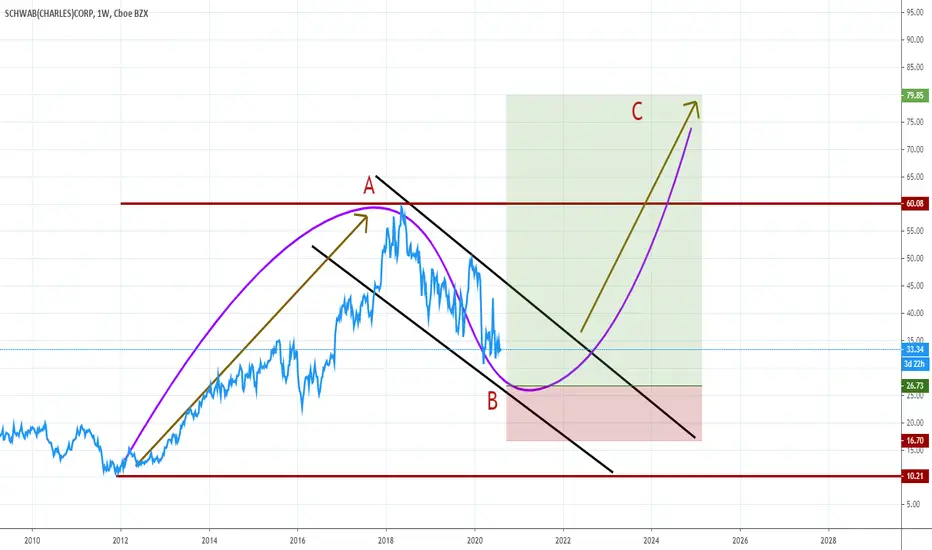
Schwab Set For Quick Bounce? Based on historical movement, the trough could occur anywhere in the larger red box. The final targets are in the green boxes. The pending top should occur within the larger green box as has been the historical case. Half of all movement has ended in the smaller green box. In this instance, the signal indicated BUY on September 9, 2021 with a closing price of 73.0.
If this instance is successful, that means the stock should rise to at least 73.65 which is the bottom of the larger green box. Three-quarters of all successful signals have the stock rise 3.444% from the signal closing price. This percentage is the bottom of the smaller green box. Half of all successful signals have the stock rise 5.3515% which is the end point of the black dotted arrow. One-quarter of all successful signals have the stock rise 9.7635% from the signal closing price which is the top of the smaller green box. The maximum rise on record would see a move to the top of the larger green box. These are the same concepts for the levels in the red boxes as well.
The ends/vertical sides of the boxes are determined in a similar fashion. The peak of the rise can occur as soon as the next trading bar after signal close, while the max rise occurs within the limit of study at 40 trading bars after the signal. A 0.75% rise must occur over the next 40 trading bars in order to be considered a success. Three-quarters of successful movement occur after at least 12.5 trading bars; half occur within 25.5 trading bars, and one-quarter require at least 35.5 trading bars.
The black dotted arrow represents median historical movement. Medians are a good metric, but they are just one of many I use when forecasting future movement.
As always, the stock could decline the very next bar after the signal without looking back (therefore the red boxes would not come into play) or the stock may never decline (and the green boxes may never come into play).
SCHW trade ideas
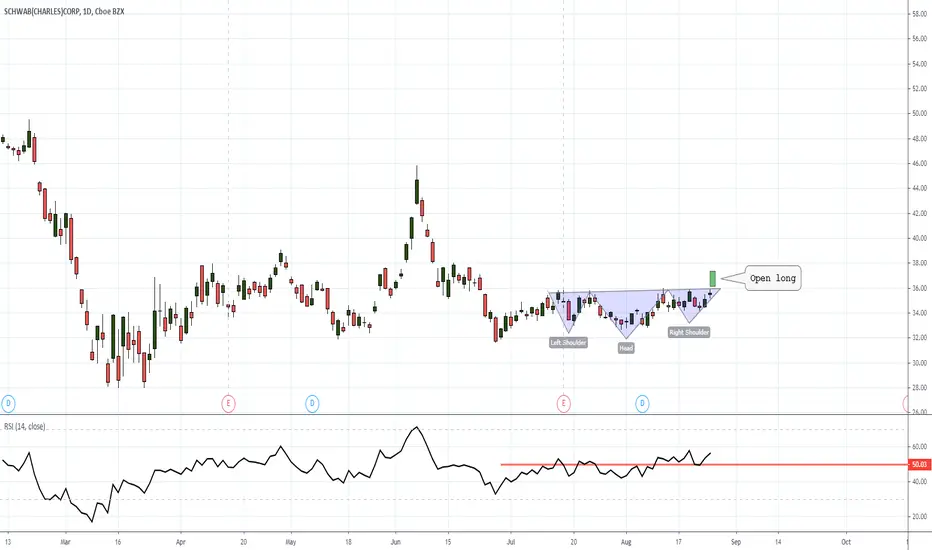
SCHW Trade RecapEarlier this week, I took a trade on SCHW on the 30 minute chart. Found it had been rallying on higher time frames (HTF) from a pullback.
I decided to scale down to a lower time frame chart to find an entry. Preferably a pull back.
Decided to enter on a bull flag.
The previous day had shown strong bullish buying pressure as indicated by the bullish candlesticks closing near their highs during the rally. The first flag that I entered on was a 2-legged pullback from the highs with a High 2 breakout. When the breakout bar closed on its high, indicating strength from the bulls, I took a long position.
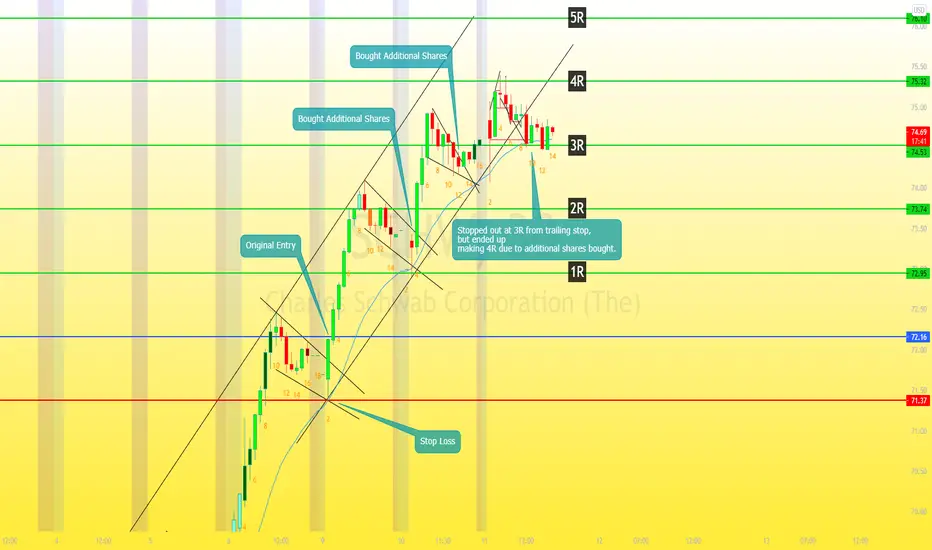
My exit strategy was to trail my Risk Units. (For example, when risking $100 on a trade, $100 is 1 Risk Unit (1R). Therefore for every $100 move in profit, or every 1R move, you'd move your stop loss up 1R behind it.)
I bought more shares, equal to my first entry, on every bull flag that had occurred in the bullish trend. Therefore, I bought additional shares twice over the course of the trade. This increased my chances for earning bigger profits as long as it continued to go in my direction.
I bought my first additional shares after my stop loss had already been moved to 1R. Effectively eliminating my risk. Since I bought the new shares around 2R, my 1R stop loss was now breakeven. Due to share price averaging. So I was at no risk of losing any money.
As the trade continued to move in my favor, I continued to move my stop loss up, locking in profits.
I bought my last shares near 3R after the final flag in the move. Again, for the same amount of shares I had bought in my original entry. My size was now 3x bigger than my original entry.
After the trade had reached 4R, I moved my stop loss up to 3R and got stopped out there after the stock had came back down. Even though I got stopped out at 3R, I walked away with a 4R profit, due to buying additional shares on the way up and my risk never being greater than my original positions stop size due to my trailing stops.
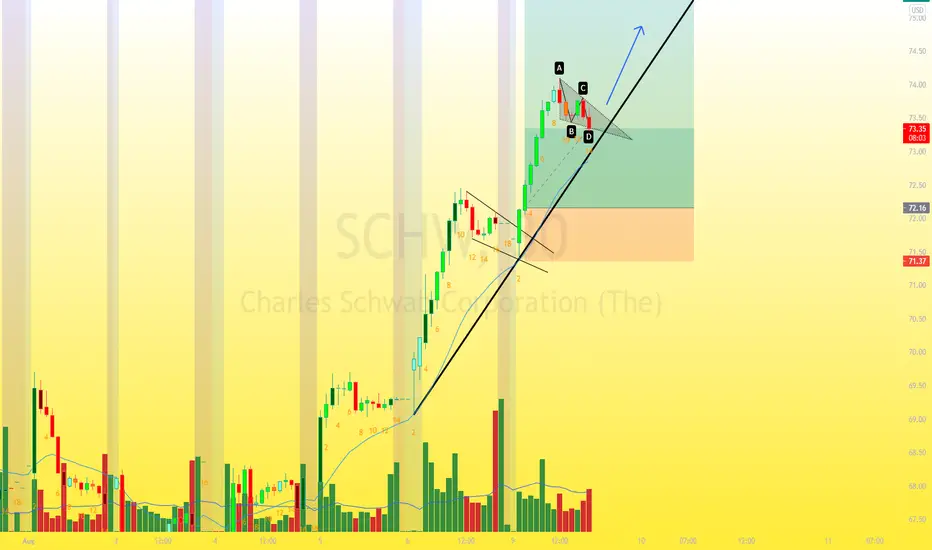
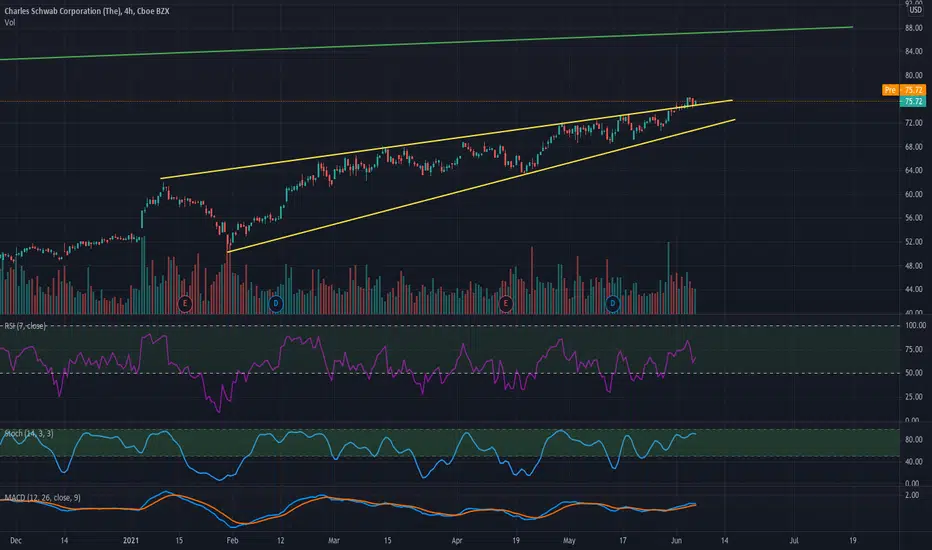
SCHW Price Action AnalysisAfter a great rally on SCHW today, we are moving into the close with a bull flag that is nearing the bullish trendline and the 20 Exponential Moving Average (EMA).
Still holding my position from the open today with a trailing stop. Expecting another leg up from this flag if we see a good breakout tomorrow.
Hoping to see a nice 4R trade from this swing.
$SCHW with a Bullish outlook following its earnings #Stocks The PEAD projected a Bullish outlook for $SCHW after a Negative Under reaction following its earnings release placing the stock in drift D
If you would like to see the Drift for another stock please message us. Also click on the Like Button if this was useful and follow us or join us.
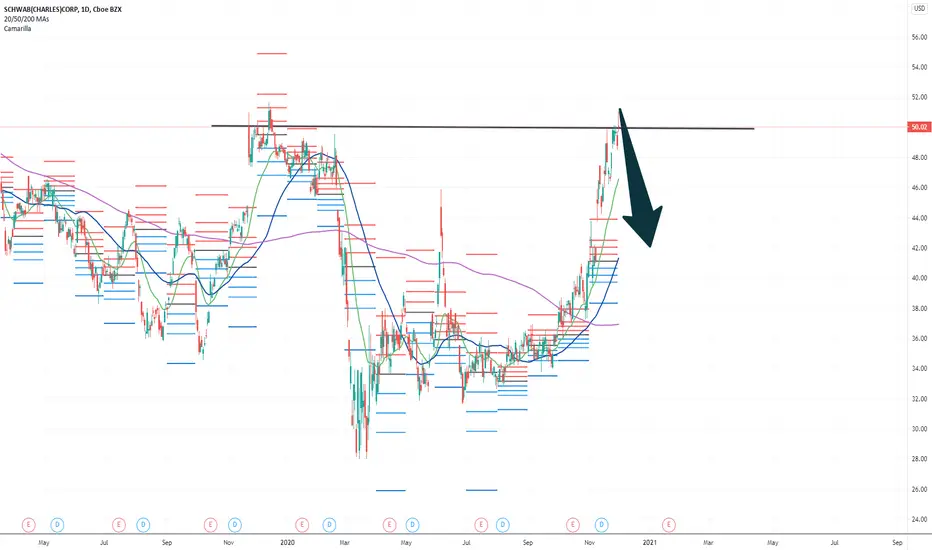
Fade this break--for now.If I could short SCHW right now, I would. Short-term trade only, but likely to go lower for the next one to two weeks as TNX fails to return to new highs. Modest profits available. But the bigger move is the bounce upward that follows.
SCHW - 13.82% Potential Profit - Swing Trading SetupGood risk / reward ratio on this trade.
Bullish Pennant breakout.
- Target Entry: $76.00
- Target Stop Loss: $74.32
- Target Exit: $86.32
- Risk / Reward Ratio: 6.14
About me
- Note that I tend to adjust stop losses in order to secure profits early and preserve capital. This means that the target price is going to be achieved as long as there are no strong pullbacks that trigger my new adjusted stop loss
- When I see that the market is opening too high/low, I wait for 30 min from the opening bell before placing my order. This is to avoid that initial spikes / drops get me into a position and get me out right after.

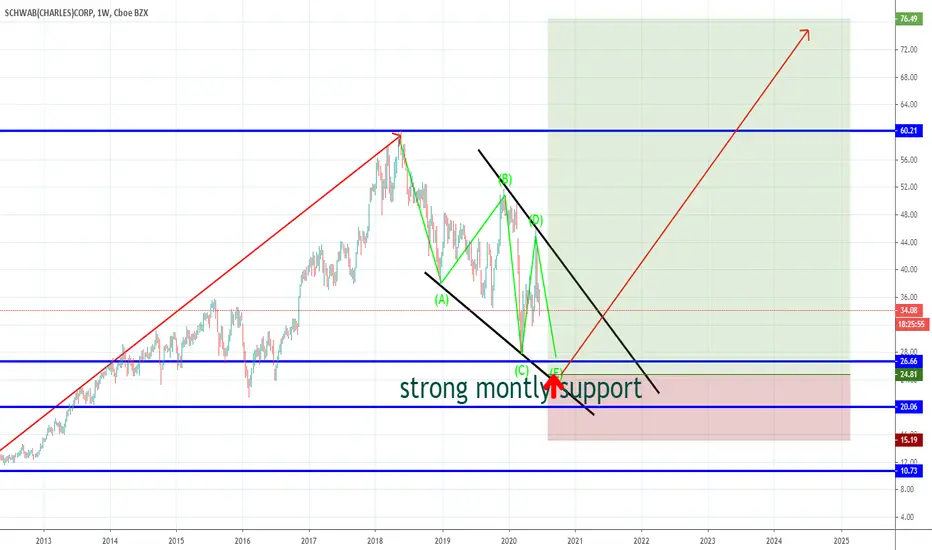
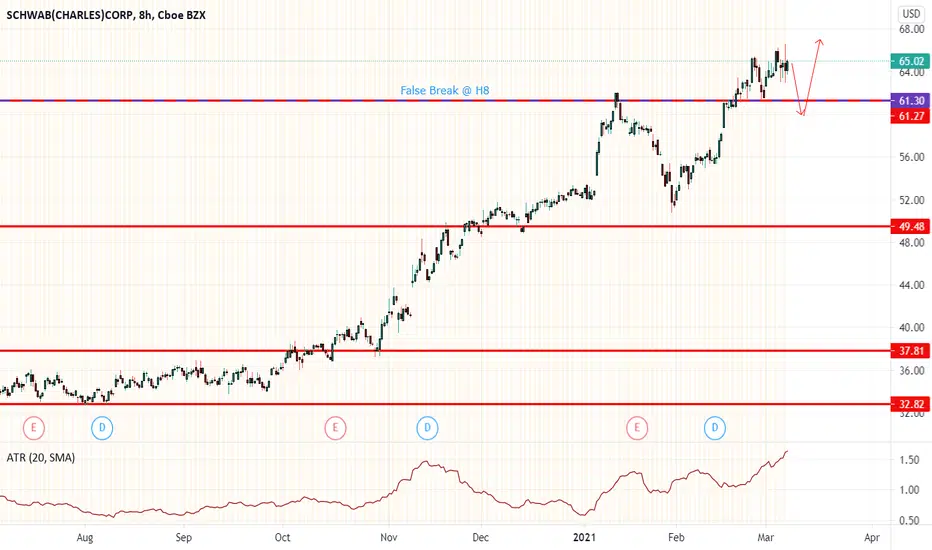
SCHAWB(CHARLES) Corp (SCHW) - S&P 500 - False Break Price recently break through resistance, looking for price to retest previous resistance turn support.
Wait for price to do a false break around 61.30 area.
False Break candlestick pattern: Hammer / engulfing
Disclaimer: Below simple trading idea is just for sharing, please do your own due diligence and apply risk management.
Finance sector industry getting momentum!Stocks usually moves in clusters, and it is obvious that finance sector becomes hot since last week.
If you check the last week performance of the companies over 100 Billion market cap, soon you will notice 5 out of the first 10 best performance belongs to Finance sector. Interestingly, Wells Fargo ( check my WFC analysis published on Feb 16th) was the best performer and the only one with double digit return in a week among 88 companies with over 100 billion market cap..!
This types of analysis and results can help you differentiate a true analyst from crooked pumpers..!
Moshkelgosha

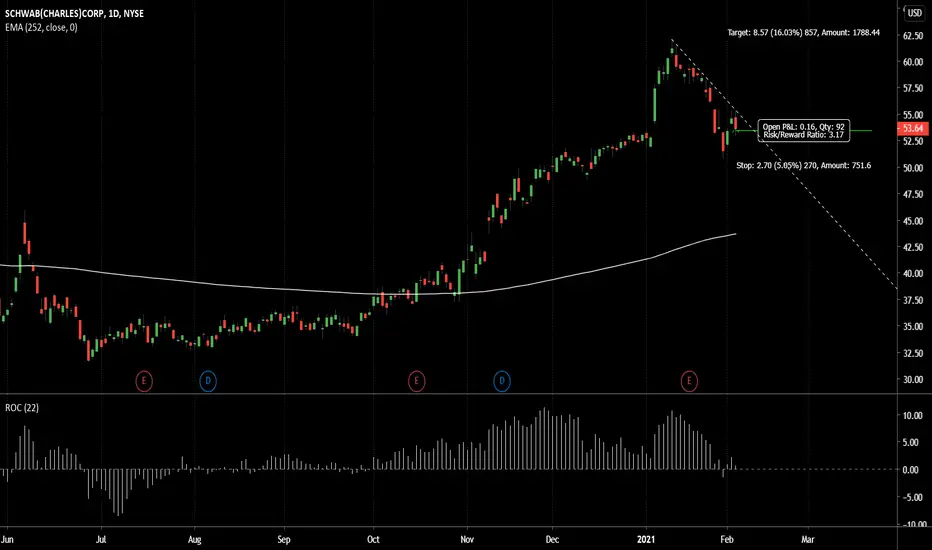
Broker a dealReversal setup to the upside
Reward/Risk: 3.1/1
Entry: 53.59 or at a lower price
Stop: 50.00
Target: 63.00
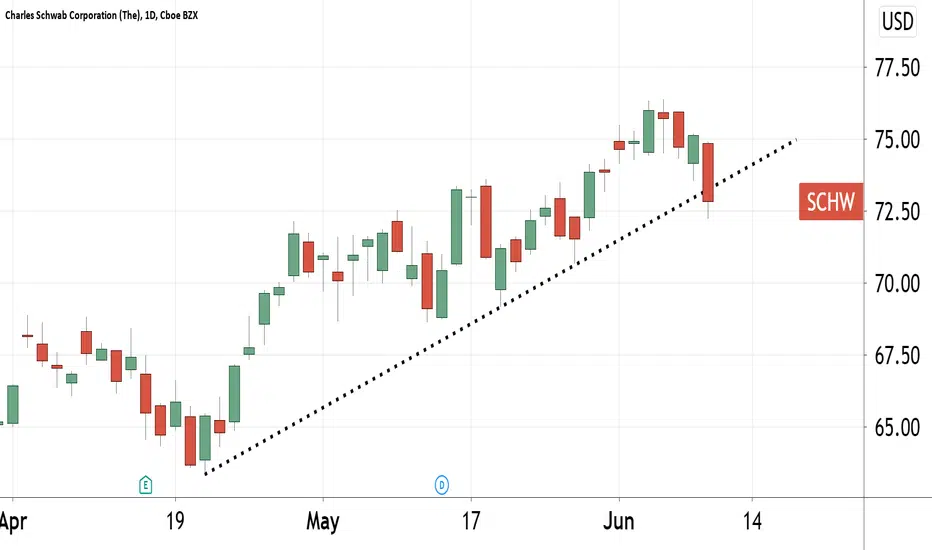
$SCHW - adding to watchlistTrend if your friend as they say. Keeps honoring the 20ma with a bounce. Will look for it to touch 20ma again for potential entry point.
$SCHW with a neutral outlook following its earnings releaseThe PEAD projected a neutral outlook for $SCHW after a positive over reaction following its earning release placing the stock in Drift B
If you would like to see the Drift for another stock please message us. Also click on the Like Button if this was useful and follow us or join us.

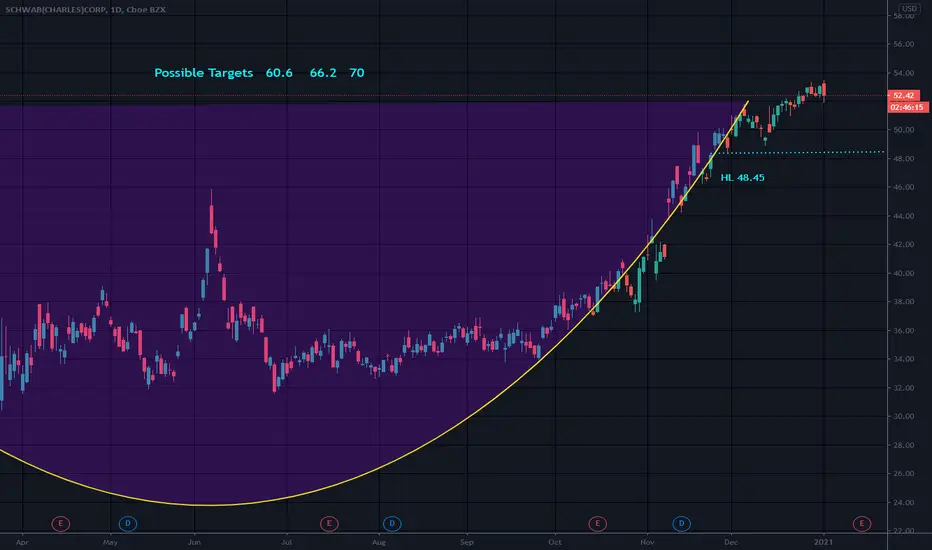
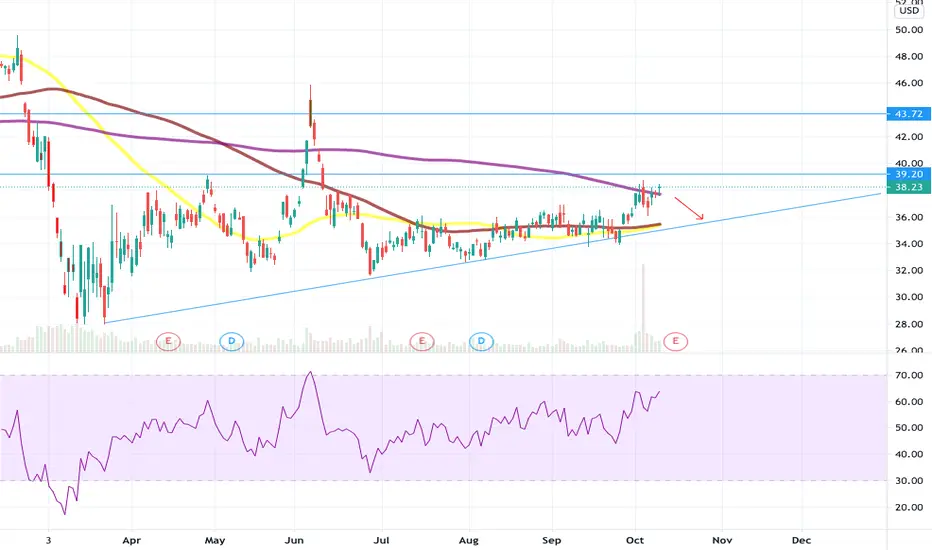
Cup and HandleJust over long entry level
Support at handle low/HL and mid cup which is 39.8..
Cup low is 28 and cup depth is 23.65.
Targets are calculated using cup depth and added to long entry level using fib levels. Cup depth is calculated using the high of the cup. Long entry level is usually placed right over the former high to clear resistance that
Not a recommendation
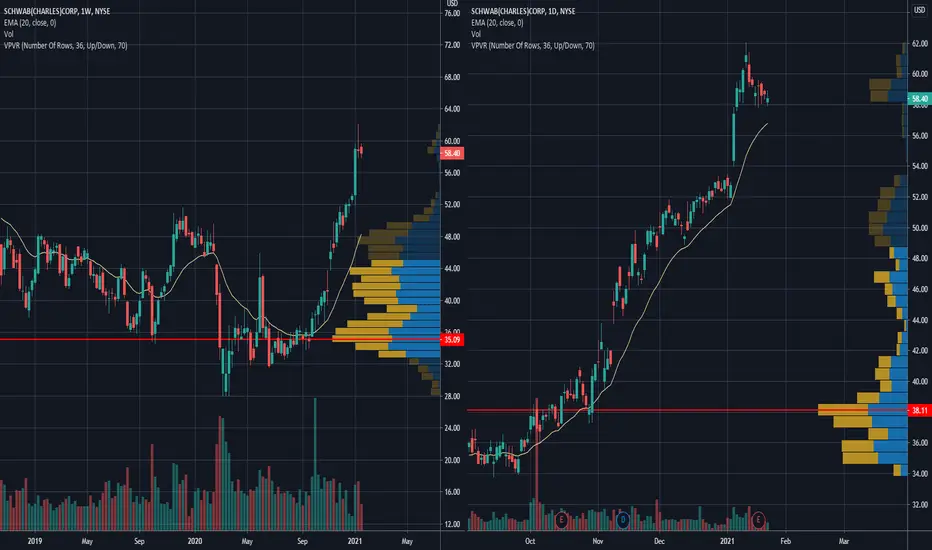
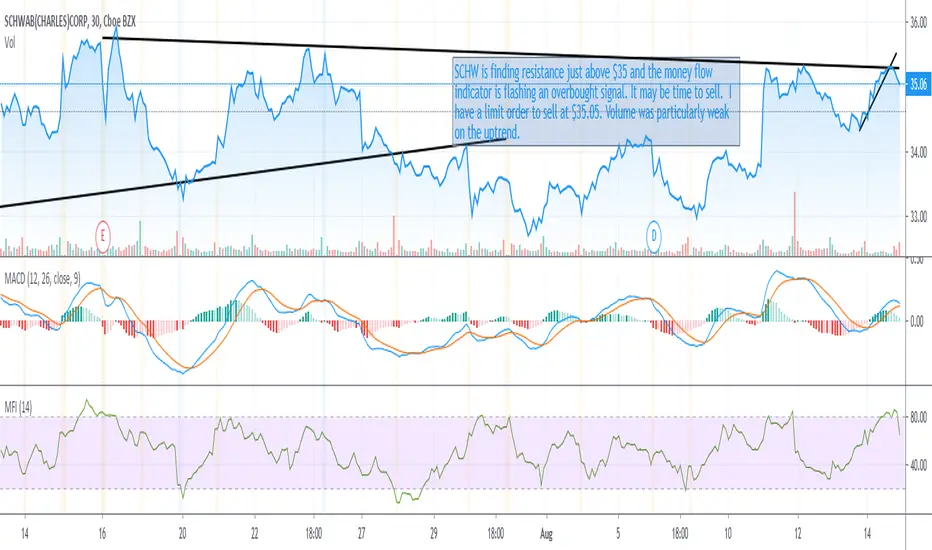
$SCHW technical short analysisDo agree with PivotBoss that this stock has some kind off resistance around 51$

another range bound play?i think its at a big resistance here on the daily, i could be wrong! but id look for a dip around 35, goodluck :)
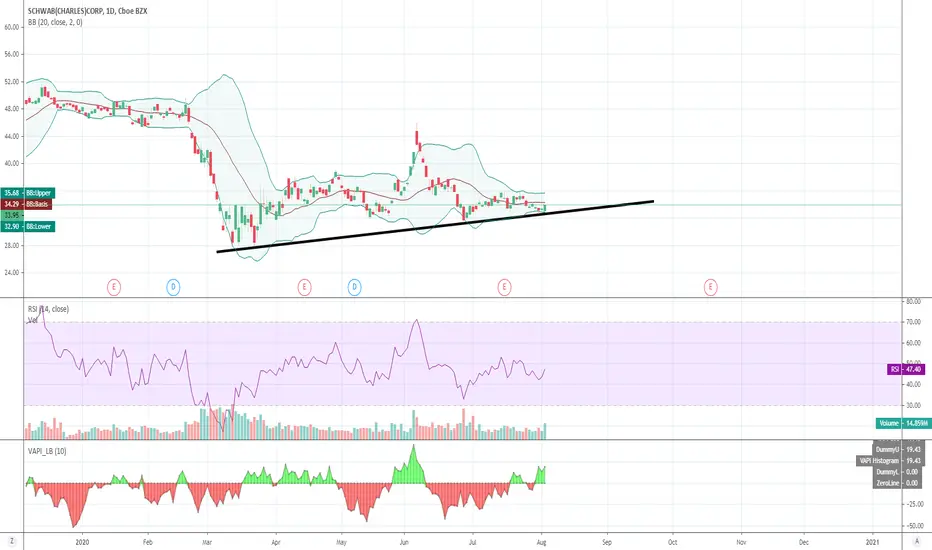
SCHW Double BottomPicked up some $SCHW at $33.14. Frankly, I do not have full conviction in this trade. The SMA are screaming a sell. But it seems like the stock hit double bottom and is trading near the lower price range on the Bollinger Bands.
On the fundamental side, there's a lot of competition in the brokerage industry but with $4 Trillion in assets $SCHW may be a survivor.

@SCHW - BUY based on CCI 20 Close (-172.66)Buy Only for this One...
@SCHW
Estimated EPS USD 0.51
Last EPS USD 0.58
Last Dividend USD 0.18