Ethervista · Recovery & Bullish WaveIt seems like September 2025 will be a great month to be in Crypto. That is really good.
Good afternoon my fellow Cryptocurrency trader, I hope you are having a very nice, wonderful, day.
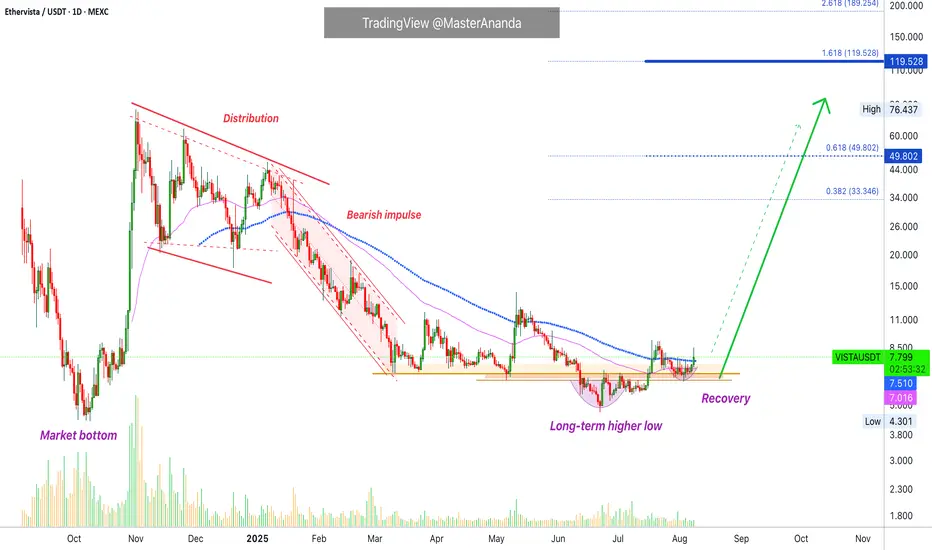
The project is called Ethervista. The ticker is VISTAUSDT for this trading pair. We have an interesting chart setup, one that is strong. One that looks better than most of the recent ones because the next advance is already confirmed.
VISTAUSDT is trading above EMA55 and moving above EMA89 today. The break above EMA89 is happening after two strong rejections; one in May and the other one in July. Both times VISTAUSDT failed to conquer this level as resistance. Now that things are changing, EMA89 as resistance is no more. This is the blue dotted line on the chart.
This was the most important resistance to break. With the action happening above, we have a bullish bias fully confirmed. When a trading pair moves above this indicator on the daily timeframe, with market conditions as they are now, it means a bullish breakout can happen anytime. Even tomorrow or today. It can also extend a bit longer but on this zone advances tend to be fast and strong. This is no longer an accumulation zone but more like a free zone, where large price swings are possible and with a bullish market these things favor the upside.
The bearish impulse ended in March producing a major low. After VISTAUSDT moved lower to produced a lower low in June, now it has fully recovered. This recovery supports all the bullish signals mentioned before.
Oh! and there is a long-term higher low because the market bottom happened in October 2024.
Thank you for reading.
Namaste.
VISTAUSDT trade ideas
VISTA/USDT, ETHERVISTA, 1D, 1Whello,
2 time frame patterns.
It's just my point of view.
Not a financial or crypto advisor.

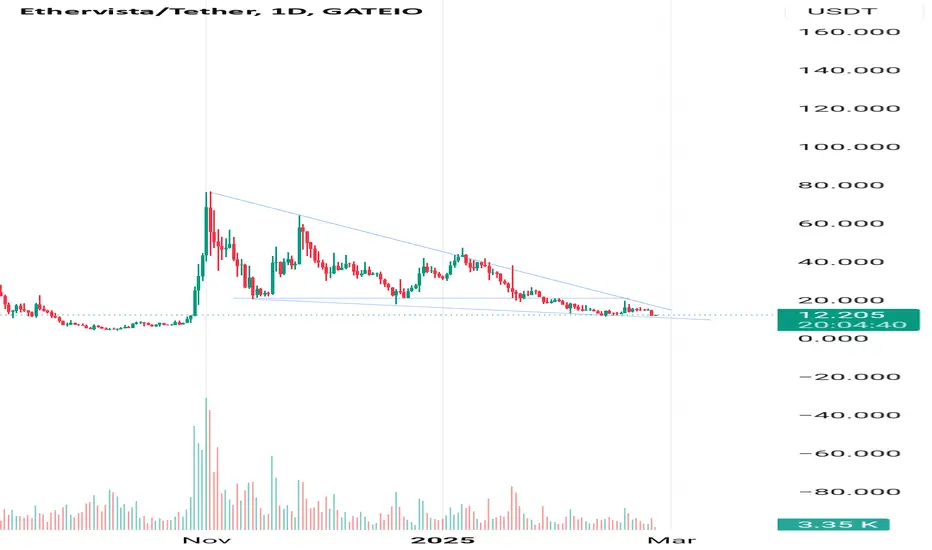
"Uptrend Expected or Potential for Lower Lows"With the breakout of the descending triangle's ceiling and consolidation above 21, along with an increase in trading volume, an upward trend is expected to begin. Otherwise, considering the overall state of the crypto market, lower lows are anticipated. This analysis is not a buy or sell recommendation.
ViSTA (EtherVista) $6.50 | the Good Stuff in the Dex sectortheres Pump.Fun Four.Meme MintLater Cointools etc and many other platforms that lets you create, package, mint your own super coin be it meme or any other project you can imagine
this one gives me that UNiSWAP vibes look feel
a dex with a memetic design and retro roloblox pixelized jurasic GUi etc yet
capture OGs and maybe fresh players to give it a look
initial run up made 50x and ARTIFICIALLY DEPRESSED while application features and iNCENTIVES are being setup for release.
Depressed for accommodation for real money to hop on
Playout: Could be at par with DyDX
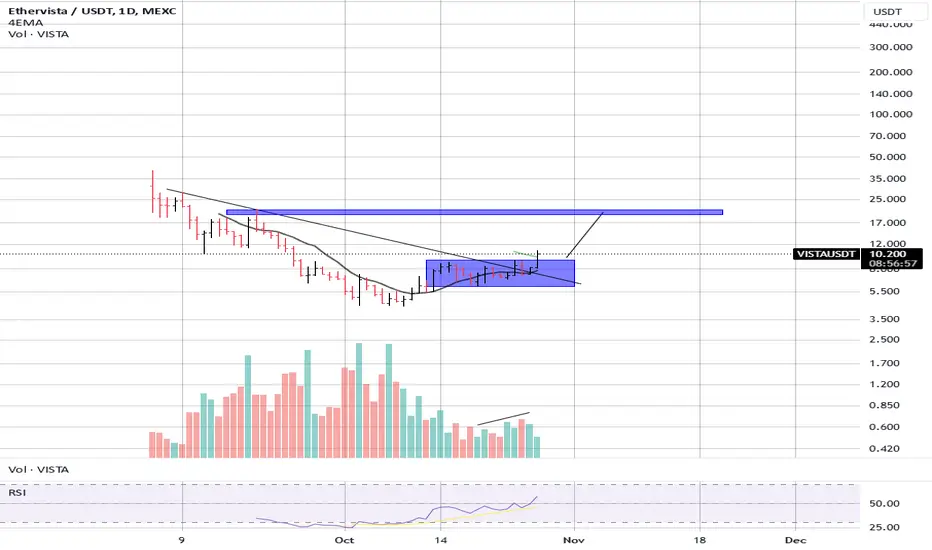
VISTA - Cup&Handle lead to a possible explosion?$VISTA is the native currency of the Ethervista DEX, with a capped supply of 1 million tokens. Ethervista is a value-compounding deflationary token.
Could this tokenomics lead to a potential strong upward movement?
this coin is breaking the 10$ price level, where it could have a massive up side potential.
seen that we have our possible first potential target around 20$, and if the volumes mantain this growth in relationship with the price, we could see that coin fly very high..
If you like and you want to comment, feel free to do so :-)
stay tuned
good trading
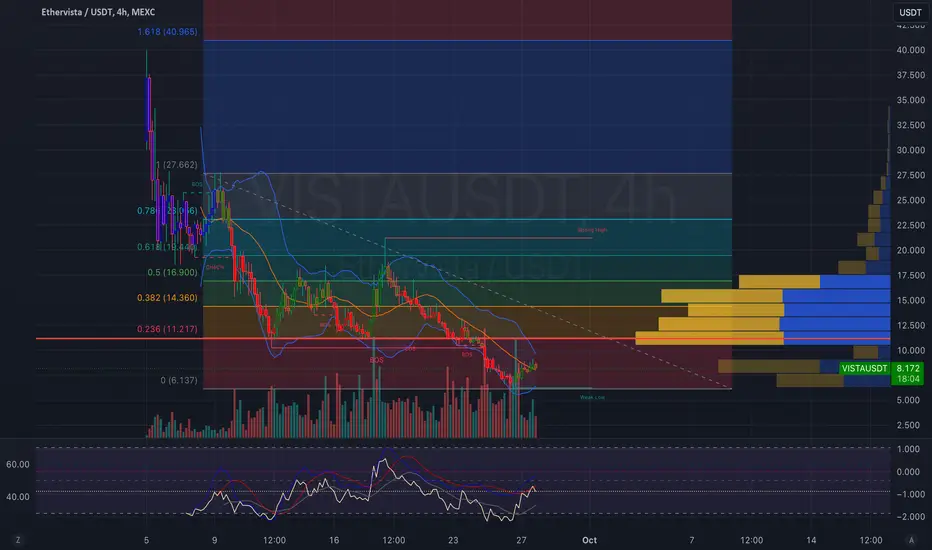
VISTA Analysis Ethervista (VISTA/USDT) trading pair on the 12-hour timeframe. Building upon observations, here is an updated technical analysis:
Price Trend and Market Structure:
Downtrend Confirmation: The asset is in a confirmed downtrend, characterized by lower highs and lower lows. This suggests that sellers have been in control for an extended period.
Break of Structure (BOS): The recent break below key support levels indicates a continuation of bearish momentum. This BOS reinforces the downtrend and suggests that any bullish moves may be short-lived unless significant support is found.
Support and Resistance Levels:
Immediate Support: The price is approaching a significant support zone around the $8 level. This area has historically acted as a floor, preventing further declines. A strong bounce from this level could signal a potential reversal or consolidation phase.
Immediate Resistance: Overhead resistance lies between the $10 and $12 levels. This zone coincides with previous swing highs and areas of high trading activity, as indicated by the volume profile. Breaking above this resistance would be a bullish signal but may require substantial buying pressure.
Technical Indicators:
Moving Averages (MA): The price is interacting with a key moving average (likely the 50-period MA on the 12-hour chart). The downward slope of the MA confirms the bearish trend. A sustained move above this MA could indicate a shift in momentum.
Relative Strength Index (RSI): The RSI is hovering around 40, suggesting weak momentum but not yet in oversold territory. This leaves room for the price to decline further before reaching levels typically associated with reversal patterns.
Bollinger Bands: The bands are widening, indicating increased volatility. The price attempting to move above the middle band could be an early sign of bullish momentum, but confirmation is needed.
Volume Analysis:
Volume Spikes: Recent increases in trading volume (green volume bars) suggest heightened market interest at current price levels. This could be institutional buying or short covering, which may lead to a temporary price stabilization or rebound.
Volume Profile: The volume profile shows significant trading activity in the $10-$12 resistance zone, indicating strong interest from market participants. Below the current price, the volume drops off, suggesting that if the $8 support fails, the price could rapidly decline to the next major support around $5.
Potential Scenarios:
Bullish Scenario:
Support Hold and Reversal: If the $8 support level holds and the price breaks above the moving average and the $10-$12 resistance zone with strong volume, this could signal the beginning of a bullish reversal.
Increased Buying Pressure: Sustained high volume on upward moves would reinforce the bullish case, indicating strong buying interest.
Bearish Scenario:
Support Failure: A decisive break below the $8 support level could accelerate the downtrend, pushing the price toward the next significant support at $5.
Continuation of Downtrend: If bearish volume increases and the price remains below key moving averages, the downtrend is likely to continue.
Ethervista (VISTA/USDT) is at a critical juncture. The $8 support level is crucial for bulls to defend to prevent further declines. Traders should watch for confirmation signals such as a break above key moving averages and resistance levels, accompanied by strong volume, to consider a potential trend reversal. Conversely, a failure to hold support may present short opportunities but also increases the risk of accelerated losses.
Buupward movement
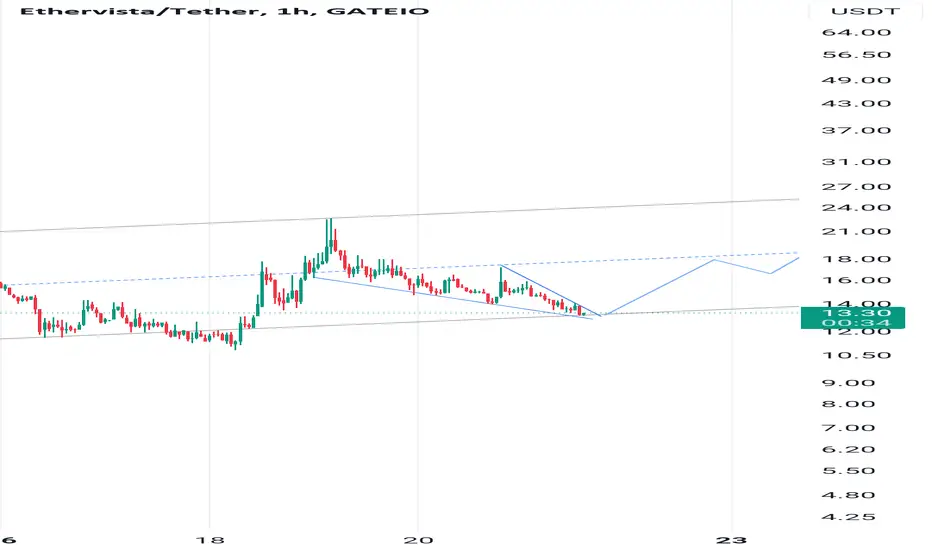
It seems that the price can start the second wave from here to the ceiling of the channel
Please check for yourself and do not enter into a transaction with this information.