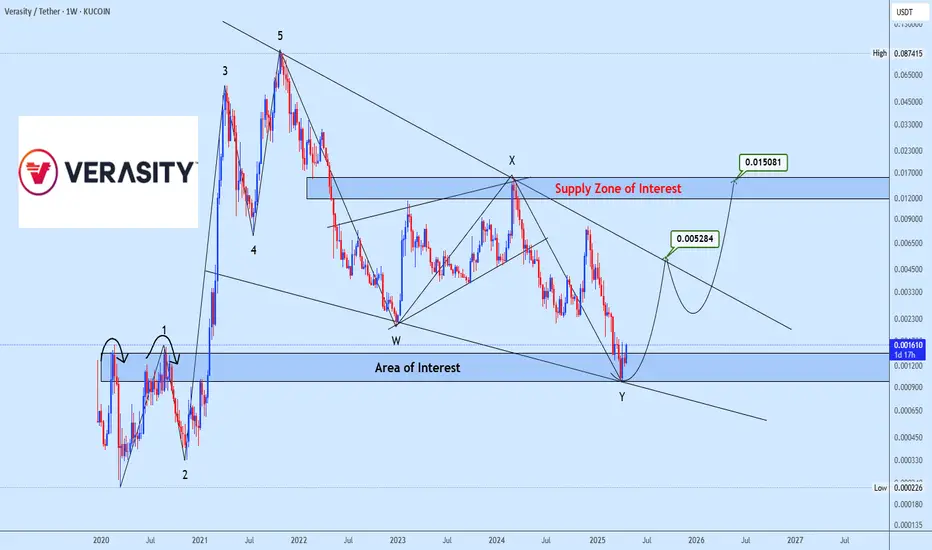
VRAUSDT correction is done time to flyVRAUSDT is presenting a clear completion of a WXY corrective structure into the defined Area of Interest, offering a potential re-accumulation opportunity. Price is currently reacting from the major demand zone with initial upside targets around 0.005284 and a secondary target aligning with the Supp
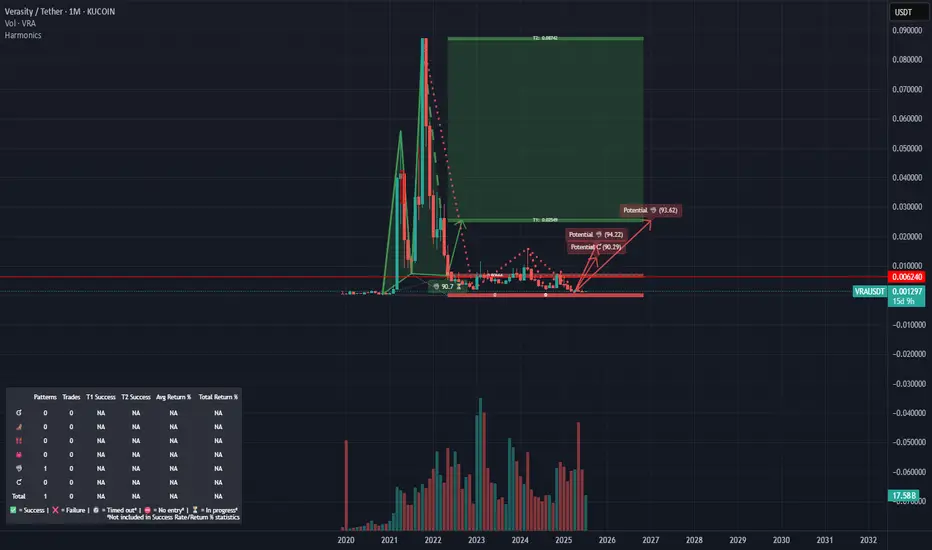
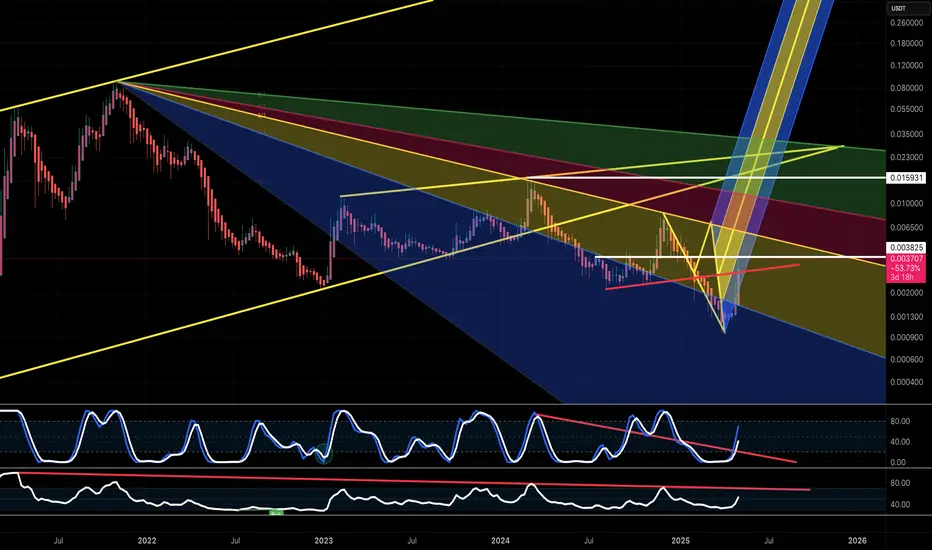
VRA1M chart shows harmonic pattern to 8 cents. Looks like a good time to get in if you believe in alt season
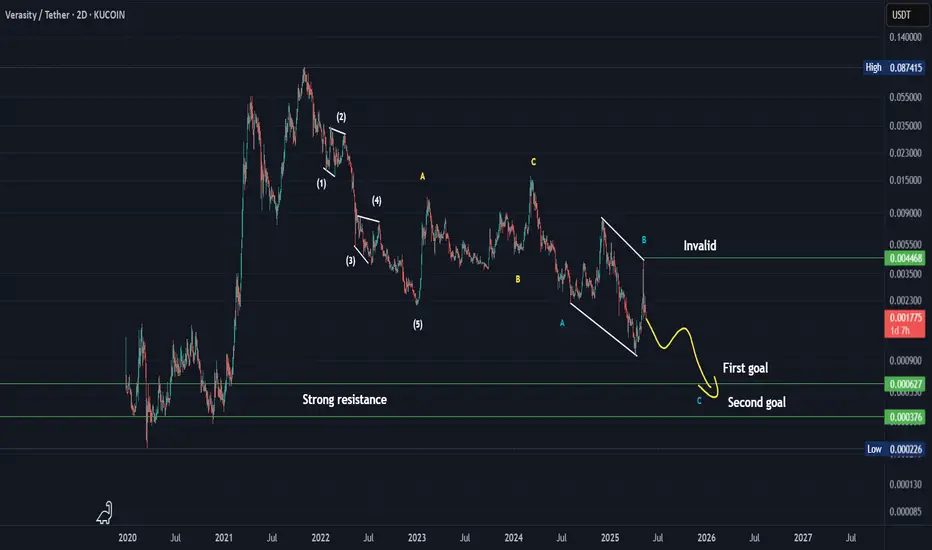
Continue analysis on VRACompleting my analysis of this currency from a year ago, we find that it has actually fallen, and according to the new data that has appeared, a triple flat has been formed, and a new strong fall to the area below is expected, and all the data is shown on the chart.
*In principle, I am not a support
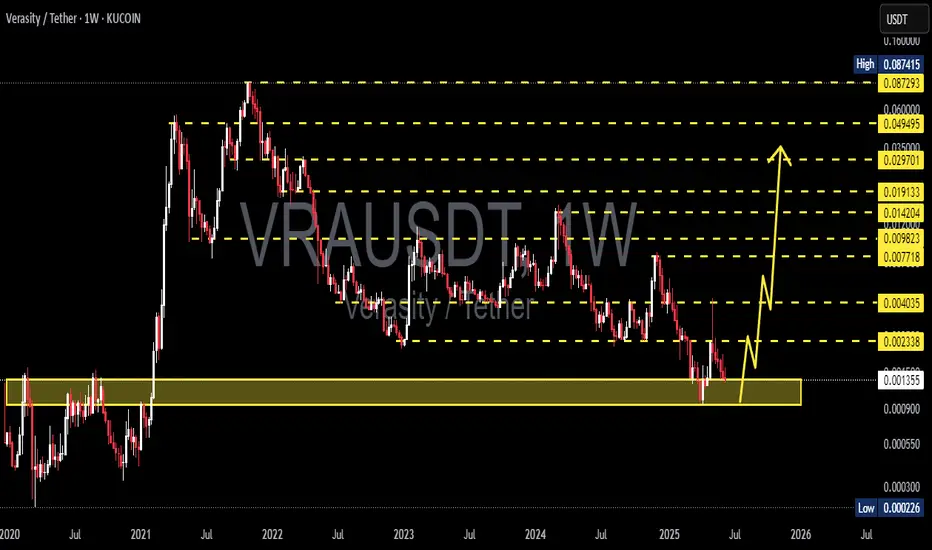
VRAUSDT 1W AnalysisVRA ~ 1W Analysis
#VRA Buy back gradually from here if you still have confidence in this coin with a short-term target of at least 20%++ from this support block.
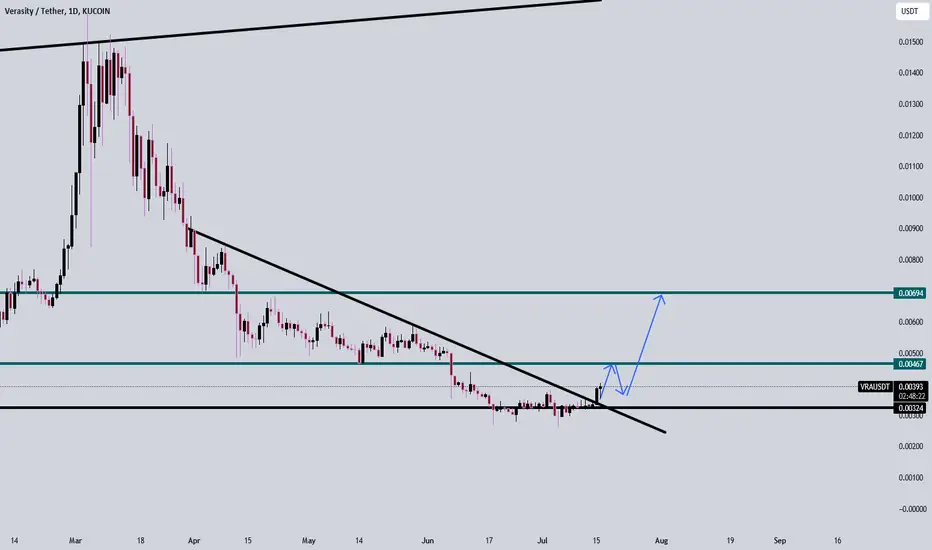
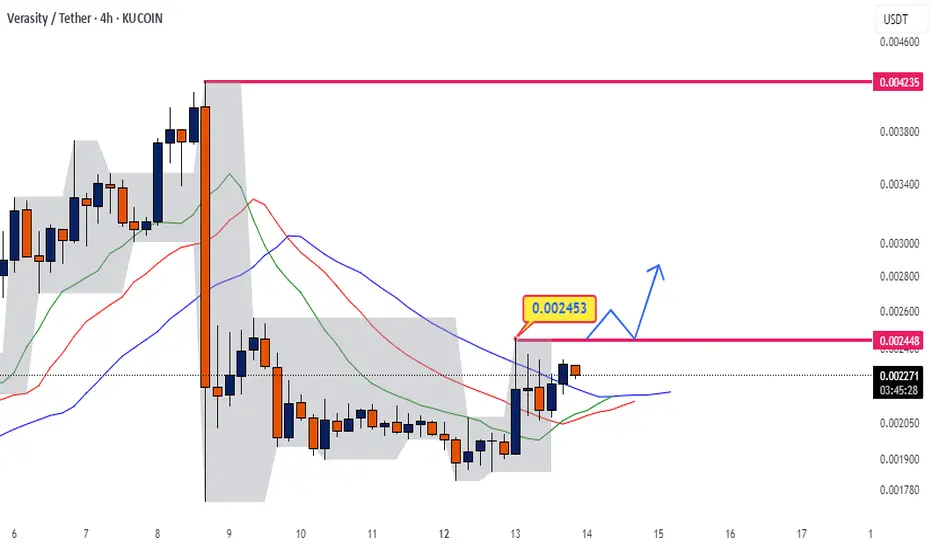
bullish??If it consolidates above the 0.00245 fractal, it has the potential to grow to the next high.
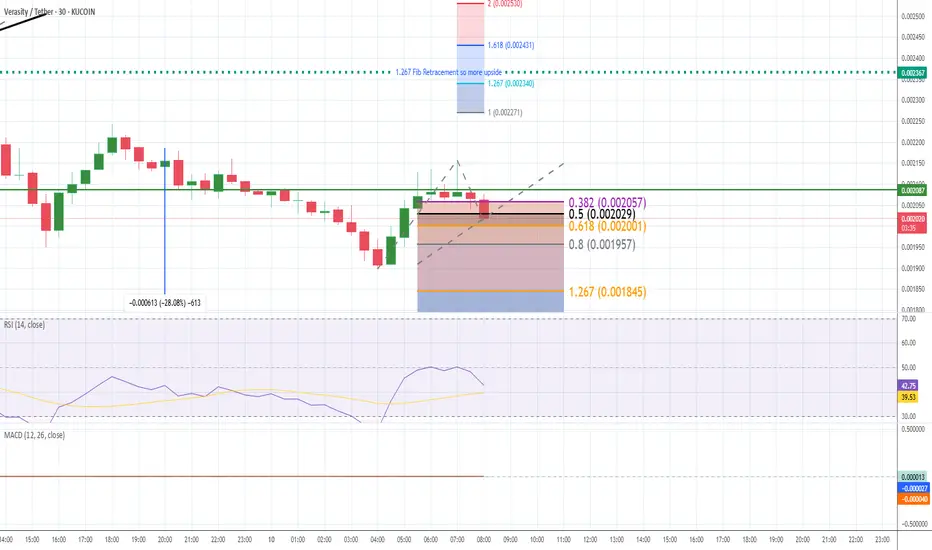
My VRA 15 minThe VRA/USDT chart displays a strong bullish structure following a clean bounce from the 1.618 Fibonacci extension, likely marking the end of Wave C. The price has reclaimed the 1.267 Fib level and is forming higher lows, indicating a potential start of Wave 3. RSI remains above its moving average,
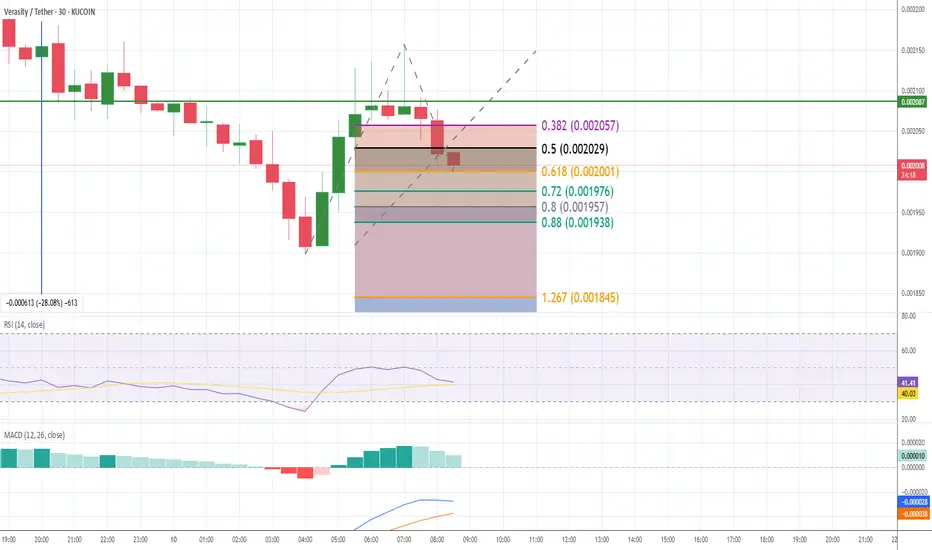
My VRA 1 hr chartThe VRA/USDT chart displays a strong bullish structure following a clean bounce from the 1.618 Fibonacci extension, likely marking the end of Wave C. The price has reclaimed the 1.267 Fib level and is forming higher lows, indicating a potential start of Wave 3. RSI remains above its moving average,
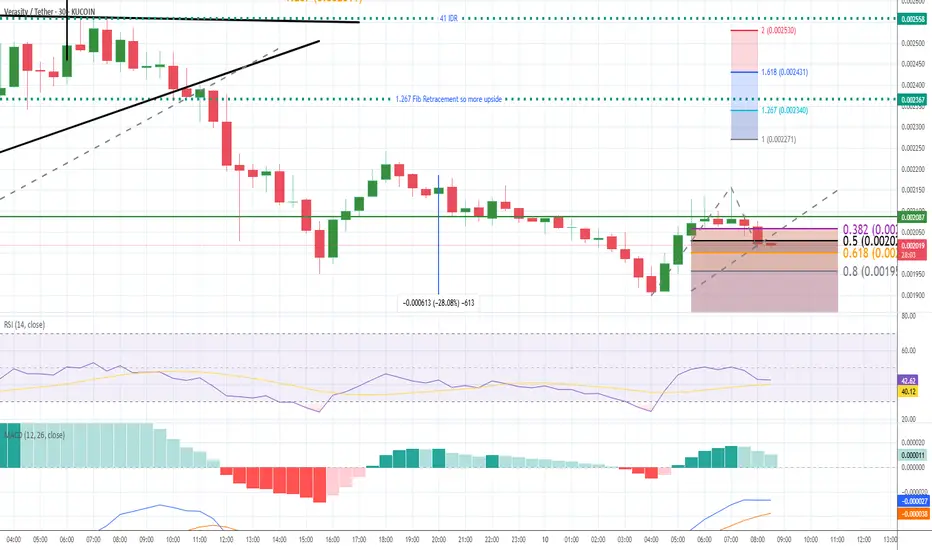
VRA ChartThe VRA/USDT chart displays a strong bullish structure following a clean bounce from the 1.618 Fibonacci extension, likely marking the end of Wave C. The price has reclaimed the 1.267 Fib level and is forming higher lows, indicating a potential start of Wave 3. RSI remains above its moving average,
Verasity $VRA crypto chart🟩🟩🟩🟩🟩🟩🟩🟩
🥃 #VRA PUMPING
🚀🚀🚀🚀🚀🚀🚀🚀🚀🌔✨
STILL A LONG WAY TO GO YET.
If you bought the lows on this, you’d making plenty. tradingview.sweetlogin.com
🟩🟩🟩🟩🟩🟩🟩🟩
See all ideas
Summarizing what the indicators are suggesting.
Oscillators
Neutral
SellBuy
Strong sellStrong buy
Strong sellSellNeutralBuyStrong buy
Oscillators
Neutral
SellBuy
Strong sellStrong buy
Strong sellSellNeutralBuyStrong buy
Summary
Neutral
SellBuy
Strong sellStrong buy
Strong sellSellNeutralBuyStrong buy
Summary
Neutral
SellBuy
Strong sellStrong buy
Strong sellSellNeutralBuyStrong buy
Summary
Neutral
SellBuy
Strong sellStrong buy
Strong sellSellNeutralBuyStrong buy
Moving Averages
Neutral
SellBuy
Strong sellStrong buy
Strong sellSellNeutralBuyStrong buy
Moving Averages
Neutral
SellBuy
Strong sellStrong buy
Strong sellSellNeutralBuyStrong buy
Displays a symbol's price movements over previous years to identify recurring trends.