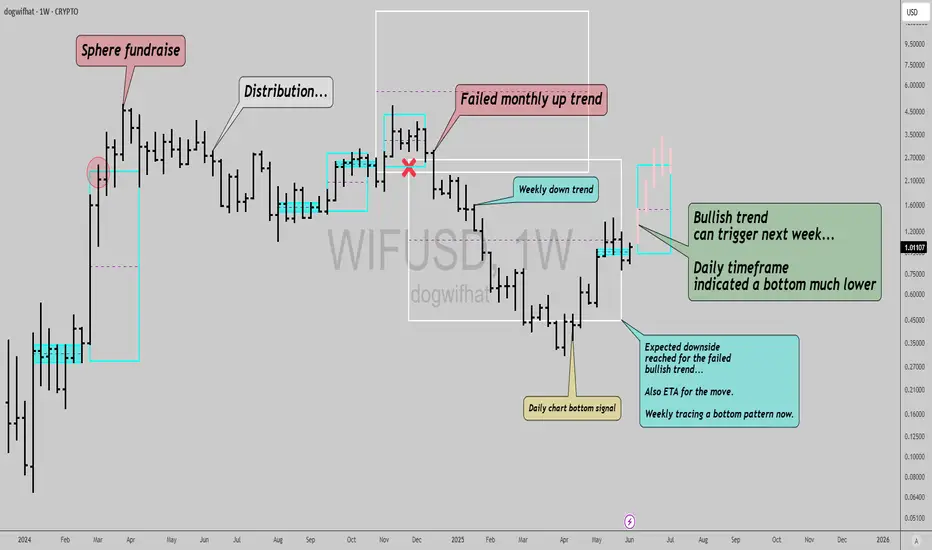
Update on $WIF price actionSEED_WANDERIN_JIMZIP900:WIF has been a disaster since the Sphere top signal, but recently it formed a bottom pattern alongside other liquid memes, listed at futures platforms like Hyperliquid.
I trade these memes actively myself and have caught the up trend since the daily bottomed.
Now a larger w
Trading activity
Transactions 3.53 K
BuysSells
1.32 K2.21 K
Volume 1.12 MUSD
Buys volumeSells volume
491.39 K633.46 K
Traders 1.01 K
BuyersSellers
269739
DOGWIFHAT LONG SETUP ALL trading ideas have entry point + stop loss + take profit + Risk level.
hello Traders, here is the full analysis for this pair, let me know in the comment section below if you have any questions, the entry will be taken only if all rules of the strategies will be satisfied. I suggest you keep thi
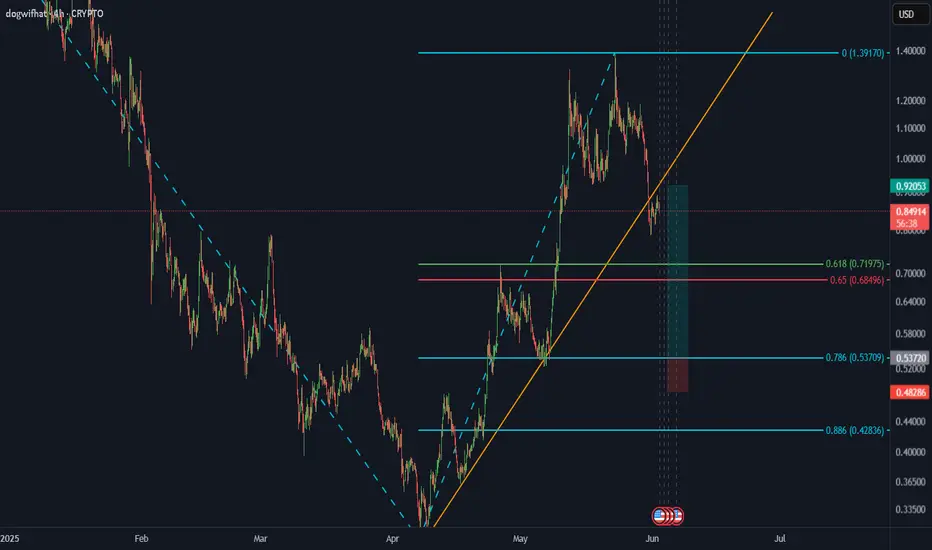
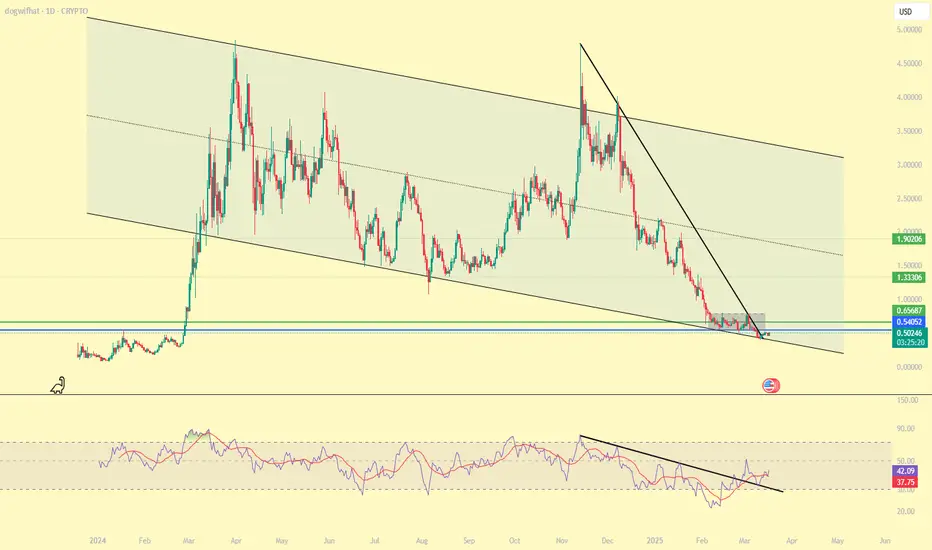
$WIF: Uptrend signal activeNice signal in SEED_WANDERIN_JIMZIP900:WIF here, the trend in the daily timeframe has been bullish since April 18th, and has been giving us multiple continuation signals to trade in and out, or scale in with low risk as we move the stop higher if playing it longer term.
If prices hold above recen
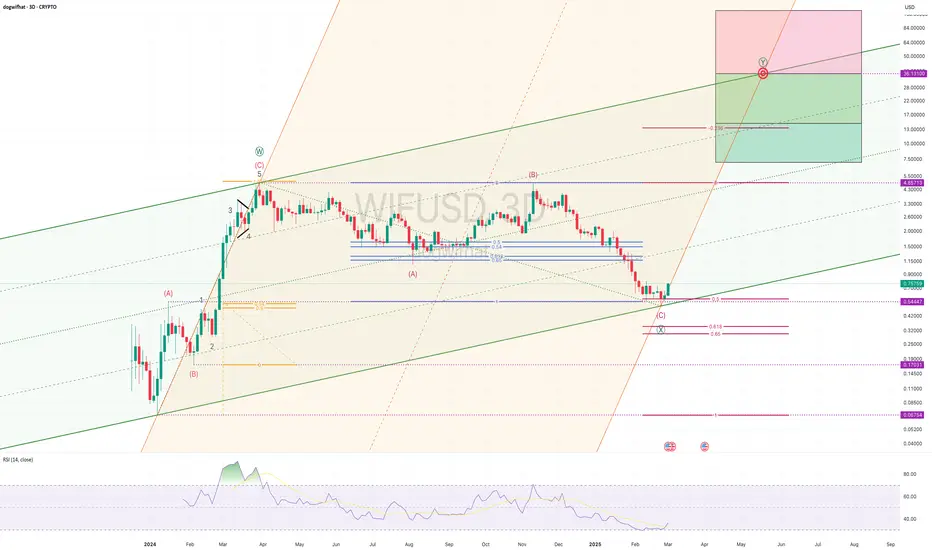
Possible 5th Elliott wave, followed by a correction.If the assumption holds, support at the 0.5 to 0.6 Fibonacci level can be a good indicator of the continuation of the uptrend. However, this is contingent on a global bullish narrative.

WIF bouce?WIF
On the techincal side, WIF held the 1.4-1.6 range, taking in consideration the elliot wave count (C), final.
RSI showing strength, BO already.
High probability play to the 0.618 or IMB lvl 2.10 +-.
NFA
WIF/usdtSame setup as most memes. RSI structure is ready. Got bullish divergence. Price came back down to mitigate most to all imbalances. I am DCA in here....
WIF - DEEP Positional EntryWIF #108
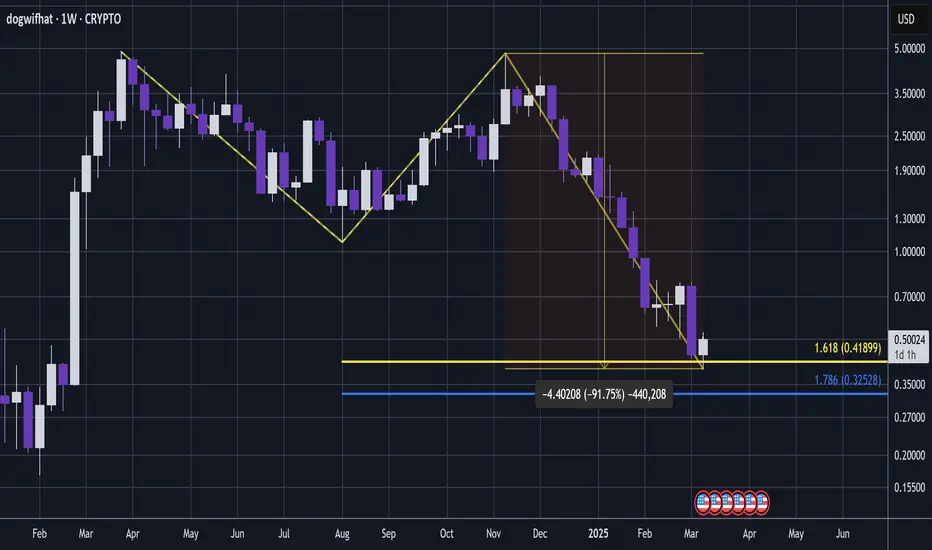
Meme coins have been decimated since November and dogwifhat was recently down a whopping 92% since November high.
This coin was a pump chaser favourite this time last year and if it pumps again then it could yield significant multipliers from down here.
It recently had a small bounce fro
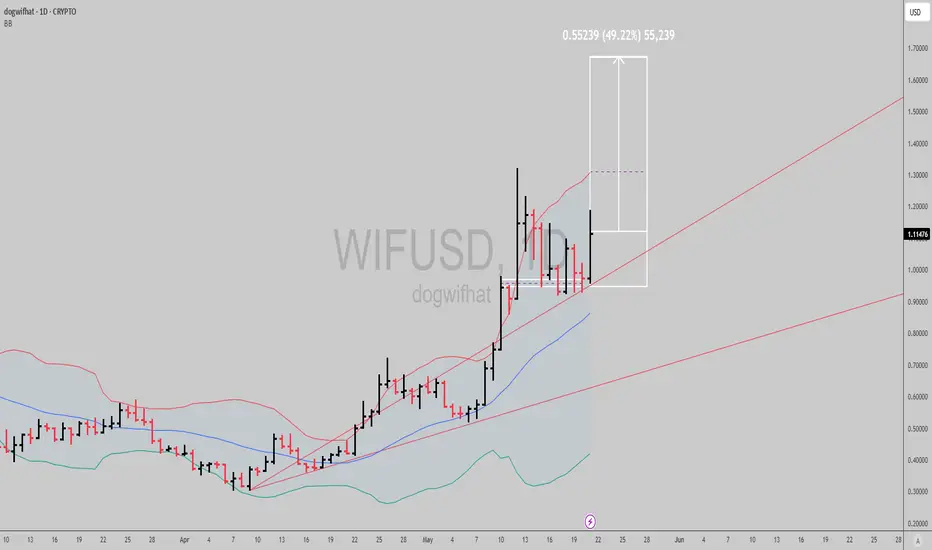
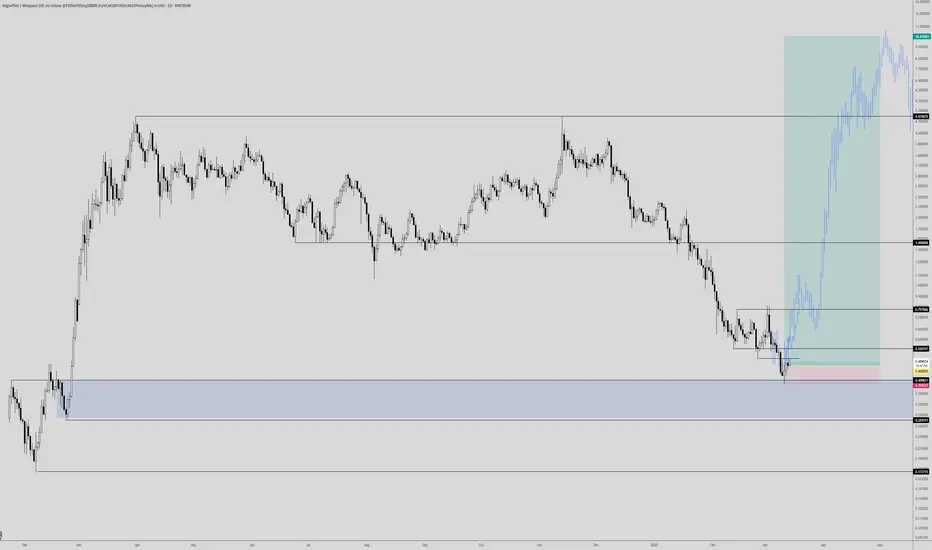
WIF is ready for a comeback!!! $10 in 2025A long now in BINANCE:WIFUSDT.P with stop loss at the lows and with the idea that it will claim the key value of $0.55 in the next few days.
Next important level 0.8, then if it reclaims 1.5 we are on our way to new highs.
Massive RR
-If it makes new lows we probably have to wait for another c
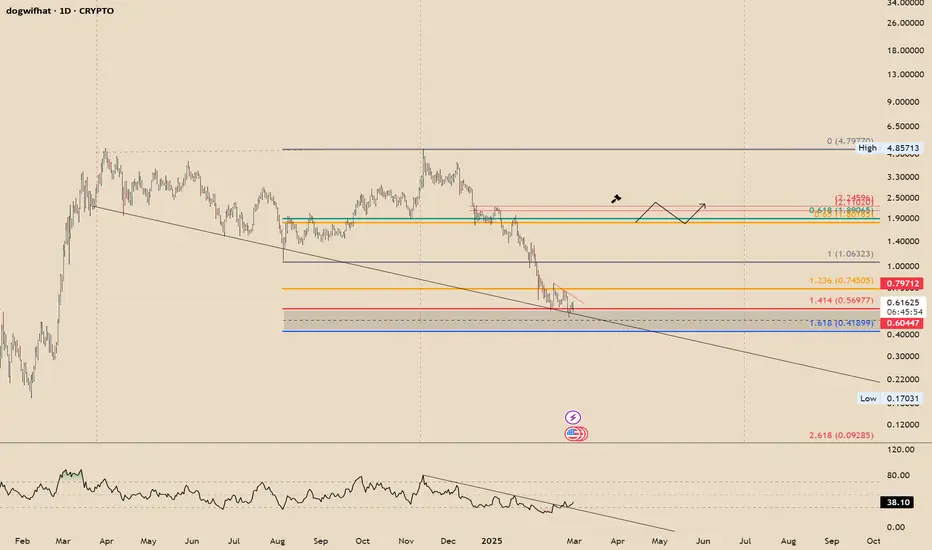
WIF/USD * Daily TF EWP TC FIB AnalysisAnalysis of WIF/USD Chart Using Elliott Wave Theory
1. Elliott Wave Count & Structure:
The chart follows a clear Elliott Wave multi zigzag structure.
The impulse wave peaked at around $4.86, marking a significant high.
The correction followed in a three-wave ABC structure, which seems to have foun
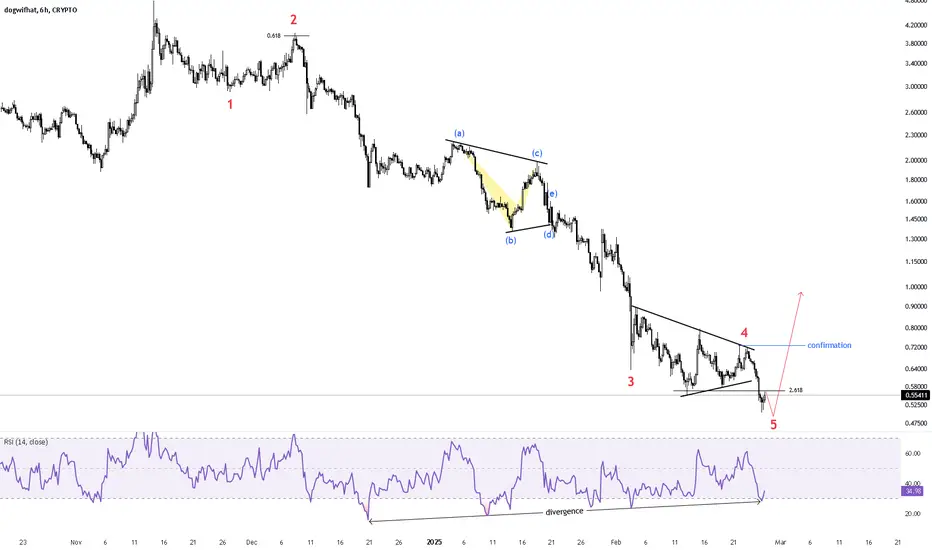
WIF update#WIF made a drop like other coins but this coin is underrated ! i think it can make a huge rise when the price crosses the confirmation line as we have 5 elliot waves down
See all ideas
Summarizing what the indicators are suggesting.
Oscillators
Neutral
SellBuy
Strong sellStrong buy
Strong sellSellNeutralBuyStrong buy
Oscillators
Neutral
SellBuy
Strong sellStrong buy
Strong sellSellNeutralBuyStrong buy
Summary
Neutral
SellBuy
Strong sellStrong buy
Strong sellSellNeutralBuyStrong buy
Summary
Neutral
SellBuy
Strong sellStrong buy
Strong sellSellNeutralBuyStrong buy
Summary
Neutral
SellBuy
Strong sellStrong buy
Strong sellSellNeutralBuyStrong buy
Moving Averages
Neutral
SellBuy
Strong sellStrong buy
Strong sellSellNeutralBuyStrong buy
Moving Averages
Neutral
SellBuy
Strong sellStrong buy
Strong sellSellNeutralBuyStrong buy