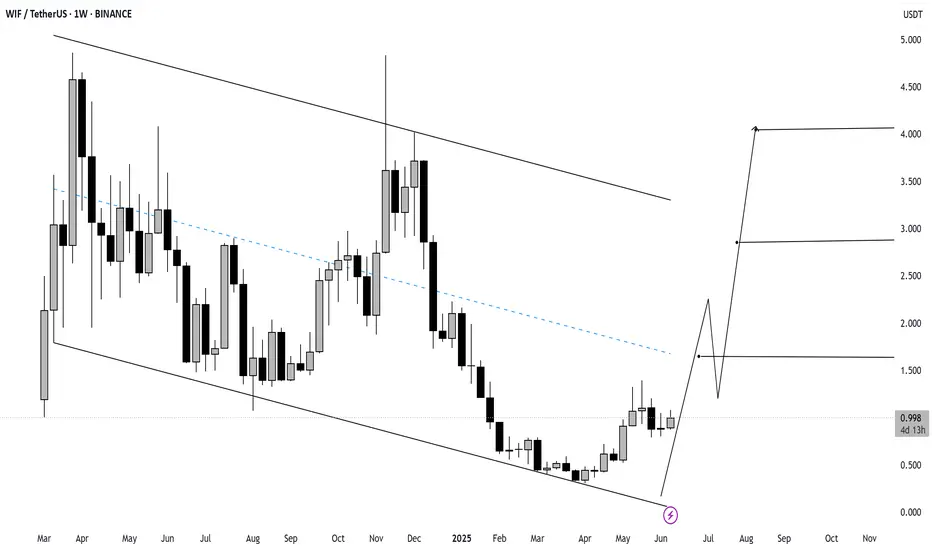
WIF/USDT Weekly Chart Analysis – June 11, 2025
The chart for WIF (Dogwifhat) on the weekly timeframe shows a bullish breakout setup emerging from a long-term descending channel. Price has bounced off the lower boundary and is now pushing higher.
🔍 Key Technical Highlights:
Current Price: $0.996
Structure: Descending channel (breakout in pro
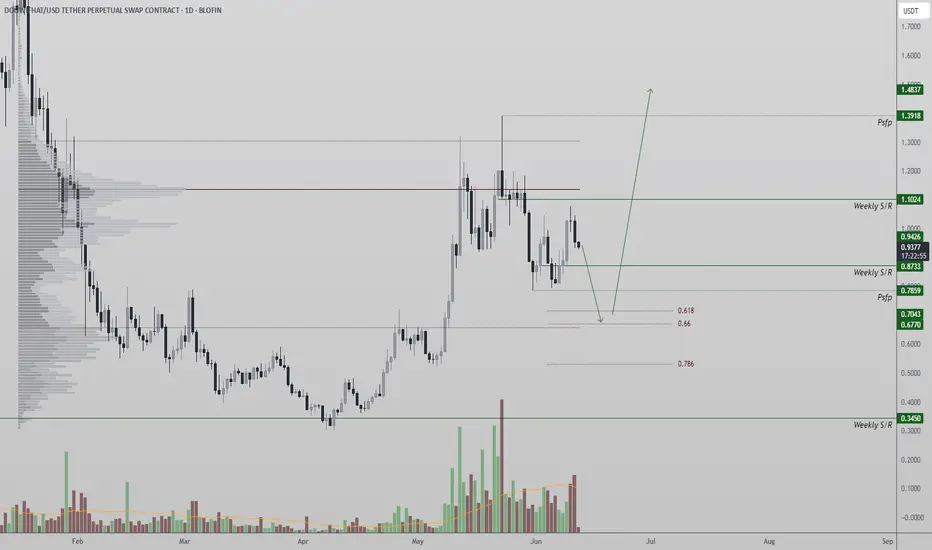
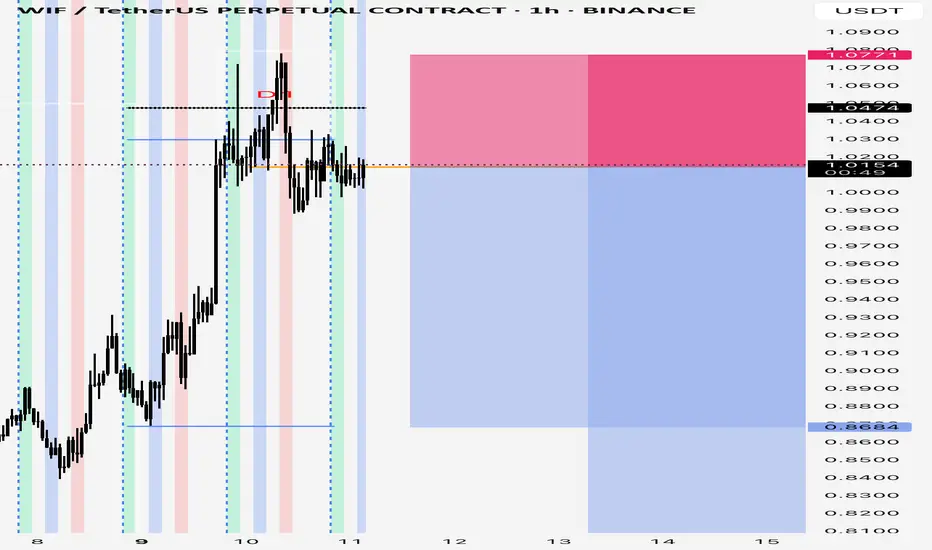
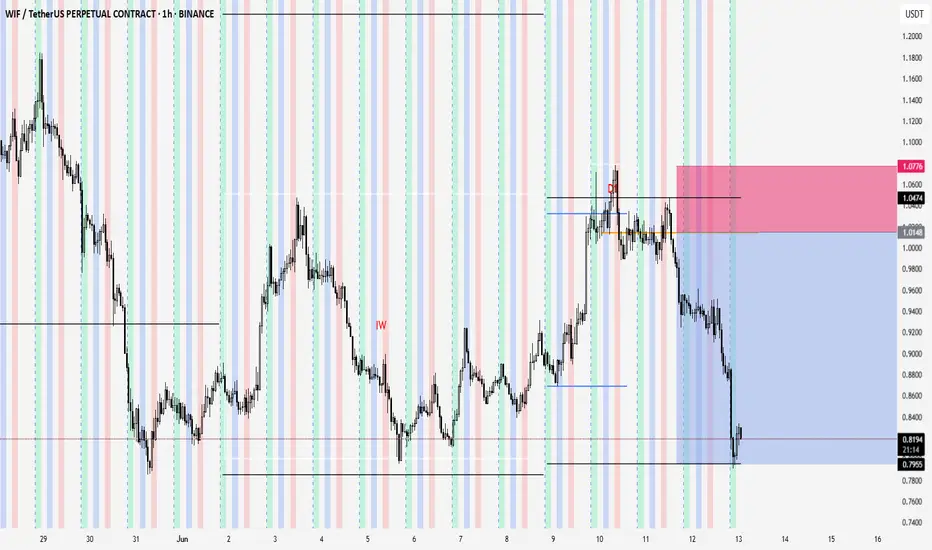
WIF Rejection at Resistance — Deeper Correction Toward $1.87 PosWIFCOIN (WIF) has rejected from a major resistance confluence, posting a swing failure pattern at the value area high. The rejection has pushed price below the point of control (POC) — a high-volume node that previously acted as support but is now flipped into resistance.
This region also included
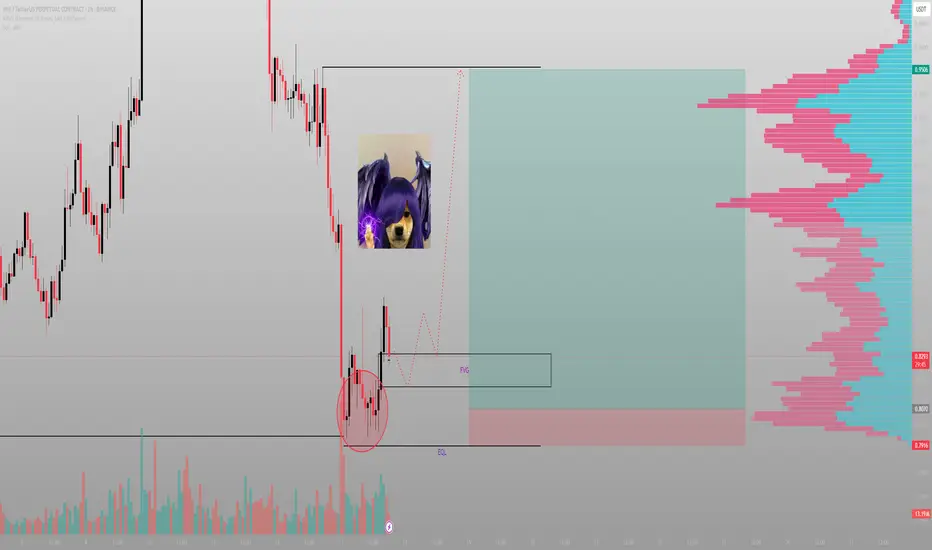
You saw a meme. I saw imbalanceWIF doesn’t need to be serious — because I am. This move isn’t about hype. It’s about inefficiency, reclaimed structure, and a clear delivery path.
The logic:
Price swept the lows and gave a clean reaction off the OB. From there, it filled the local FVG but didn’t expand — it paused. That tells me

Price collapsed. I didn’t flinch. Here’s whyThat wick didn’t scare me — it confirmed the setup. Volume spiked, price swept an equal low, and printed the reaction I was waiting for.
The logic:
Clean FVG formed on the drop
Price returned to rebalance
Reaction from that FVG confirms Smart Money intent
It’s not about chasing the reversal — it
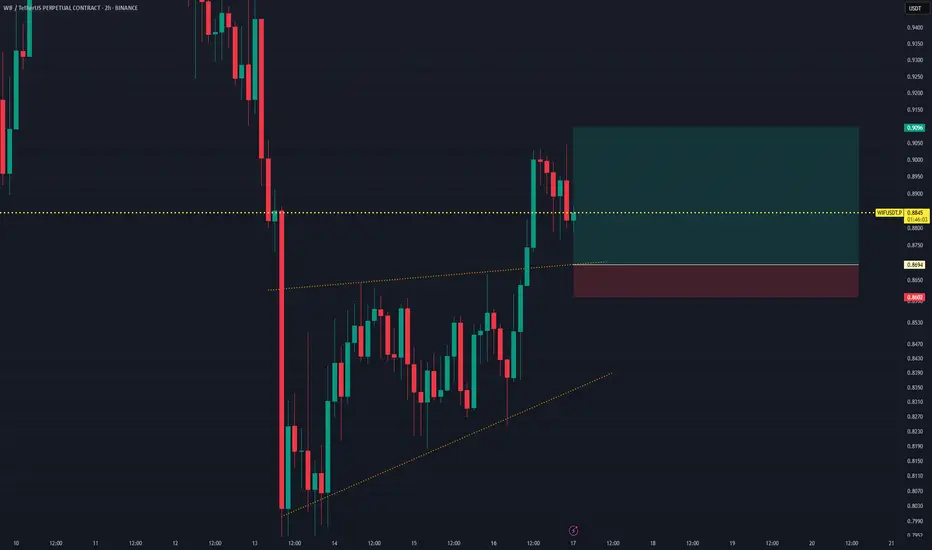
WIF 4H. Make or Break ZoneBINANCE:WIFUSDT The asset is still moving within a defined range and is now brushing against the lower boundary of its structure. This area has historically triggered buyer interest — and if that repeats, we could be looking at a recovery toward $0.97+ in the short term.
However, failure to defend
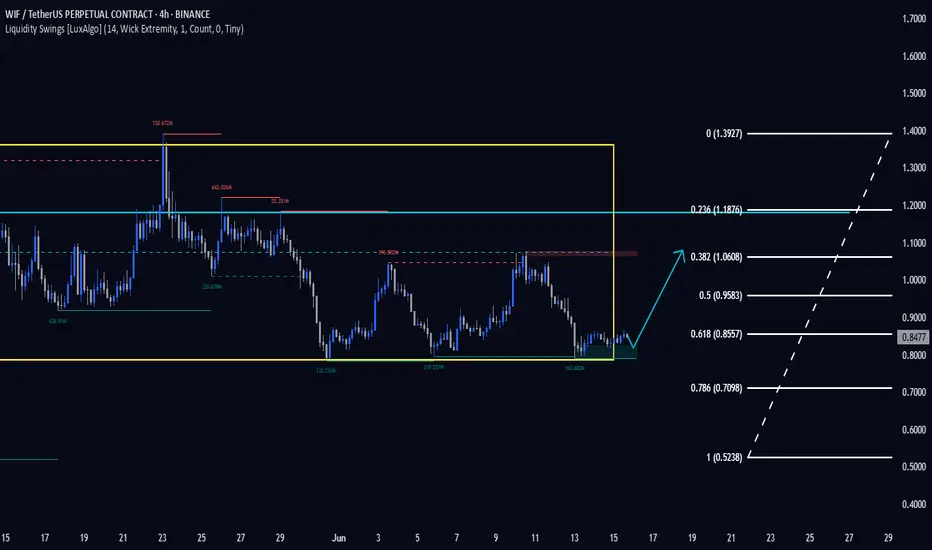
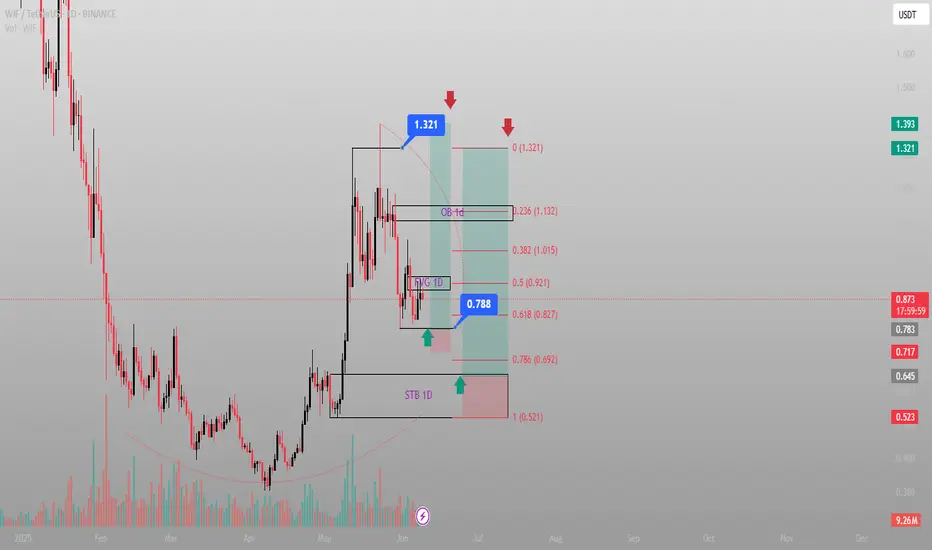
They brought it down for the fill — now it's time to see who’s rBINANCE:WIFUSDT just reacted perfectly off the 0.618 golden zone at 0.827 with bullish intent. The STB 1D and FVG 1D combo formed a high-probability demand zone that Smart Money won't ignore lightly.
Here’s the bullish roadmap:
Entry: 0.788 (bottom wick through 0.618 fib)
Structure: Clear higher
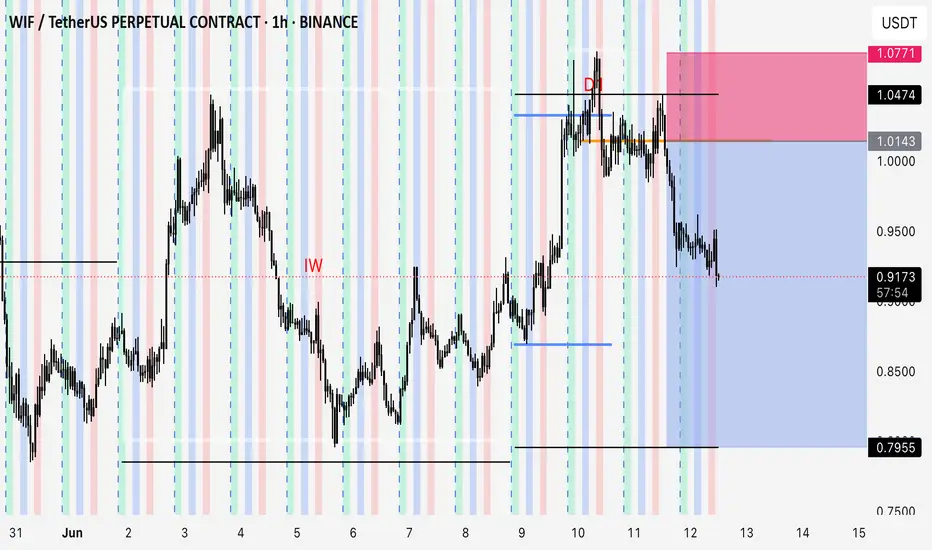
Might be a quick drop , could be 20% in this or the next weekPrevious week was inside week,this week opened up and Monday pumped to previous weeks high, then put in a false break on Tuesday, which coincide with Wednesday, the back side of the week,it was making higher low every session during the front side of the move, In Wednesday’s London session it open b
WIFUSDT Bullish Retest Setup – Breakout Confirmation EntryThis setup highlights a bullish breakout from an ascending triangle pattern on WIFUSDT. After the breakout, price pulls back and retests the former resistance line (now turned support), providing a clean entry signal with a favorable Risk:Reward ratio. The setup aims to capture further upward moveme
on the way to glorygoing to hold until the next Monday open unless it hit my tp. Not even moving my stop to break even, let it the market do what ever it wants.Inside week+ D1, back to the other side of the range
20% in the bagkey take away. inside week -> tuesday false break at the high and closing back inside monday's range-> wednesday's london session opened below the highest low among all the sessions low which in this case was tuesday's london session, then pullback into it and start to drop about 10 hr later. eight
See all ideas
Summarizing what the indicators are suggesting.
Oscillators
Neutral
SellBuy
Strong sellStrong buy
Strong sellSellNeutralBuyStrong buy
Oscillators
Neutral
SellBuy
Strong sellStrong buy
Strong sellSellNeutralBuyStrong buy
Summary
Neutral
SellBuy
Strong sellStrong buy
Strong sellSellNeutralBuyStrong buy
Summary
Neutral
SellBuy
Strong sellStrong buy
Strong sellSellNeutralBuyStrong buy
Summary
Neutral
SellBuy
Strong sellStrong buy
Strong sellSellNeutralBuyStrong buy
Moving Averages
Neutral
SellBuy
Strong sellStrong buy
Strong sellSellNeutralBuyStrong buy
Moving Averages
Neutral
SellBuy
Strong sellStrong buy
Strong sellSellNeutralBuyStrong buy
Displays a symbol's price movements over previous years to identify recurring trends.