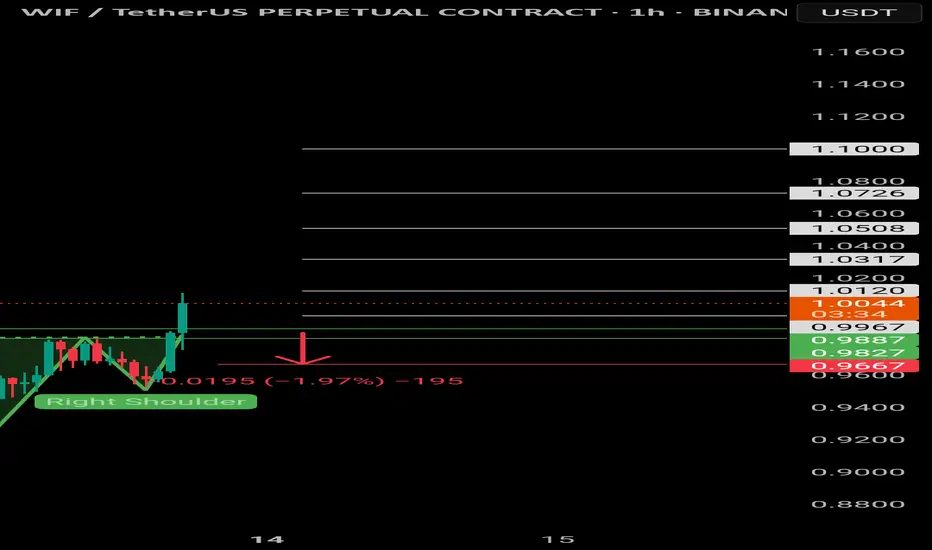
$WIF | Inverted head and shoulders $Wif/Usdt
BINANCE:WIFUSDT.P
The price is formed the Inverted head and shoulders pattern and did a breakout of the neckline, expecting the price to retest green lines (neckline).
If 1H CC hit and bounce above the green lines, it'll be a long opportunity.
Entering at current price will increase
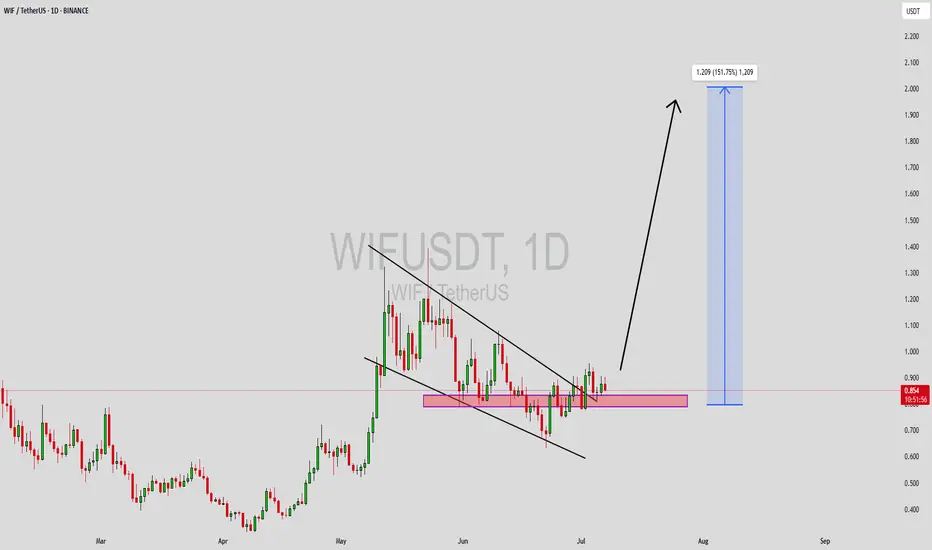
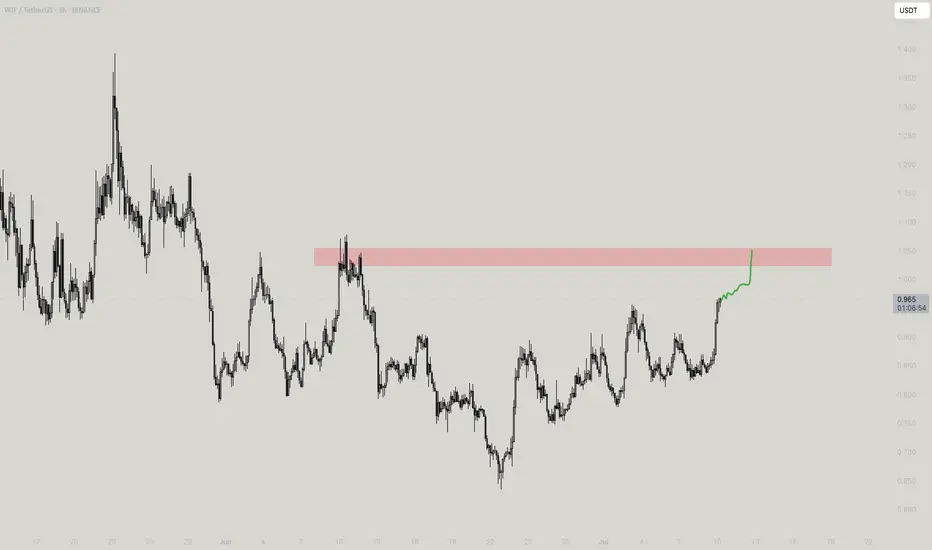
WIFUSDT Forming Breakout Descending ChannelWIFUSDT is showing an exciting technical setup as it breaks free from a prolonged downward channel and consolidates near a strong support zone. This breakout pattern signals that the coin could be on the verge of a significant trend reversal, supported by healthy trading volume and renewed investor
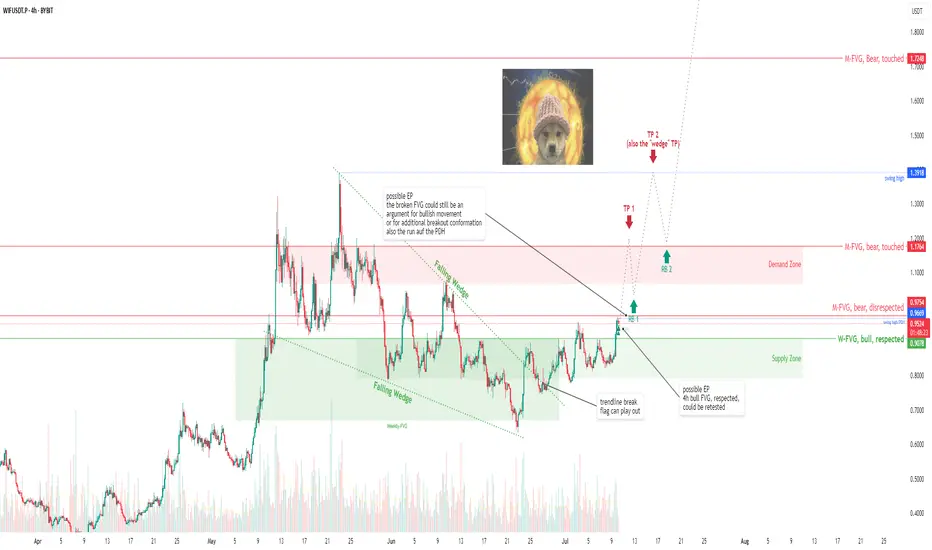
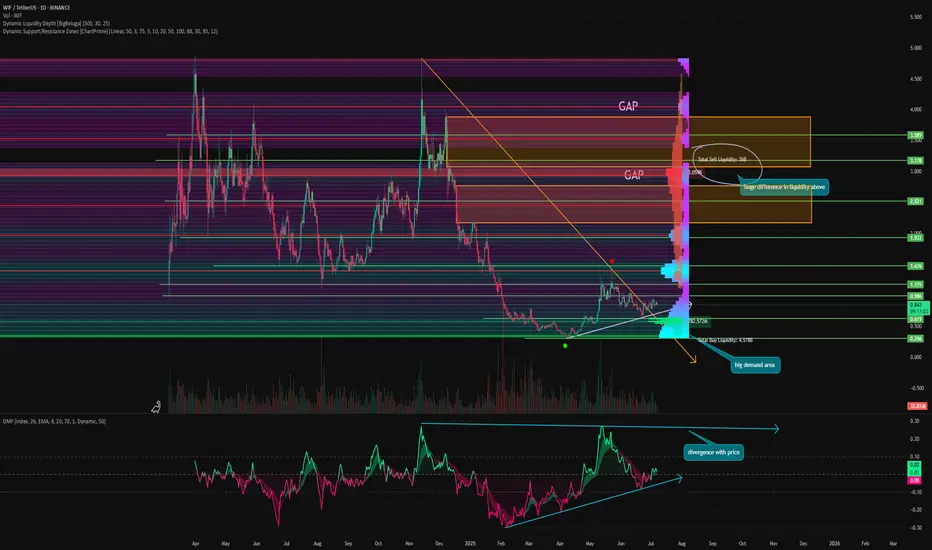
WIF/USDT: A dog wif hat lost faith but may become Pehoenix soon WIF/USDT: A dog wif hat lost faith but may become Pehoenix soon
after a long lasting crash WIF started a decent move again
was heavyly rejected
in consolidation since then
building a "Falling Wedge"
the supposed breakout happend
but there is still way more to come
For this one I'm not
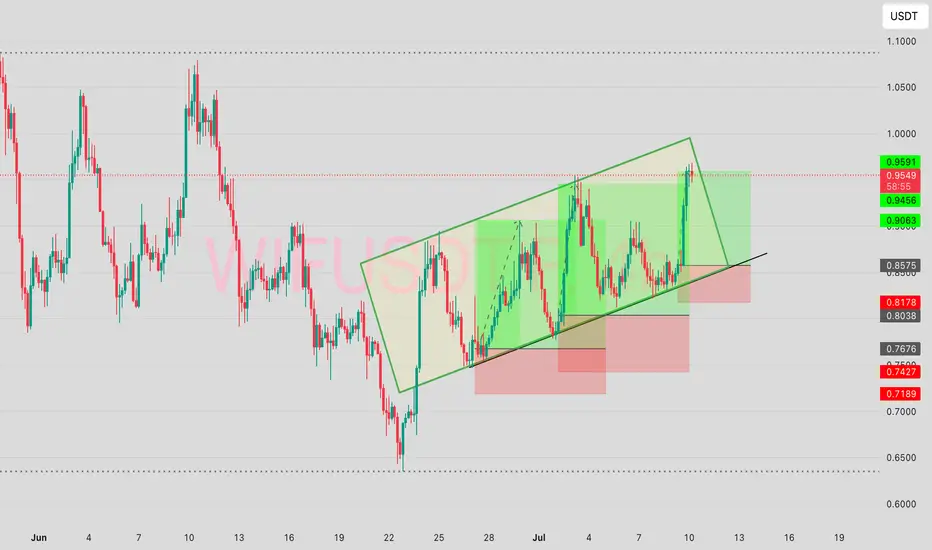
$WIFWhen your projections are respected, you feel nothing but joy.
Everyone’s joy as a trader is to spot this good moments and enjoy the ride as much as you can.
A successful trader is one who feasts on his spotted opportunity and milk as much as he can.
This trade presented 3 smooth opportunities so
WIF - The worst meme coin on the market?⚡️ Hello, everyone! Today, I want to talk about a meme coin that many consider to be the worst on the market. Let's find out if this is really the case.
WIF hyped up a lot at the beginning of the cycle. After the first wave of growth, liquidity began to gradually shift to altcoins, including memeco
MEW MEW - WIF is here!So yet again a very probable trade to the mark and you see something is better than nothing! The moves as said and marked!
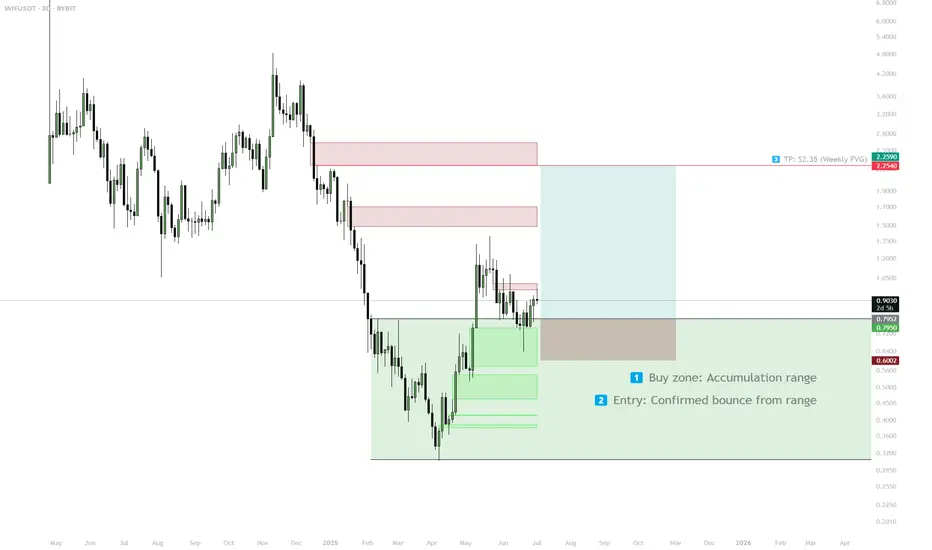
WIF — Accumulation Bounce & FVG Target1. Buy in accumulation range ($0.61–0.78)
2. Confirm entry after bounce/hold
3. Main target: $2.35 (Weekly FVG)
4. Stop: below $0.61 — scenario invalid
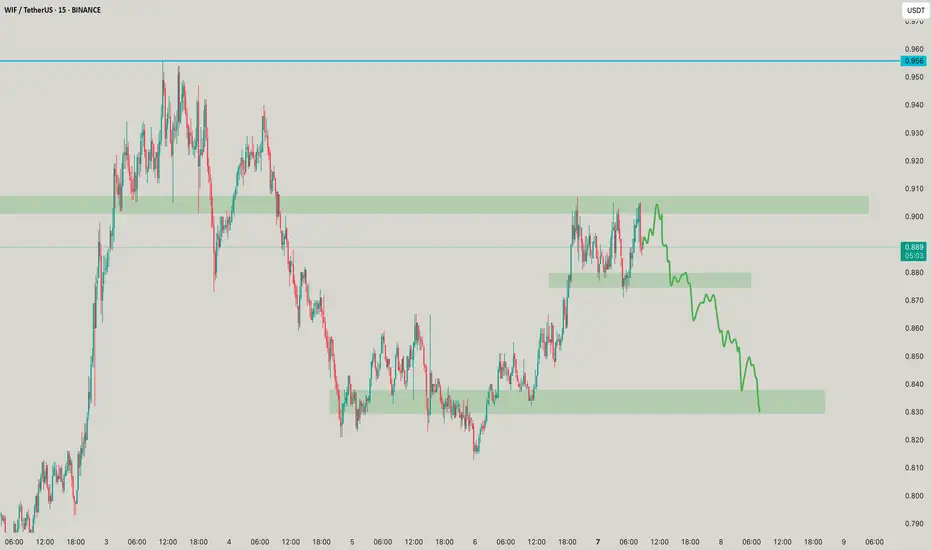
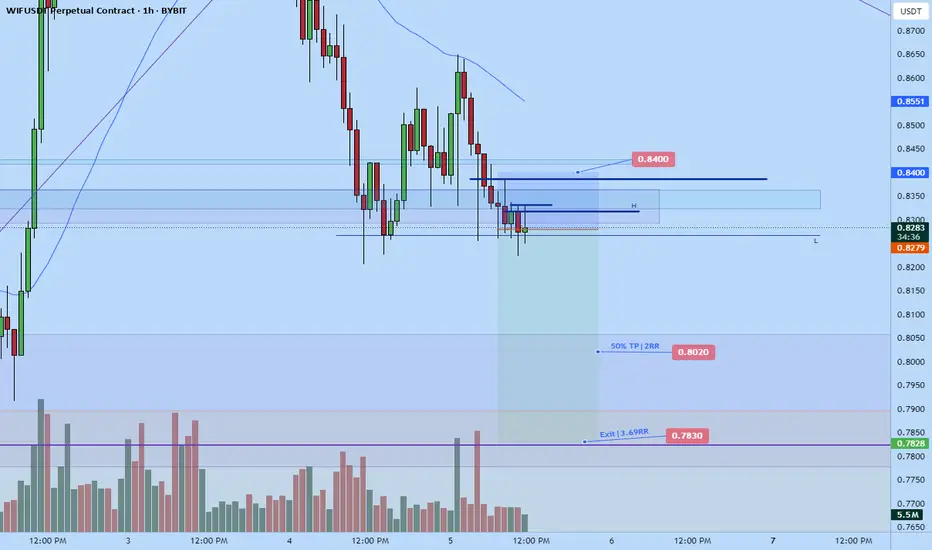
Wif weekend dump to $0.7830I went long on wif last night stopped out now am going short. I realized that the market failed to hold above key levels on higher tf so its unlike that we'll bounce strongly from current price. The strong key levels are below . $0.8050-$0.7830 is a more probable are for the market to fall to test
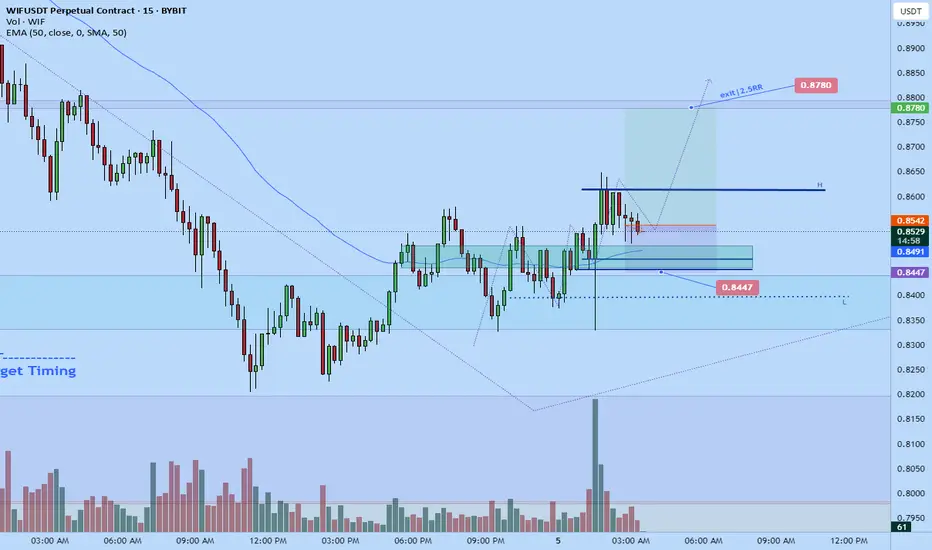
Wif scalp long to $0.8780Wif long
Stop: $0.8447
Tp: $0.8780
2.5RR aprox.
Time sensitive.
DTT price action strategy applied
See all ideas
Summarizing what the indicators are suggesting.
Oscillators
Neutral
SellBuy
Strong sellStrong buy
Strong sellSellNeutralBuyStrong buy
Oscillators
Neutral
SellBuy
Strong sellStrong buy
Strong sellSellNeutralBuyStrong buy
Summary
Neutral
SellBuy
Strong sellStrong buy
Strong sellSellNeutralBuyStrong buy
Summary
Neutral
SellBuy
Strong sellStrong buy
Strong sellSellNeutralBuyStrong buy
Summary
Neutral
SellBuy
Strong sellStrong buy
Strong sellSellNeutralBuyStrong buy
Moving Averages
Neutral
SellBuy
Strong sellStrong buy
Strong sellSellNeutralBuyStrong buy
Moving Averages
Neutral
SellBuy
Strong sellStrong buy
Strong sellSellNeutralBuyStrong buy
Displays a symbol's price movements over previous years to identify recurring trends.