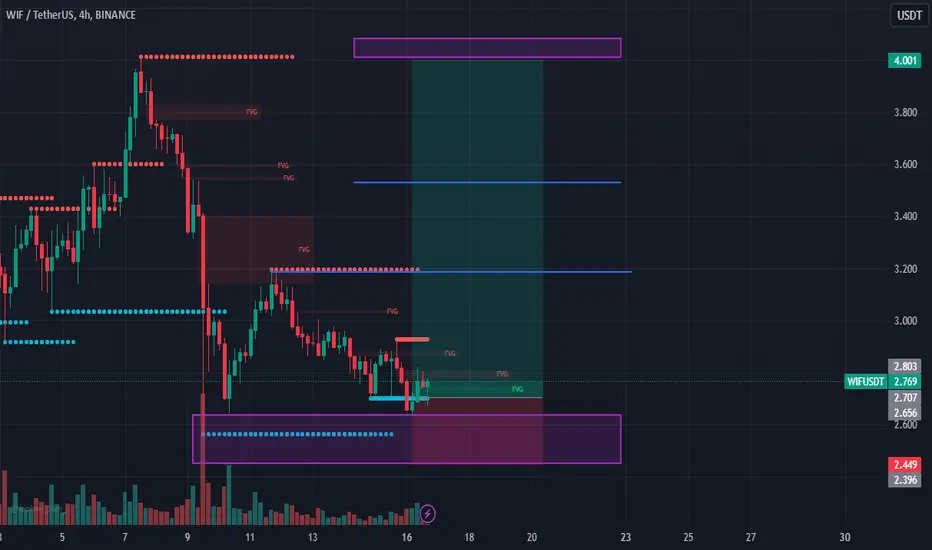
Final Opportunity to Bid on $WIFGiven the active monthly and weekly trends, it's a good opportunity to bid into the mid-impulse zone. If the price fails to hold at $3, I’ll look to buy closer to $2.50.
WIFUSDT trade ideas

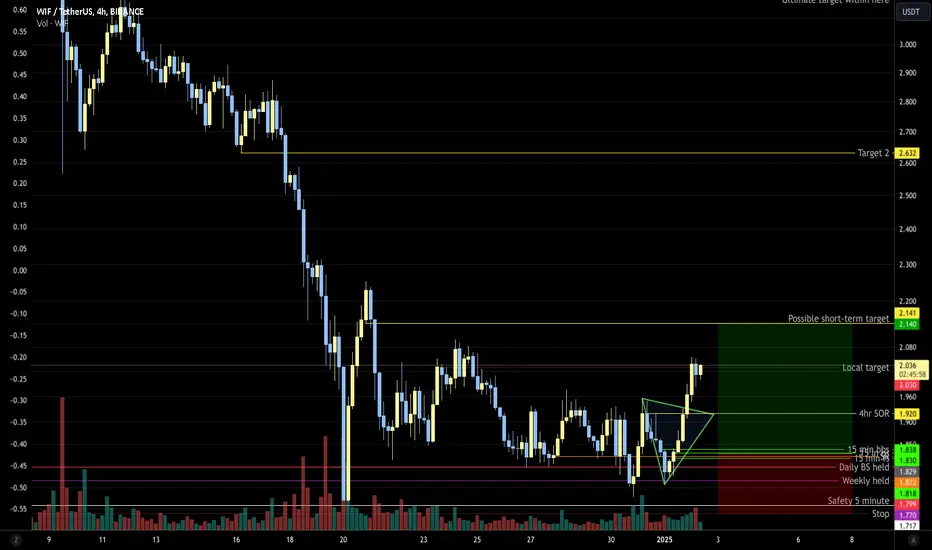
2.4 RRWif looks to be heading on a longer-term move up given it hit a weekly on the bottom. This is a re-entry play looking to move higher. Target will need to be selected based on what is reached on the top. If the current price move reaches to the indicated Target one, then retraces to the entry, take the trade to Target 2.
WIFUSDTStill bullish! WIF is approaching a key resistance zone after forming higher highs and higher lows, indicating strong upward momentum. A breakout above this level could signal further upside. However, spotted a rejection, we might see a retracement to the nearby demand zones for a potential bounce. Watch for confirmation before taking action!

WIF Now 🔥
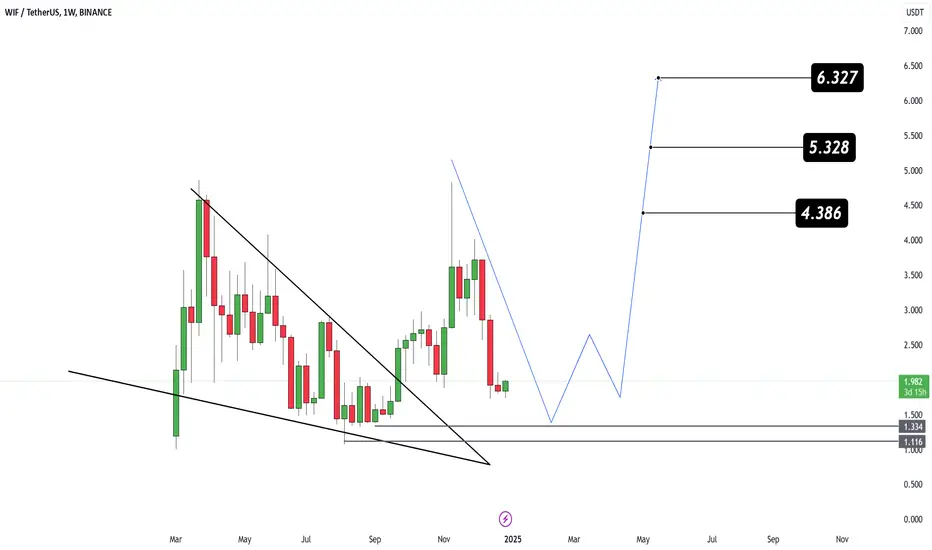
CRYPTOCAP_OLD:WIF has retraced back to the key support zone near $1.33-$1.11, following a breakout from its falling wedge formation on the weekly chart. 👀
I'm adding to my main bag here! FULL SEND 🚀
Targets 🎯
🎯 Mid-Term Sell Zone 1: $4.386
🎯 Mid-Term Sell Zone 2: $5.328
🎯 Long-Term Sell Zone 1: $6.327
🎯 Long-Term Sell Zone 2: $7.500 (potential breakout continuation)
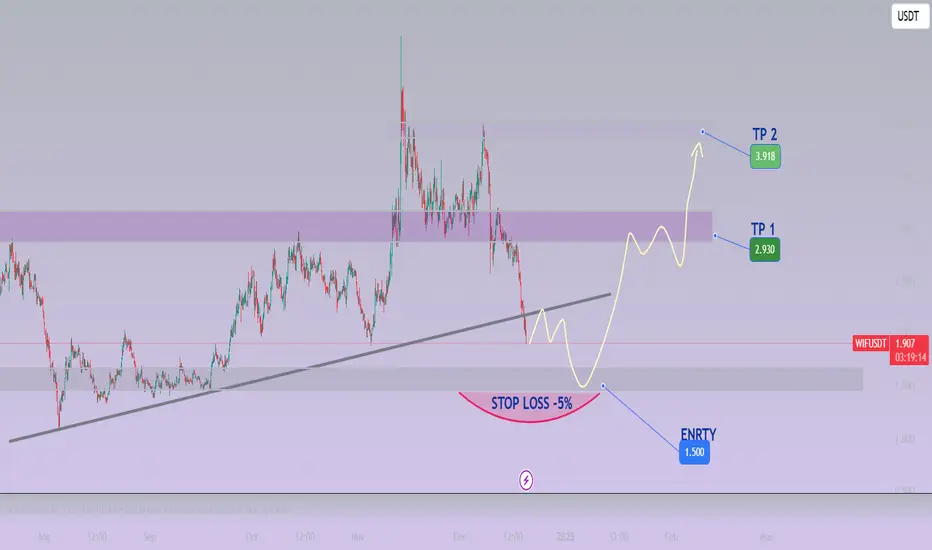
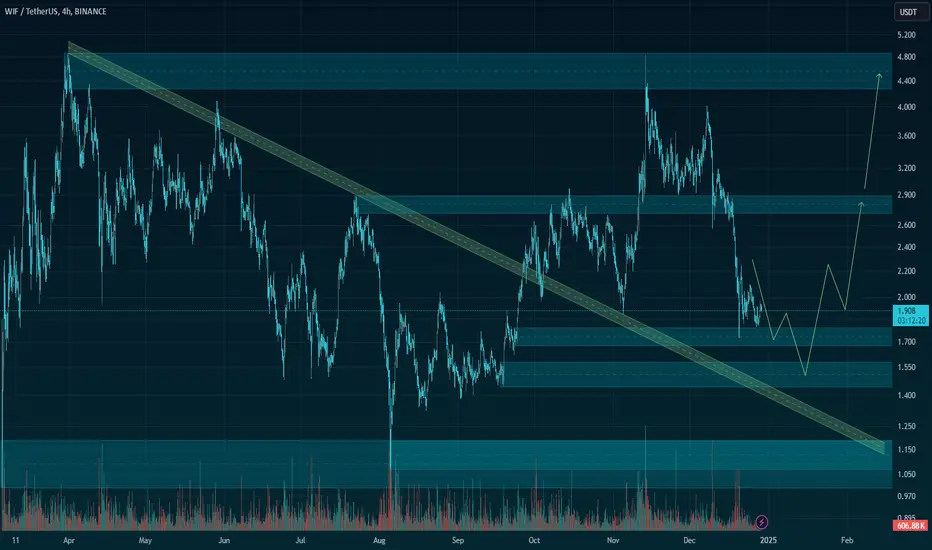
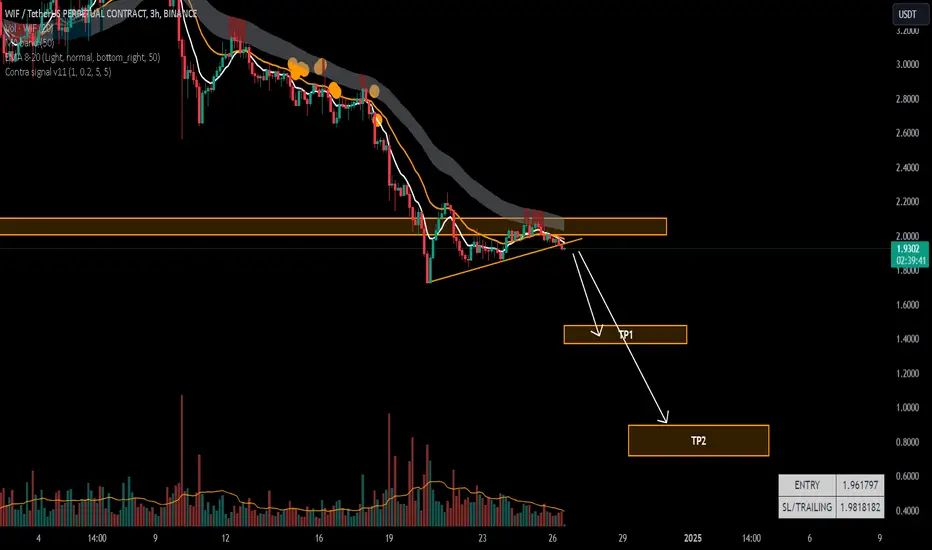
WIF/USDT: DOUBLE TARGET SETUP - 160% POTENTIAL MOONSHOT
Technical Analysis:
- Current price: 1.917 USDT
- Strong support level forming at trendline confluence
- Significant volume spike indicating potential reversal
Entry Strategy:
✅ Strategic Entry: 1.500 USDT
- Key historical support zone
- Trendline support confluence
- Oversold conditions on multiple timeframes
Target Projections:
🎯 Target 1: 2.930 USDT (95% ROI)
- Major resistance level
- Previous market structure
- Key psychological level
🎯 Target 2: 3.918 USDT (161% ROI)
- All-time high retest zone
- Major fibonacci extension level
- Huge potential reward zone
Risk Management (CRITICAL):
⚠️ Stop Loss: -5% below entry
- Clear invalidation point
- Protected by major support
- 1:19 and 1:32 Risk-Reward ratios
Key Catalysts:
- Major trend line support holding since August
- Volume profile suggesting accumulation
- Multiple timeframe alignment
- Clear market structure for upside
Trading Plan: 🚨
1. Scale in near 1.500 USDT
2. First take-profit at 2.930 (50% position)
3. Trail stops after first target
4. Hold remainder for moonshot target
⚠️ Important Notes:
- High-conviction multi-target setup
- Patience required for entry
- Volume confirmation essential
- Scale-in approach recommended
🔔 Remember:
- DYOR (Do Your Own Research)
- Never risk more than you can afford
- Set proper position sizes
- Follow your trading plan
#Crypto #WIF #TechnicalAnalysis #SpotTrading #CryptoGems #MoonShot 🚀
Would you like me to break down any specific aspect of this analysis further?
A well-thought-out analysis of WIF.Out of the ruins
Out from the wreckage
Can't make the same mistake this time
We are the children
The last generation (the last generation, generation)
We are the ones the globalists left behind
And, I wonder when we are ever gonna change, change
Living under the fear, 'til nothing else remains
We don't need another universal income (XLM)
We don't need to know the way home
All we want is WIF beyond Thunderdome
Looking for something, we can rely on
There's gotta be something better out there
Ooh, love and compassion
Their day is coming (coming)
All else are castles built in the air
And, I wonder when we are ever gonna change, change
Living under the fear, 'til nothing else remains
All the children say
We don't need another world currency (XRP)
We don't need to know the way home
All we want is WIF beyond Thunderdome
So, what do we do with our lives
We leave only a mark
Will our story shine like a light or end in the dark?
Give it all or nothing
We don't need another globalist stooge (biden, harris)
We don't need to know the way home
All we want is WIF beyond Thunderdome
All the children say
We don't need another war (we don't need another bush, clinton, bush again with cheney, obama/hillary, liz cheney and bush's grandaughter supporting globalist stooge harris)
We don't need to know the way home, ooh
All we want is WIF beyond Thunderdome
_Tina Turner
I hope the developers of WIF get a kick out of this.
A lot going on WIF this one, I'm intrigued to beat the band.
Hopefully, that was that!
We don't need another WIF chart, this is it! ;)
WIF/USDT (DogWifHat) Technical Analysis🚀 Trade Setup Details:
🕯 #WIF/USDT 🔼 Buy | Long 🔼
⌛️ TimeFrame: 1D
--------------------
🛡 Risk Management:
🛡 If Your Account Balance: $1000
🛡 If Your Loss-Limit: 1%
🛡 Then Your Signal Margin: $17.03
--------------------
☄️ En1: 2.95 (Amount: $2.55)
☄️ En2: 2.506 (Amount: $5.96)
☄️ En3: 2.19 (Amount: $7.66)
☄️ En4: 1.875 (Amount: $1.7)
--------------------
☄️ If All Entries Are Activated, Then:
☄️ Average.En: 2.495 ($17.03)
--------------------
☑️ TP1: 4.83 (+93.59%) (RR:1.59)
☑️ TP2: 5.635 (+125.85%) (RR:2.14)
☑️ TP3: 6.658 (+166.85%) (RR:2.84)
☑️ TP4: 7.959 (+219%) (RR:3.73)
☑️ TP5: 9.395 (+276.55%) (RR:4.71)
☑️ TP6: Open 🔝
--------------------
❌ SL: 0.99 (-58.75%) (-$10)
--------------------
💯 Maximum.Lev: 1X
⌛️ Trading Type: Swing Trading
‼️ Signal Risk: ⚠️ High-Risk! ⚠️
🔎 Technical Analysis Breakdown:
This technical analysis is based on price action, SMC (Smart Money Concepts), and ICT (Inner Circle Trader) concepts. All entry points, Target Points, and Stop Loss are calculated based on professional mathematics formulas as a result you can have an optimal trade setup based on great risk management.
📊 Sentiment & Market Context:
The WIF/USDT pair (DogWifHat) has been making waves in the crypto market recently, with its unique blend of meme-coin culture and community-driven innovation. Currently, the sentiment is shifting toward bullish, supported by increasing social buzz and strong market interest. As the price approaches key support and resistance levels, traders are closely watching for a potential breakout or a healthy pullback.
On the technical side, we’re observing a strong upward momentum in the recent price action, with bullish divergence signaling potential continuation. However, caution is advised as market conditions remain volatile, and external factors like broader crypto market trends or news could significantly impact the price.
Fundamentally, DogWifHat is gaining traction due to its unique branding and community engagement, which is pivotal in the meme-coin sector. While it shares similarities with other meme-based tokens, its growing community and active social media presence give it a distinctive edge. This could pave the way for higher adoption and price appreciation if it can maintain the momentum.
⚠️ Disclaimer:
Trading involves significant risk, and past performance does not guarantee future results. This analysis is for informational purposes only and should not be considered financial advice. Always conduct your research and trade responsibly.
💡 Stay Updated:
Like this technical analysis? Follow me for more in-depth insights, technical setups, and market updates. Let's trade smarter together!
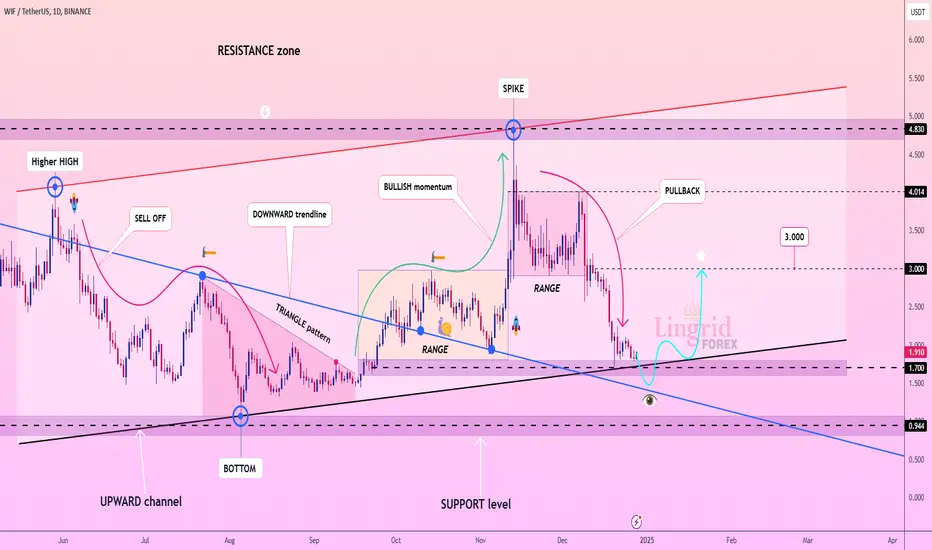
Lingrid | WIFUSDT a chance to BUY the Pullback The price perfectly fulfilled my last idea. It hit the target zone. BINANCE:WIFUSDT has pulled back significantly from $4.00 level, showing a 65% correction. The price is currently testing the support zone below $2.00 and the boundary of the channel. Given this steep correction, I believe it may be a great opportunity to buy. I expect the market to rise after bouncing off the support level and channel boundary. My goal is resistance zone around $3.00
Traders, if you liked this idea or if you have your own opinion about it, write in the comments. I will be glad 👩💻
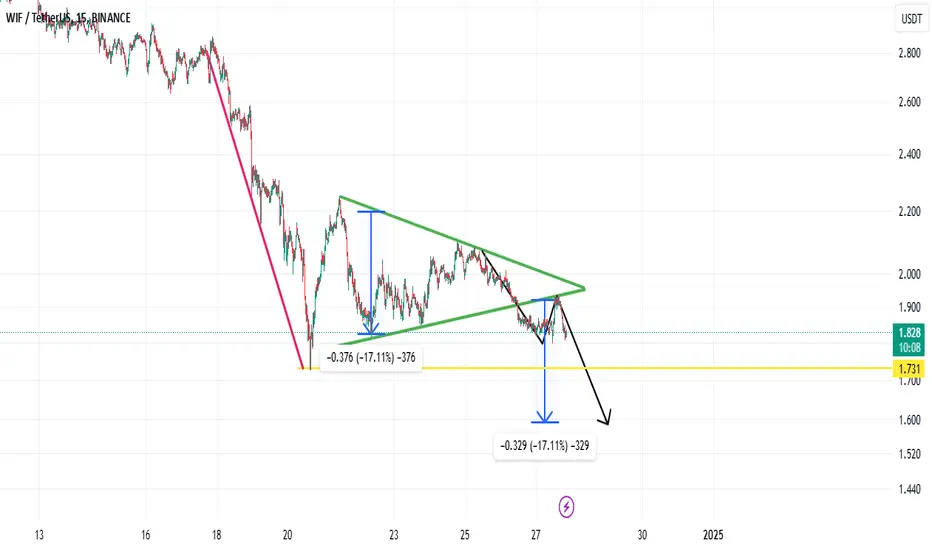
WIF SELL!!!hello friends
Considering the downward trend of this currency and the failure of our pattern and pullback to it, we now expect to fall within the specified range.
Be sure to observe capital management.
Be successful and profitable.
WIF/USDTKey Level Zone : 2.000 - 2.1000
HMT v3.0 detected. The setup looks promising, supported by a previous upward/downward trend with increasing volume and momentum, presenting an excellent reward-to-risk opportunity.
HMT (High Momentum Trending):
HMT is based on trend, momentum, volume, and market structure across multiple timeframes. It highlights setups with strong potential for upward movement and higher rewards.
Whenever I spot a signal for my own trading, I’ll share it. Please note that conducting a comprehensive analysis on a single timeframe chart can be quite challenging and sometimes confusing. I appreciate your understanding of the effort involved.
If you find this signal/analysis meaningful, kindly like and share it.
Thank you for your support~
Sharing this with love!
HMT v2.0:
- Major update to the Momentum indicator
- Reduced false signals from inaccurate momentum detection
- New screener with improved accuracy and fewer signals
HMT v3.0:
- Added liquidity factor to enhance trend continuation
- Improved potential for momentum-based plays
- Increased winning probability by reducing entries during peaks

WIF SK Top Down AnalysisAnalysed on SK Australia's call 23/12/2024
- Brady said "no financial advise", but no not invest in WIF XD

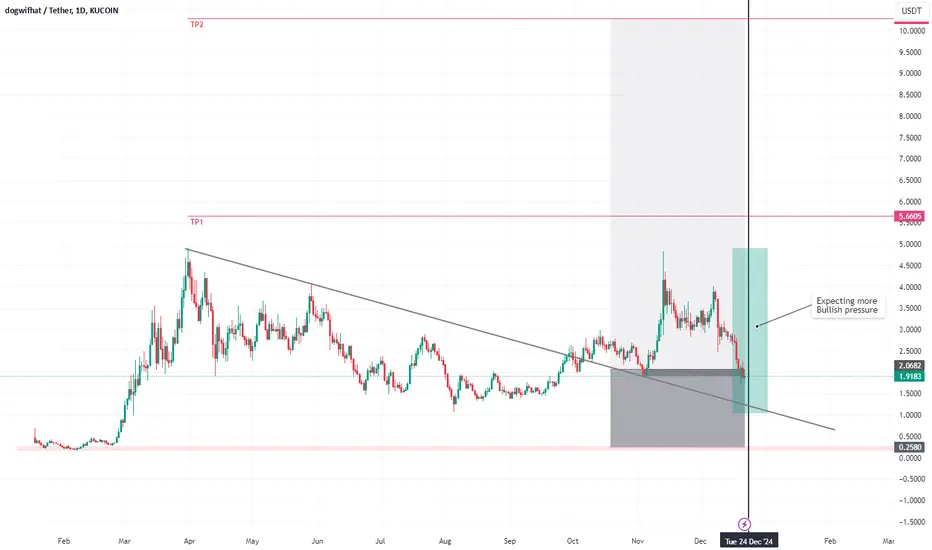
WIFUSDT: Long-Term Bullish SetupI spend time researching and finding the best entries and setups, so make sure to boost and follow for more.
DogWiFiHat ( KUCOIN:WIFUSDT ): Long-Term Bullish Setup for a Multi-Month Hold
Trade Setup:
- Entry Price: $2.0682 (Activated)
- Stop-Loss: $0.2580
- Take-Profit Targets:
- TP1: $5.6605
- TP2: $10.2864
Fundamental Analysis:
DogWiFiHat ( KUCOIN:WIFUSDT ) is an innovative cryptocurrency project aimed at merging decentralized connectivity solutions with meme-inspired community engagement. With its growing adoption and strategic partnerships in the tech sector, $ KUCOIN:WIFUSDT is creating a niche within the blockchain space. The anticipated market bullishness by May adds further potential for a strong rally.
Recent community-driven campaigns and developments in the ecosystem are expected to enhance its visibility and attract more long-term investors.
Technical Analysis (Daily Timeframe):
- Current Price: $2.0820
- Moving Averages:
- 50-Day SMA: $1.8000
- 200-Day SMA: $1.5000
- Relative Strength Index (RSI): Currently at 63, indicating bullish momentum.
- Support and Resistance Levels:
- Support: $1.9000
- Resistance: $2.5000
KUCOIN:WIFUSDT has broken out of a consolidation phase, supported by strong buying volume. A confirmed breakout above $2.50 will likely drive the price toward TP1 and eventually TP2 as the market enters a more bullish phase.
Market Sentiment:
DogWiFiHat is riding the wave of increasing interest in meme-inspired cryptocurrencies with real-world use cases. With the broader market sentiment turning positive, KUCOIN:WIFUSDT is poised for significant upside potential.
Risk Management:
The stop-loss at $0.2580 provides strong downside protection, while the take-profit targets offer excellent reward potential. TP1 represents a 173% return, with TP2 providing a potential 397% gain for long-term holders.
Key Takeaways:
- KUCOIN:WIFUSDT combines meme culture with real-world utility, making it a unique play in the crypto space.
- The trade setup offers significant upside potential, aligning with market-wide bullish expectations through May.
- Strict adherence to stop-loss and take-profit levels is crucial for managing risk.
When the Market’s Call, We Stand Tall. Bull or Bear, We’ll Brave It All!
*Disclaimer: This analysis is for informational purposes only and does not constitute financial advice. Traders should conduct their own due diligence before making investment decisions.*
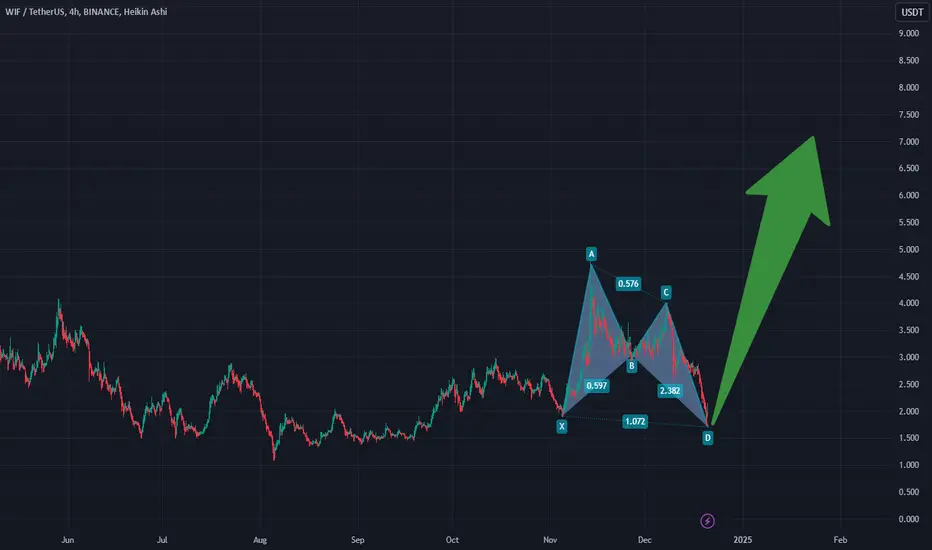
Bullish BAT Harmonic Take a look at WIF on the 4 hr time frame
We have a nice BULLISH BAT PATTERN.
I would DCA in this area...BAT PATTERNS
are an indication we are about to head
north for newer ATH! NOT FINANCIAL
ADVICE!...It's all up to BIG DADDY BTC...
Looks like we are just gonna range between
91k-100k for awhile...will this mean we will
see liquidity flow from BTC into small cap
Alt coins?...good question...with BTC dominance
on the way down...this is a great area to DCA!!!
Good luck and....
********* WIF WIF WIF WIF *********
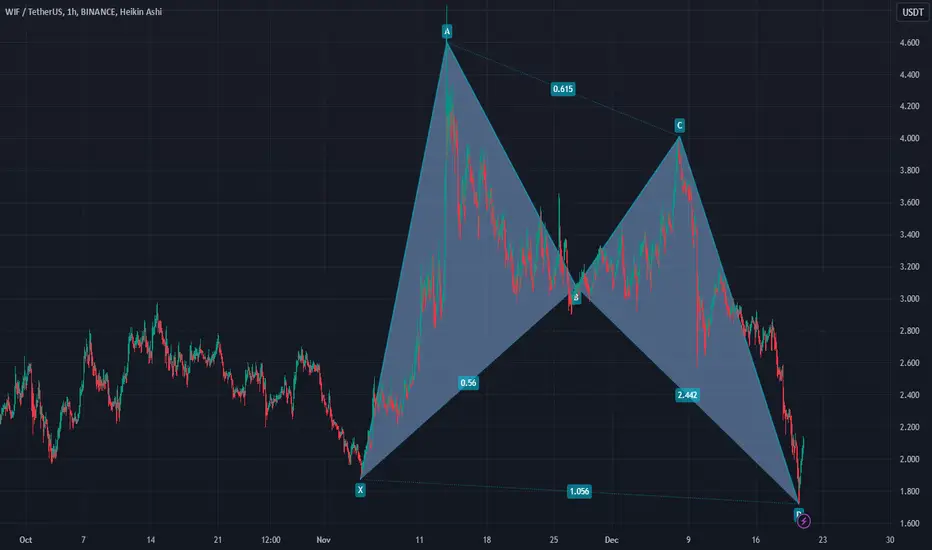
BULLISH BAT HARMONICTake a look at WIF on the 4 hr time frame
We have a nice BULLISH BAT PATTERN.
I would DCA in this area...BAT PATTERNS
are an indication we are about to head
north for new ATH! NOT FINANCIAL
ADVICE!...It's all up to BIG DADDY BTC...
Looks like we are just gonna range between
91k-100k for awhile...will this mean we will
see liquidity flow from BTC into small cap
Alt coins?...good question...with BTC dominance
on the way down...this is a great area to DCA or
a small leverage trade with tight stop loss.
Good luck and....
********* WIF WIF WIF WIF *********
STRONG bearish trendWe will see a deeper correction.
The price increase is temporary and is an opportunity to exit the loss!
Do not buy at all.
Valid supports are seen at 1.457, 1.257 and 1.070 below the bearish candle.
This is not a good time to enter the market.


Are you ready for ATH!!!Hello everyone, it seems like the daily wave is about to start, and you can be in position with a protective line of RSI in the 4-hour chart. Monitor the RSI in 4 hours. The nearest targets are shown in the chart. BINANCE:WIFUSDT This is not financial advice!

WIF Long spot from this area. key levels if we really have hit the bottom...best of luck if you have any money left from buying dips ...:)

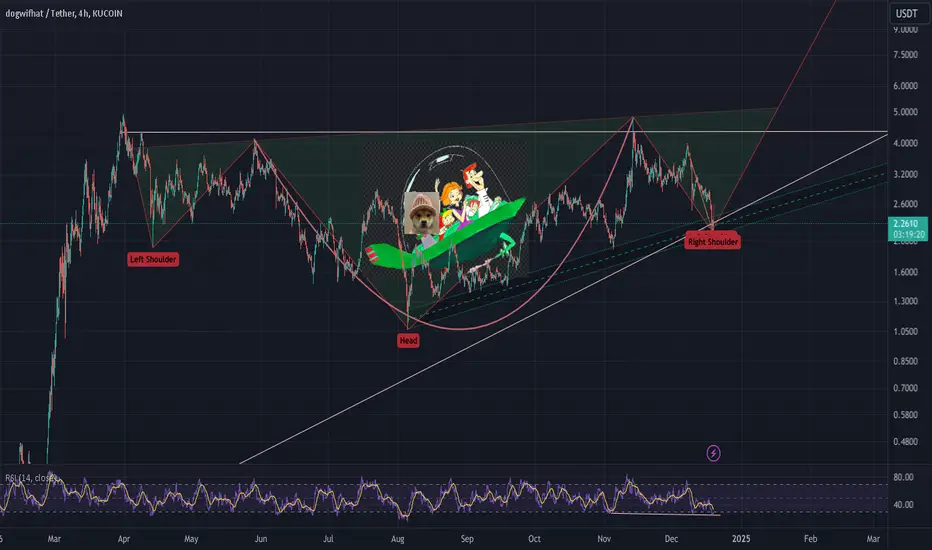
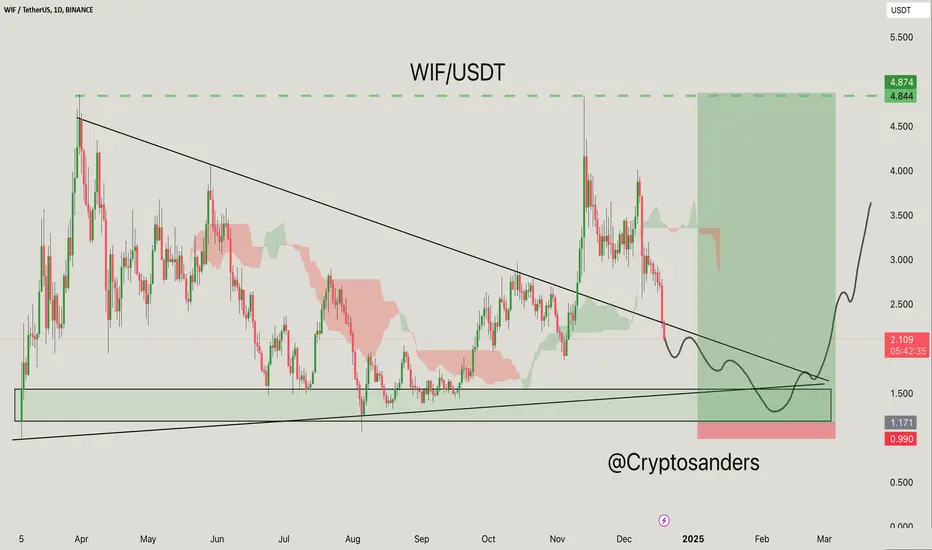
WIF/USDT Chart Analysis. The chart of WIF/USDT shows a potentially bullish setup based on technical analysis.
Descending Triangle Breakout:
The price seems to be approaching the end of the descending triangle, with a potential breakout area of around $2.50.
Support Area:
A significant green area below the current price suggests strong historical support between $0.99 and $1.17.
Ichimoku Cloud:
The behavior of the cloud suggests a transition point, indicating potential bullish momentum if the price breaks above the cloud resistance.
The upward-moving green box shows the long target area of $4.84 to $4.87.
The curve drawn on the chart suggests that the price may fall slightly to the support area before reversing sharply.
Trade Setup:
Entry: Consider buying near the $1.17 support level.
Stop-loss: Place it slightly below $0.99 to manage risk.
Target: Aim at $4.87, which provides a favorable risk-to-profit ratio.
DYOR, NFA
@Peter_CSAdmin
WIF_A reversal or Failure It must hold the red-trendline and the 1.618 Fib.
If it breaks both of them, we'll lost hope on it.
NFA

Dogwifhat (WIF) price drops 11% – analysisDogwifhat (WIF) price reached its highest levels since March 2024 earlier this month, reflecting an astonishing 1386% gain for the year. However, WIF has faced a correction, declining roughly 11% in the last 24 hours as bearish signals intensify.
Momentum indicators like the Ichimoku Cloud and ADX show strong bearish trends, with sellers firmly in control of the market. Whether WIF can hold key support levels or recover enough strength to test resistance zones will define its short-term trajectory.
Since early December, the price action has consistently made lower highs and lower lows, with the latest movement showing an aggressive bearish drop.
ADX is currently at 47, up from 36 yesterday, signaling a strong and growing trend. However, with WIF in a downtrend, the rising ADX indicates strengthening bearish momentum. This suggests the downward movement is likely to continue, as sellers remain dominant in the market.
On the chart, EMA lines currently display a bearish configuration, with short-term EMAs positioned below long-term ones. This setup suggests continued downward pressure, and WIF is likely to test the support at $2.19.
If this level fails to hold, WIF price could decline further, potentially reaching $1.88 as the next significant support.
On the other hand, if WIF price manages to reverse its downtrend and regain positive momentum, it could challenge the resistance at $2.91.
A successful breakout above this level could pave the way for further gains, with targets at $3.47 and possibly even $4 if the uptrend gains strength.

WIF - Good opportunity for LONG (Re-entry)Very good shopping site, this can go up a lot soon. We are in excellent support.
T1: 3.15
T2: 3.50
T3: 3.95 - 4