Will Dogwifhat Price Surge? Latest AnalysisThe 4-hour chart of BINANCE:WIFUSDT provides a mixed outlook, with a combination of bullish and bearish indicators suggesting potential reversal scenarios. The closing prices for the recent sessions have exhibited a varied trend, highlighting both gains and corrections.
Dogwifhat Price Technical Overview
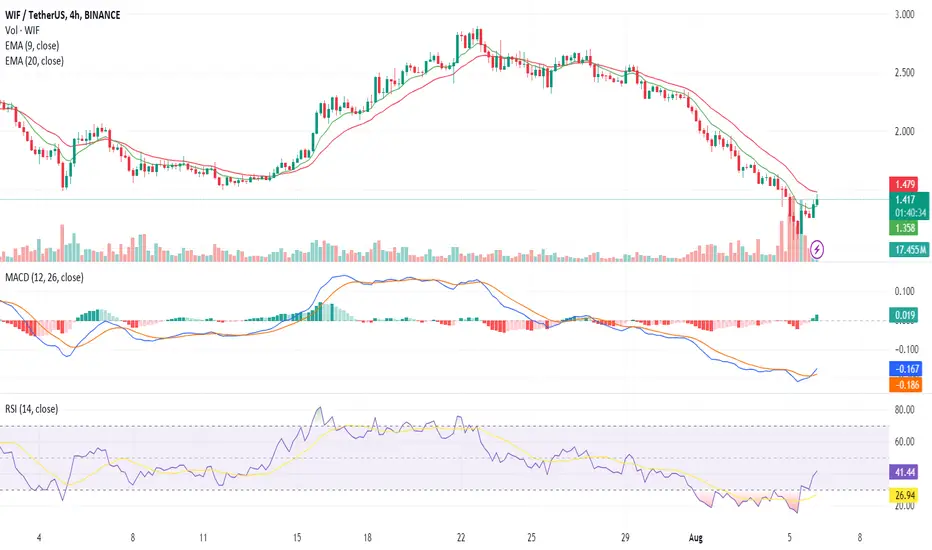
Critical support is identified at $1.123, while significant resistance levels are seen at $1.6809, $1.7204, and $1.8468. These levels will play a crucial role in determining the future action of the Dogwifhat price.
The 9 EMA has remained below the 20 EMA, indicating a bearish trend. However, the 9 EMA is showing signs of approaching the 20 EMA, which could signal a potential bullish crossover if the trend continues. This scenario would suggest a reversal, making it an opportune moment for traders to consider long positions if the price breaks above the 9 EMA.
MACD values highlight a diminishing bearish momentum. The histogram, which measures the distance between the MACD and its signal line, has been narrowing. This convergence suggests that the selling pressure is weakening, and a potential bullish reversal could be on the horizon if the MACD line crosses above the signal line.
RSI values have been steadily climbing from oversold territory (below 30) to the current level of around 40. This upward movement in RSI indicates a reduction in selling pressure and the possibility of an upcoming bullish phase. Traders should monitor the RSI closely, as a move above 50 would further confirm the bullish sentiment.
Possible Trade Approaches
For traders looking to capitalize on this analysis, consider entering a long position if the Dogwifhat price breaks above the 9 EMA and approaches the first resistance level at $1.6809. Potential exits can be targeted at subsequent resistance levels of $1.7204 and $1.8468, utilizing a trailing stop-loss to lock in profits as the Dogwifhat price advances.
On the other hand, a short position could be considered if WIF fails to sustain above the 9 EMA and starts declining towards the support level of $1.123. Potential exits should be targeted just above the support level to minimize risk.
Traders should remain vigilant of market conditions and adjust their strategies accordingly, considering both the technical indicators and overall market sentiment.
WIFUSDT trade ideas
bearish triple top pattern
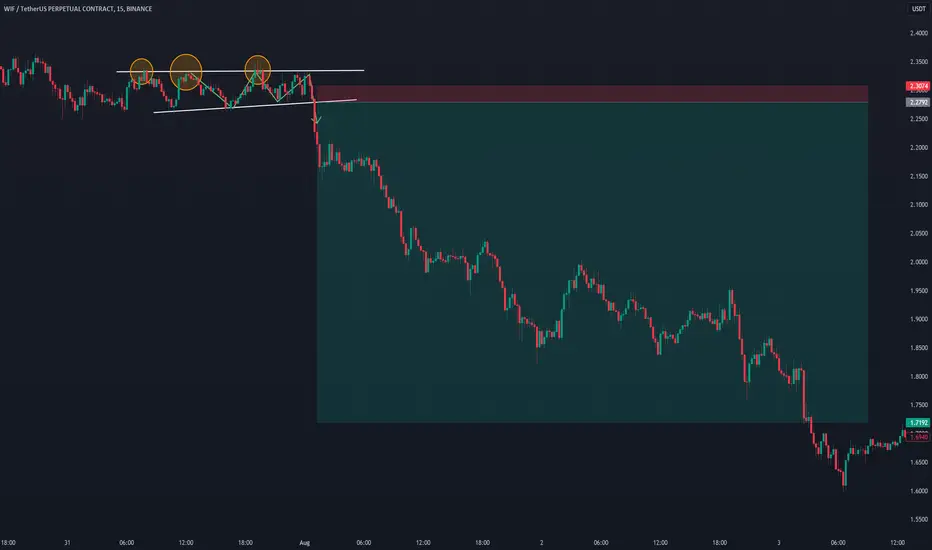
In the chart, the price formed a bearish triple top pattern and then broke downward. This downward breakout indicates a potential bearish move, suggesting that the price is likely to fall.
The triple top pattern typically represents a reversal of an uptrend, with three peaks at roughly the same price level. This pattern signals that the buying pressure has weakened and a downtrend may be starting. Since the breakout happened to the downside, it confirms a bearish trend. Thus, those who guessed "Sell" were correct, as the pattern and price action indicate a probable decrease in value.
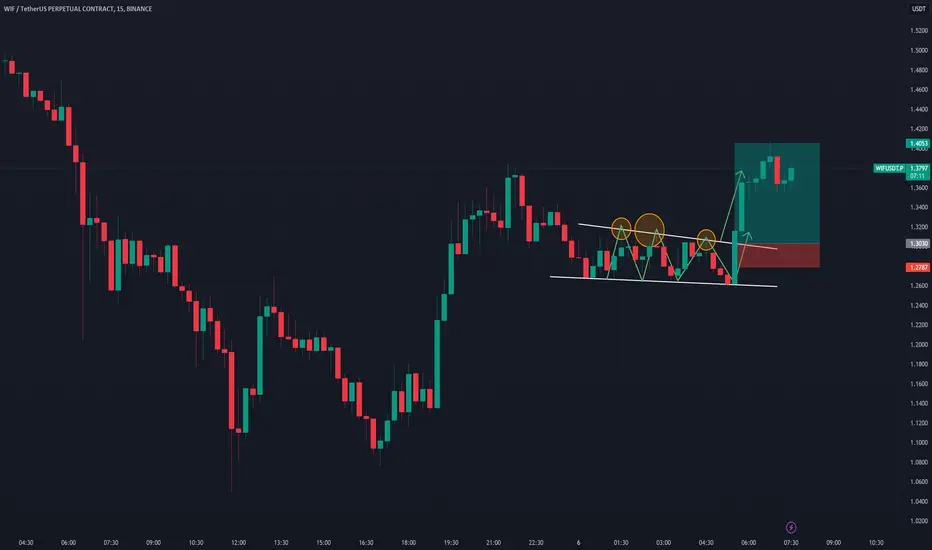
Bullish triple top pattern In the chart, the price formed a bullish triple top pattern and then broke upward. This upward breakout indicates a potential bullish move, suggesting that the price is likely to rise.
The triple top pattern typically represents a continuation of an uptrend, with three peaks at roughly the same price level. This pattern suggests strong resistance at the top, but once the breakout occurs, it confirms a bullish trend. Since the breakout happened to the upside, it signals a potential continuation of the uptrend. Thus, those who guessed "Buy" were correct, as the pattern and price action indicate a probable increase in value.
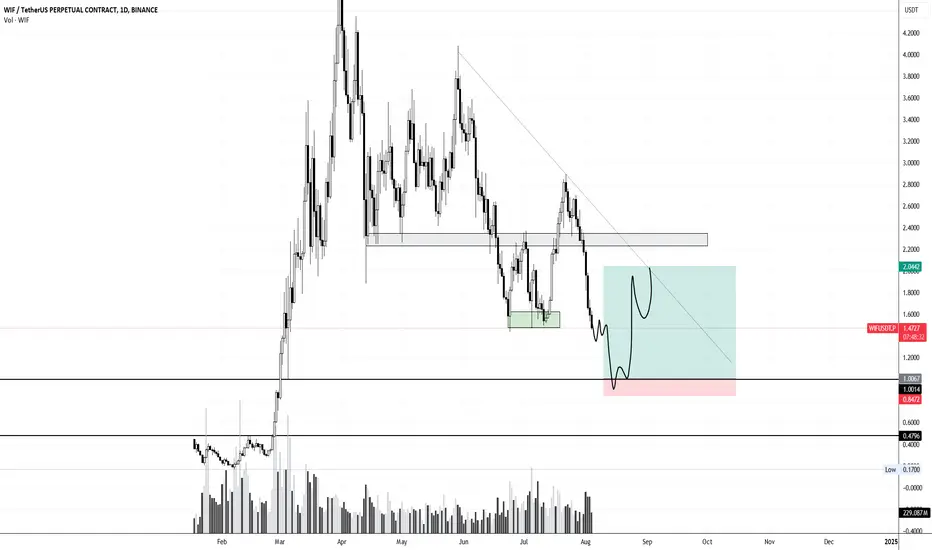
Alikze »» WIF | Ready to break supply areaIt has been moving in an upward channel at 12h and daily.
💎 Currently, after exiting this ascending channel, it has been suffering for some time in the range of the green box and the supply zone.
Considering the density in the trading range, I expect it to enter the ascending channel again after breaking the supply zone.
💎 If the supply zone is broken, it can touch the specified targets and the middle of the channel and then the next supply zone.
💎 Alternative scenario: If the green box area breaks, it can continue correction until 1.96.
»»»«««»»»«««»»»«««
Please support this idea with a LIKE and COMMENT if you find it useful and Click "Follow" on our profile if you'd like these trade ideas delivered straight to your email in the future.
Thanks for your continued support.
Sincerely.❤️
»»»«««»»»«««»»»«««

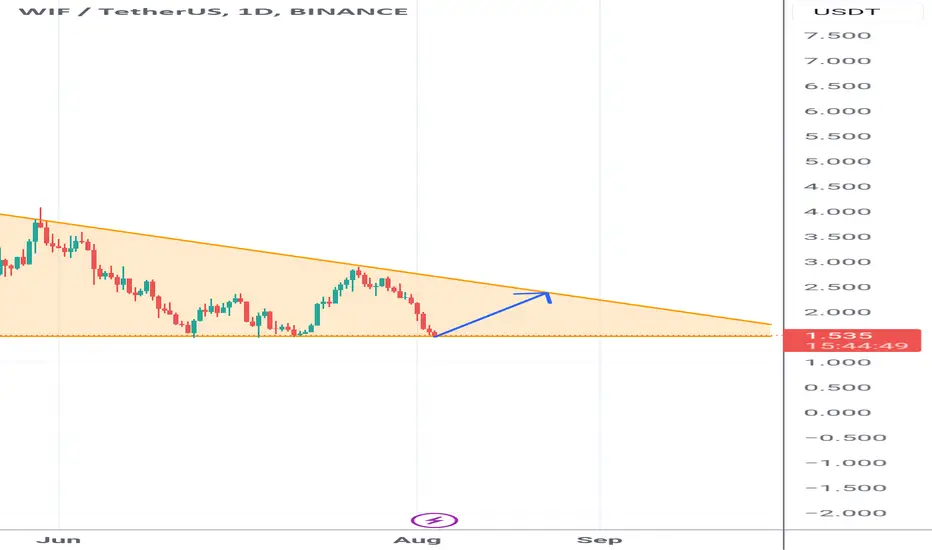
WIFUSDTOne of the tokens I urgently added to my portfolio is #WIF, the #dogwifhat token. It has formed a descending wedge pattern and has reached its lowest point. It has returned to the Binance listing price. As soon as Bitcoin starts to rise, this token is likely to be among the top gainers. My short-term target is a 100% increase, or 2x gains.

WIF - The hat is finally off :)Take this with a grain of salt, but the hat is off - Finally ;)
Weeks or even months ago I was sure WIF is going to a dollar eventually and now it looks like the time is right for the final plunge. I don't believe it will go there in a straight line from current prices, so I think we will see a few more days of consolidation at the range lows, maybe even a 20% bounce, but most likely it won't print a higher high from here.
But what do I know... these meme-coins are extremely unpredictable because all that needs to happen is Elon Musk posting a picture of a dog and people are going crazy :)
No hate, but you all know these assets are not made to last.
Stay safe!
WIF - Plan vs What HappenedJust a small update on this idea from earlier.
Marking s/r levels in confluence with volume profile can give great results.
One extra here is the setup with fib levels:
- breakout
- retest of the breakout level
- then you mark the golden pocket from breakout high to retest low
- golden pocket is first aggressive short entry, stop at the high
- second entry is the break back inside the range, then short the bearish retest, stop at golden pocket high


Potential Bullish Reversal for WFI (WIF/USDT)#WIF/USDT #Analysis
Description
---------------------------------------------------------------
+ The chart shows a descending channel pattern forming since the peak in early 2024. The price has respected the upper and lower bounds of this channel multiple times, indicating a strong bearish trend within this range.
+ The price is currently approaching a significant support zone around $1.80, which aligns with the lower boundary of the descending channel.
+ A breakout above the upper boundary of the channel around $2.30 could signal a potential trend reversal.
+ The EMA 100 (blue line) and EMA 55 (light blue line) are currently acting as dynamic resistance levels. A break above these moving averages would add to the bullish sentiment.
+ If the price holds above the $1.80 support level and breaks out of the descending channel, we can expect a potential move towards the $4.00 - $4.50 resistance zone. Further upside could see the price targeting the $6.50 - $7.00 levels, as indicated by the dotted arrow path.
+ The RSI is currently at 37.31, indicating that the asset is in the oversold region. A reversal in RSI towards the 50 mark would support a bullish momentum shift.
+ As long as the price remains above the $1.80 support level, there is a potential for a bullish reversal.
---------------------------------------------------------------
VectorAlgo Trade Details
------------------------------
Entry Price: $1.80 with confirmation of suppor
Stop Loss: $1.3
------------------------------
Target 1: 3.042
Target 2: 4.170
Target 3: 5.0
Target 4: 7.0
------------------------------
Timeframe:1D (Daily)
Capital Risk: 1-2% of trading amount
Leverage: 5-10x
---------------------------------------------------------------
Enhance, Trade, Grow
---------------------------------------------------------------
Feel free to share your thoughts and insights.
Don't forget to like and follow us for more trading ideas and discussions.
Best Regards,
VectorAlgo

WIF its the time to get in
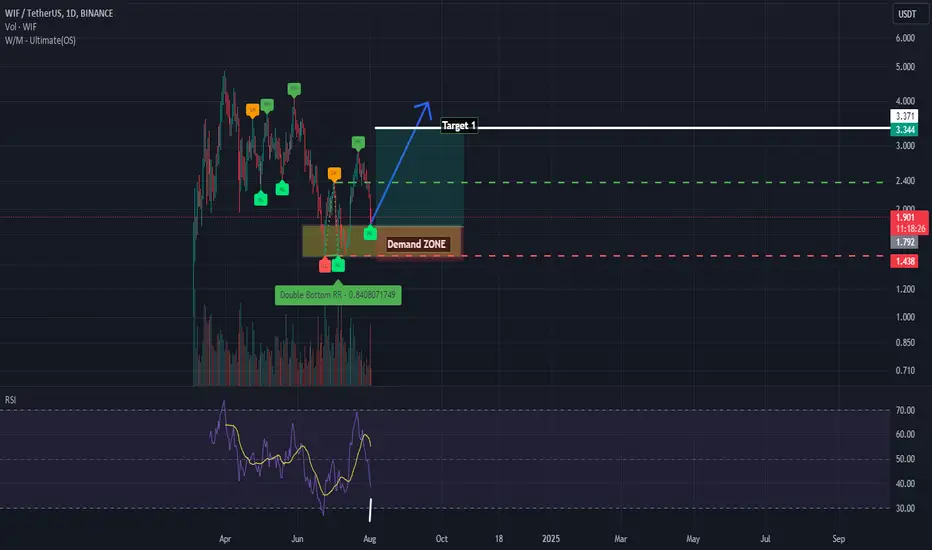
WIFUSDT is in daily timeframe and now in the correction Phase and moving to demand ZONE where we can see the accumulation, I suggest to buy this from 1.7 to 1.9 Level to set up the target 3.
Morover it is already in up trend in 1 day chart.
Rebound is expected anywhere in this support Area
- Support/Accumulation Range: $1.7 to $1.9.
Resistance: $2.85.
Resistance: $4.86.
- Invalidation: A close below the lower support at $1.5.
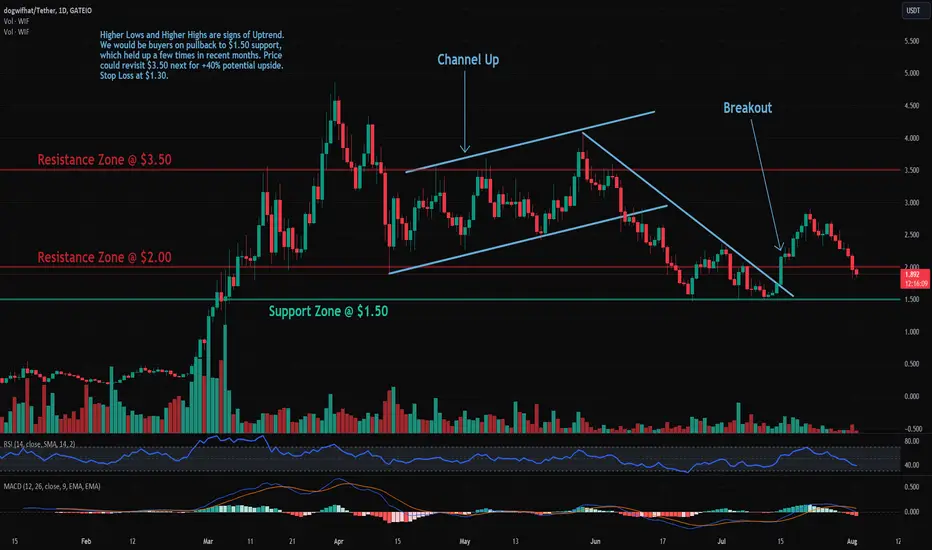
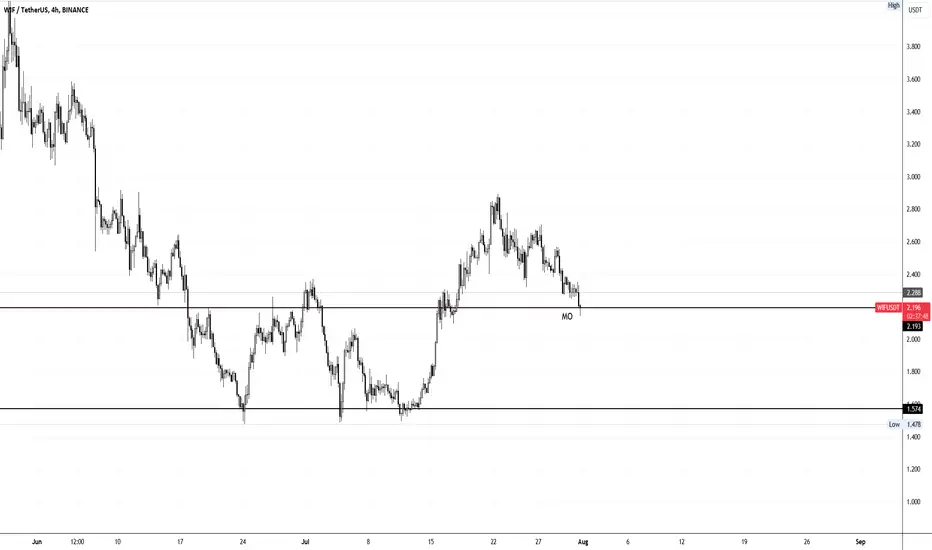
WIF (dogwifhat): Approaching SupportTrade setup : Price broke above $2.00 resistance and through the down trendline (see blue line in chart) and made a Higher High - meaning, price broke above prior swing high of $2.37. Higher Lows and Higher Highs are signs of Uptrend. We would be buyers on pullback to $1.50 support, which held up a few times in recent months. Price could revisit $3.50 next for +40% potential upside. Stop Loss at $1.30.
Pattern : Price is Approaching Support, which is a level where it could pause or reverse its recent decline, at least temporarily. Support is often a level where price has bounced up in the past, or potentially prior Resistance level that was broken. (concept known as polarity). Once price breaks below support, it can move lower to the next support level. Learn to trade key levels in Lesson 7.
Trend : Short-term trend is Strong Down, Medium-term trend is Neutral and Long-term trend is Down.
Momentum : Price is neither overbought nor oversold currently, based on RSI-14 levels (RSI > 30 and RSI < 70).
Support and Resistance: Nearest Support Zone is $1.50. Nearest Resistance Zone is $2.00, then $3.50.
WIF Technical Analysis in a Daily TimeframeHello everyone, I’m Cryptorphic.
For the past seven years, I’ve been sharing insightful charts and analysis.
Follow me for:
~ Unbiased analyses on trending altcoins.
~ Identifying altcoins with 10x-50x potential.
~ Futures trade setups.
~ Daily updates on Bitcoin and Ethereum.
~ High time frame (HTF) market bottom and top calls.
~ Short-term market movements.
~ Charts supported by critical fundamentals.
Now, let’s dive into this chart analysis:
WIF, in the daily timeframe, is in a correction phase and is likely to move down toward the lower support trendline between $1.50 and $1.70.
A rebound can be expected from anywhere near the support range, which could eventually push the price as high as 200% in the coming days.
Key levels:
- Support/Accumulation Range: $1.5 to $1.7.
- Primary Resistance: $2.85.
- Higher Resistance: $4.86.
- Invalidation: A close below the lower support at $1.5.
DYOR. NFA.
Please hit the like button to support my content and share your thoughts in the comment section. Feel free to request any chart analysis you’d like to see!
Thank you!
#PEACE

WIF - Risky long entryReally don't like this coin, but a setup is a setup, right?
Punted a long from the monthly open level with a tight stop 5% below. No high hopes for this one as everything else is going down and I still believe we will see BTC at 58-59k coming days so it probably drags WIF with it. But again, not risking much here.
I don't even have a target, might close after a small bounce already.
Stay safe!
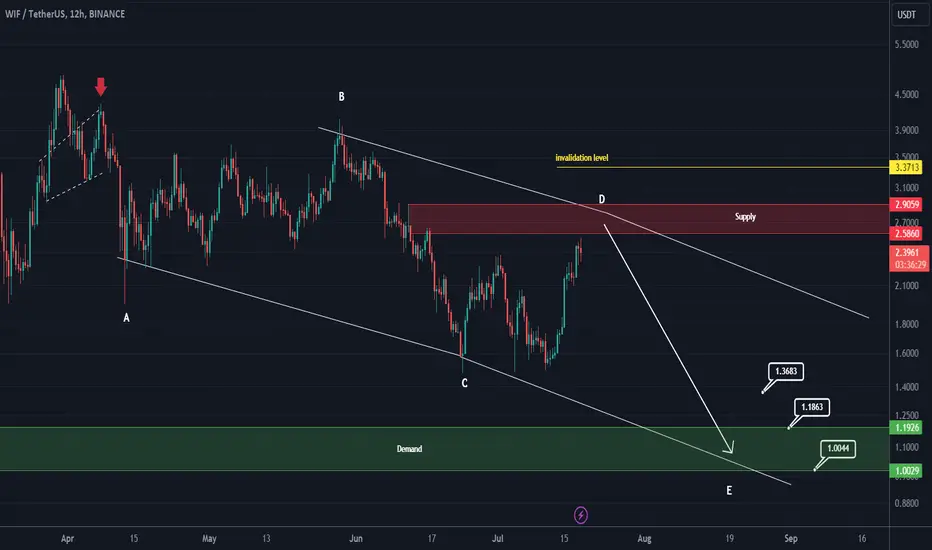
WIF UPDATE (12H)Now, there is good data on the chart. From where we put the red arrow on the chart, it looks like a big correction has started.
The correction seems to be a diametric.
Wave D seems to be ending.
The targets are listed on the chart.
The green area is a strong support on which we look for buy/long positions
Closing a candle above the invalidation level will violate the analysis
For risk management, please don't forget stop loss and capital management
Comment if you have any questions
Thank You
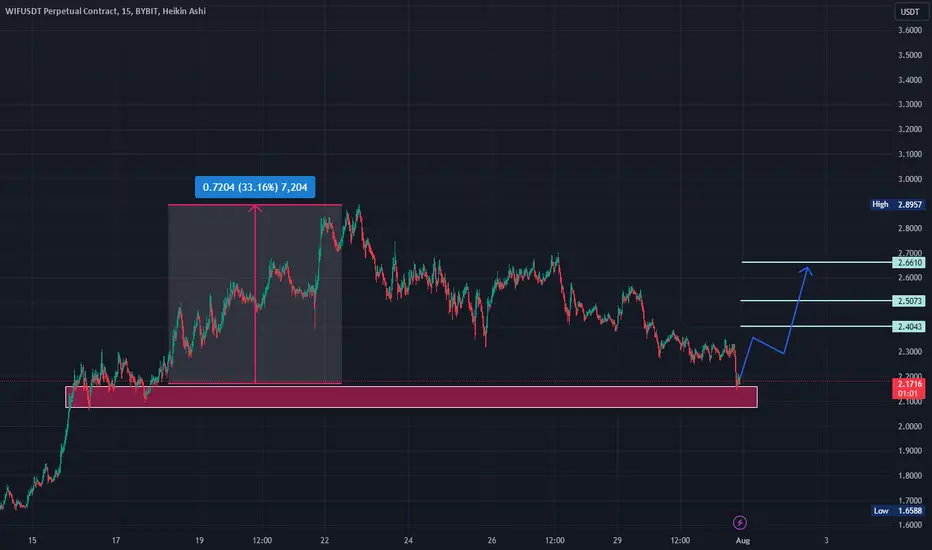
WIFUSDT.P LONG WIFUSDT LONG
Entry : 2.1738
Leverage : Cross X20
Capital invested : 2%
Targets : 2.4043/2.5073/2.7000
#GM
WIF/USDT is showing bullish potential at $2.1738, with strong support at $2.10 and a recent bullish crossover in the MACD, suggesting upward momentum.
Trade Setup: WIF Long PositionMarket Context:
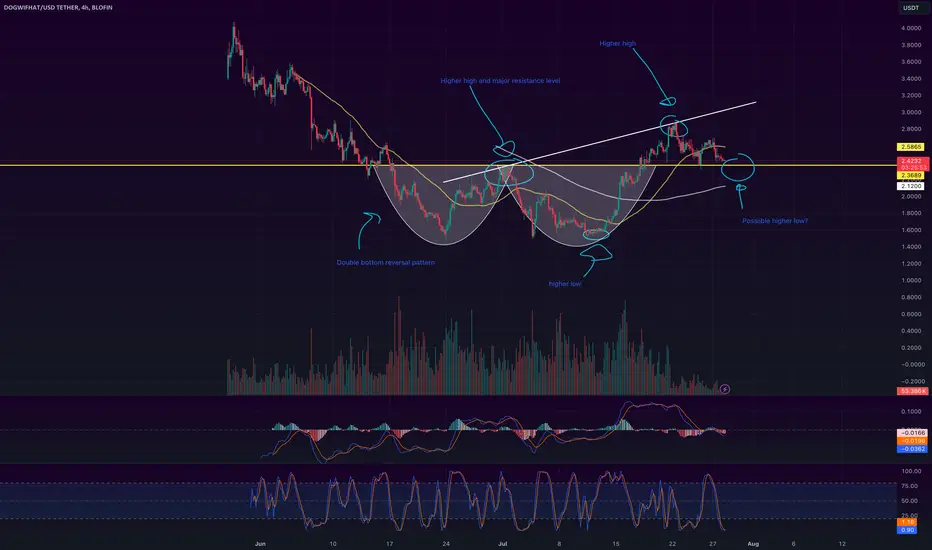
WIF set in a double bottom on July 11th and has since climbed 90%, establishing a higher high and breaking the downtrend.
The price is currently retracing, and we are looking for acceptance above $2. Observing this area for signs of a bounce will help in trading the breakout while setting in a higher low.
Trade Parameters:
Entry: Enter a trade between $2 and $2.2.
Take Profit:
First target: $3
Second target: $3.6
Stop Loss: Set at a daily close below $1.90
📊 Monitor price action closely around the $2 area for signs of a bounce. Ensure to manage your risk effectively and adjust the trade if market conditions change. #WIF #TradingStrategy #CryptoTrading 🎯

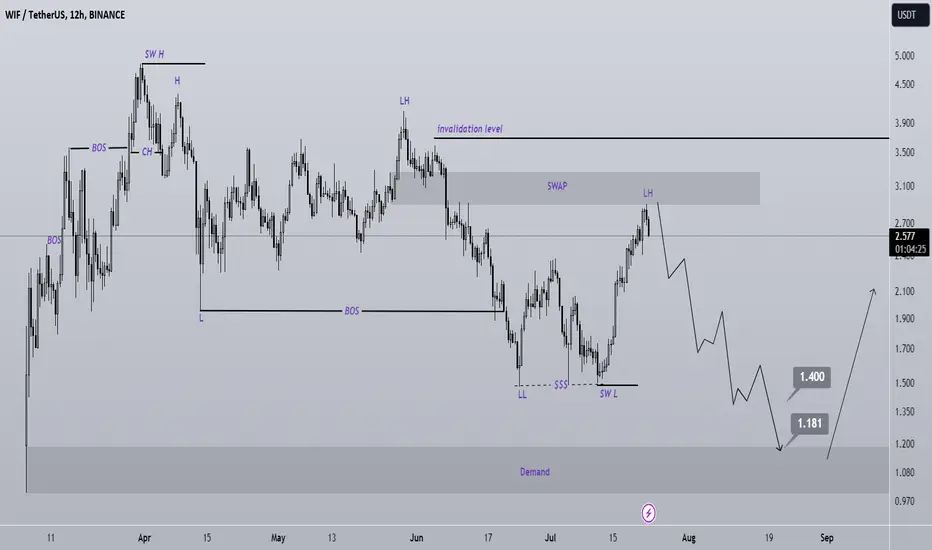
WIF is bearishThe large WIF structure is bearish. Price is constantly making lower L's and H's.
Every time the price moves above the demand range, it cannot make new Hs.
It has now hit good resistance.
By maintaining the swap range, it can move and drop towards the targets.
We have specified the targets on the chart.
Closing a daily candle above the invalidation level will violate the analysis.
Note that the financial market is risky, so:
Do not enter a position without setting a stop and capital management and confirmation and trigger.
When we reach the first TP, save some profit and try to move the stop continuously in the direction of your profit.
If you have any comments please post them, comments will help us improve our performance
Thanks
WIF bullish long-term holdThe chart's inclusion of bullish reversal patterns and an obvious sign of an uptrend, it can be safe to assume, through a technical analysis standpoint, that CRYPTOCAP:WIF is projected to hit a "Higher low" of its current uptrend.
WIF - x6 Leveraged TradeWIF
dogwifhat appears to be one of the strongest coins in this area.
And a loosely defined contraction pattern is printing.
So considering that the market dump is probably behind us; I have bought Spot and a x6 leveraged trade.
x6 will liquidate 5.5% below the market dump low @$2.192.
Considering how bullish Bitcoin has become, I dont think it gets there.
And I think WIF will continue on to much higher highs 👍.
Not advice

WIF Reversed ShSWif shows a sign of reversed Shoulder Head Shoulder what makes it show a sign of Bulls entering. We will wait for breakout of the neckline to confirm.
Make sure u always dyor, this is no financial advice. Good luck trading!

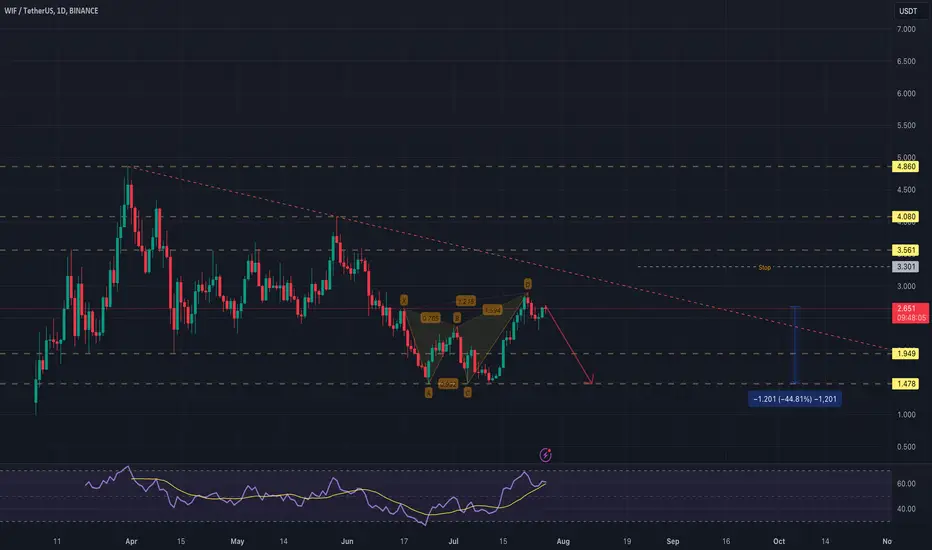
#Wif 1D chartCRYPTOCAP:WIF 1D chart;
A bearish harmonic pattern is present
The most important factor that can support this decline is that the market will move downwards
This pattern is automatically cancelled if the stop level on the chart is exceeded
44% decline ⏳
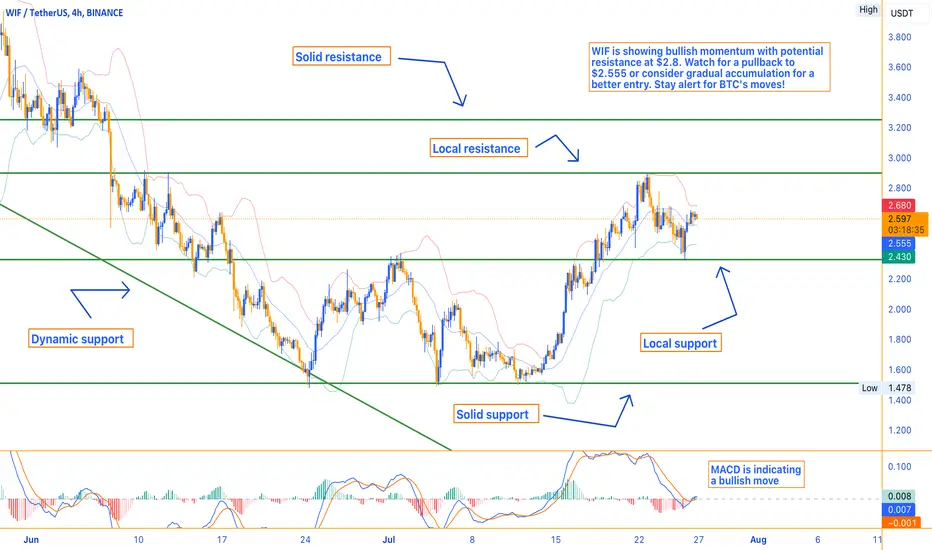
WIF: Key Levels and Buy StrategyThe trading volume is 438.706K WIF, indicating significant market activity.
Indicates a potential bullish trend with the SAR at $2.364.
The SMA is at $2.561, indicating that the current price is slightly above the moving average, which can be a bullish sign.
The histogram value is 0.008, MACD line is 0.008, and the signal line is -0.001, indicating a bullish trend.
%K at 79.49 and %D at 81.50, indicating near overbought conditions.
The RSI stands at 52.57, suggesting that WIF is in a neutral zone but with a bullish bias.
Market Sentiment
The market sentiment for WIF appears cautiously optimistic. While the Stochastic Oscillator indicates nearing overbought conditions, the MACD and Parabolic SAR suggest bullish momentum.
Potential Market Scenarios
Bullish Scenario:
A decisive break above the local resistance at $2.8 could lead to further upward movement, targeting the solid resistance at $3.2.
Bearish Scenario:
If WIF fails to break above the local resistance, it could retest the support levels at $2.555 and $2.43. A break below $2.43 could signal further declines.
When to Buy WIF for Investment
Current Situation:
Given WIF's current price at $2.6 and the technical indicators suggesting potential overbought conditions, a cautious approach is warranted.
Optimal Buying Strategy:
Wait for a Pullback: Considering the Stochastic Oscillator indicating near overbought conditions, waiting for a pullback towards the local support level at $2.555 could offer a better entry point.
Solid Support Level: If the price drops further, the solid support at $2.43 is a strong level to consider for investment. Historically, WIF has found significant buying interest at this level, making it a safer entry point.
Gradual Accumulation: Alternatively, adopting a dollar-cost averaging (DCA) strategy by buying small amounts at regular intervals can mitigate the risk of market timing and take advantage of potential dips.
Conclusion and Market Outlook
WIF is currently positioned with significant support and resistance levels to watch. While technical indicators suggest potential overbought conditions in the short term, the bullish MACD and overall market activity suggest room for growth.
Impact of Bitcoin:
It's essential to note that Bitcoin (BTC) is currently at a crucial level. If BTC fails to surpass its all-time high and experiences a significant drop, it could negatively impact the broader cryptocurrency market, including WIF. Monitoring BTC's price action is vital for understanding potential risks to WIF's price movements.