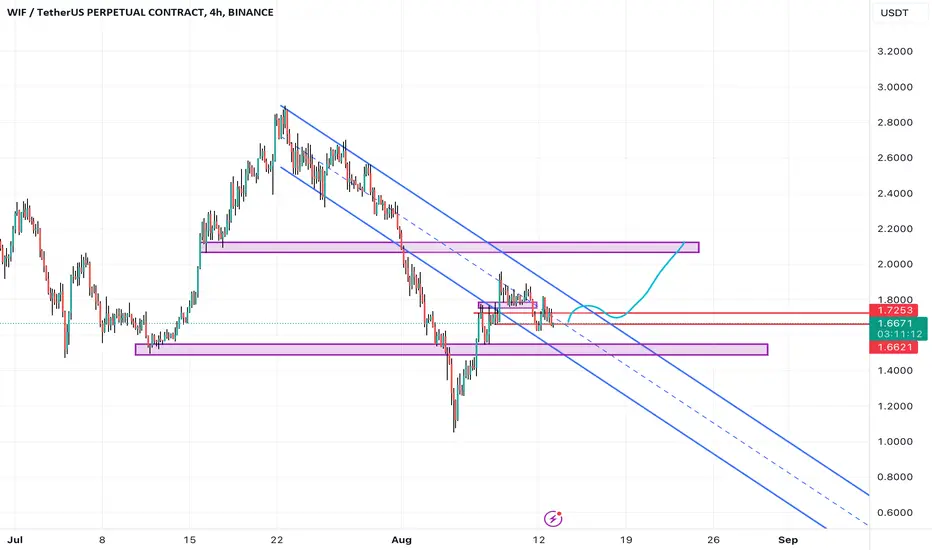
WIF Looking Good — Can We Get 2.25?WIF was one of the biggest gainers last week, adding almost 40%. Based on the chart, it is likely we'll see a continuation of the uptrend.
Here's why:
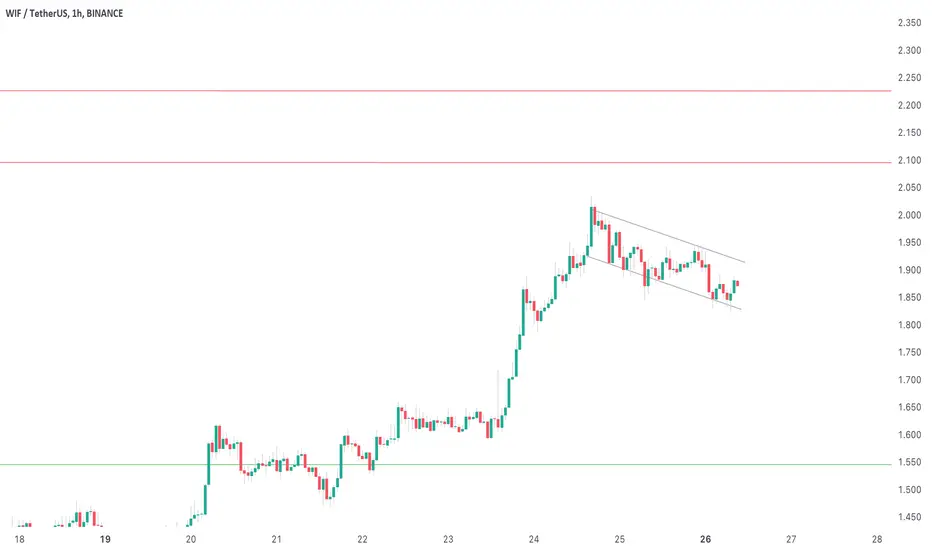
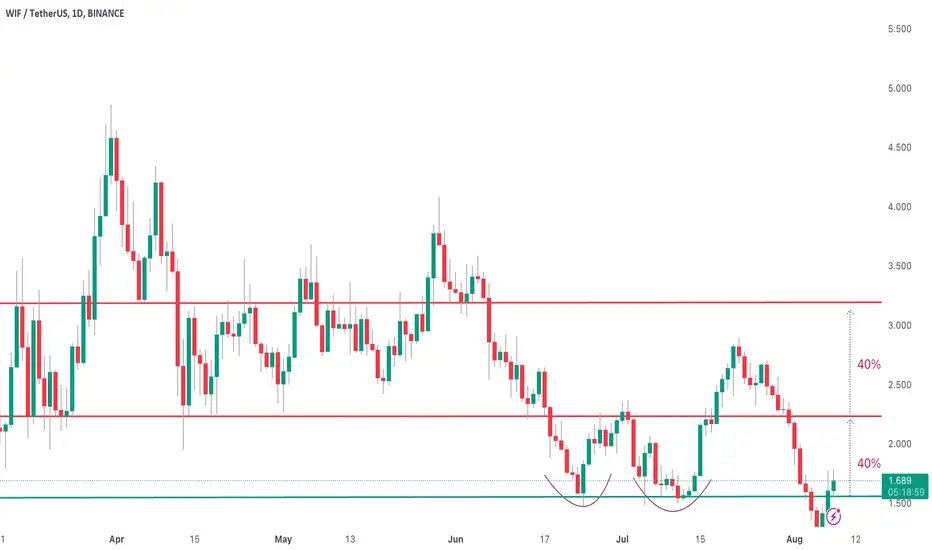
• WIF faced resistance at the psychological $2 mark. Actually, it's not surprising after the intense climb.
• Afterward, WIF entered a descending channel you could interpret as a bull flag.
• Typically, a descending channel after a pump is considered a continuation pattern. Accordingly, we should see a breakout to the top at some point.
If this breakout happens, the price should quickly rise toward the level of 2.25 (calculated based on the previous pole flag).
Therefore, you should pay close attention to the upper trendline.
WIFUST trade ideas
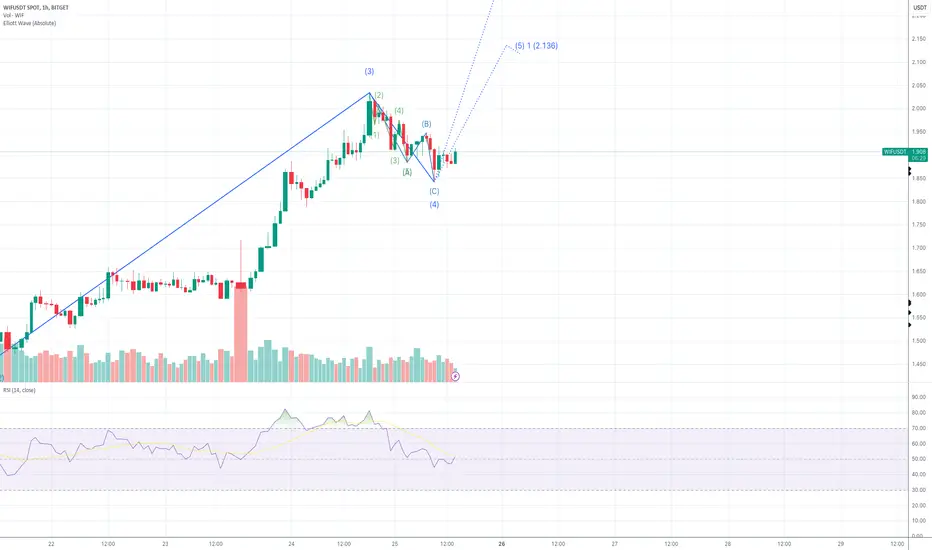
WIFUSDT entering Wave 5 in 1H chart?Following EW, looks like a clear 5 wave down giving us a clear A, a sharp B and C.
Given reduced volume in the 30min chart and also RSI having a sharper incline correlated with the C, seems like WIF is embarking in wave 5?
Thoguhts?
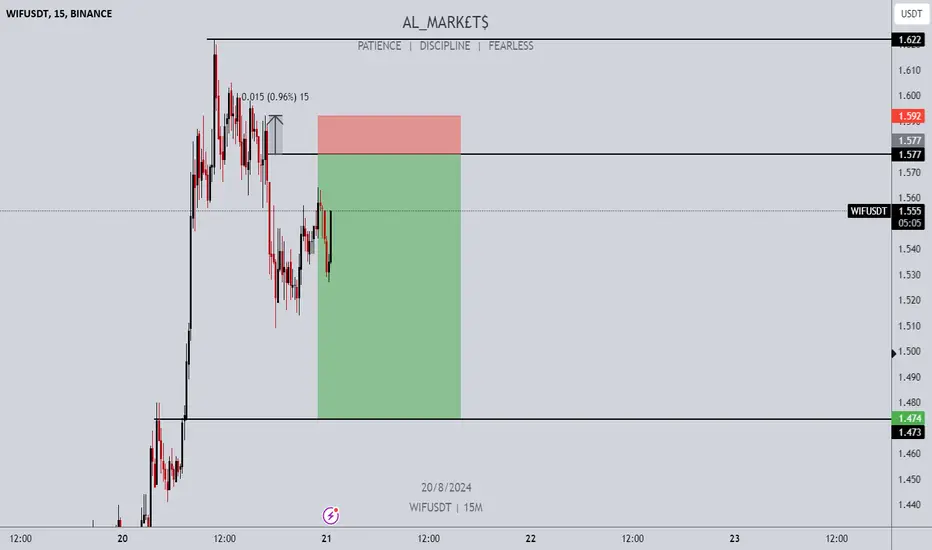
WIF - Bulls need to STEP UP here!Probably the best possible setup that has been presented in the last few days. I was looking forward to this recovery and retesting $1.5.
As long as it stays above the level, things will be bright. Below and I should start to cut the trade.
Momentum should build above $1.63, but I decided to take the trade now as I have a clear invalidation zone in case it turns against me.
WIF: Final tap to the bottom of the rangeTrying to keep this as simple as possible, as usual
Looking for adding to spot longs at the range lows. First tp at range hings. Final target at ath
Not much else to add.
nfa

WIFUSDT - Swing LongOn the opening of new week price took out breakout sellers and closed above weekly open = bullish sign. The high probable to see distribution upward.

Alikze »» WIF | Ascending wave 5🔍 Technical analysis: Ascending wave 5
- According to the analysis presented in the 12H time frame in the previous post , after not being able to break the supply zone, it followed a downward trend with a zigzag correction to the green box.
- But currently it is moving in a downward channel in the daily time frame, which after creating a demand in the green box range, has now faced a zigzag correction after an upward wave.
- Therefore, in the lower time frames, I expect a growth in the form of wave C to the ceiling of the channel after the break in the middle of the channel.
- According to the movement structure, this complicated zigzag corrective wave 4 seems to have ended.
- Therefore, if there is no stabilization under the green box area, we should see the channel failure.
💎 Also, corrective wave 4 should not overlap in the 0.53 cents area, in which case the bullish scenario will be invalidated.
»»»«««»»»«««»»»«««
Please support this idea with a LIKE and COMMENT if you find it useful and Click "Follow" on our profile if you'd like these trade ideas delivered straight to your email in the future.
Thanks for your continued support.
Best Regards,❤️
Alikze.
»»»«««»»»«««»»»«««
MEXC:WIFUSDT


Why is Solana's Dogwifhat (WIF) memecoin crashingWhy is Solana's Dogwifhat (WIF) memecoin crashing?
I will continue selling this shit coin
ENT: $1.4053
SL: $1.5131
TP: $1.1297

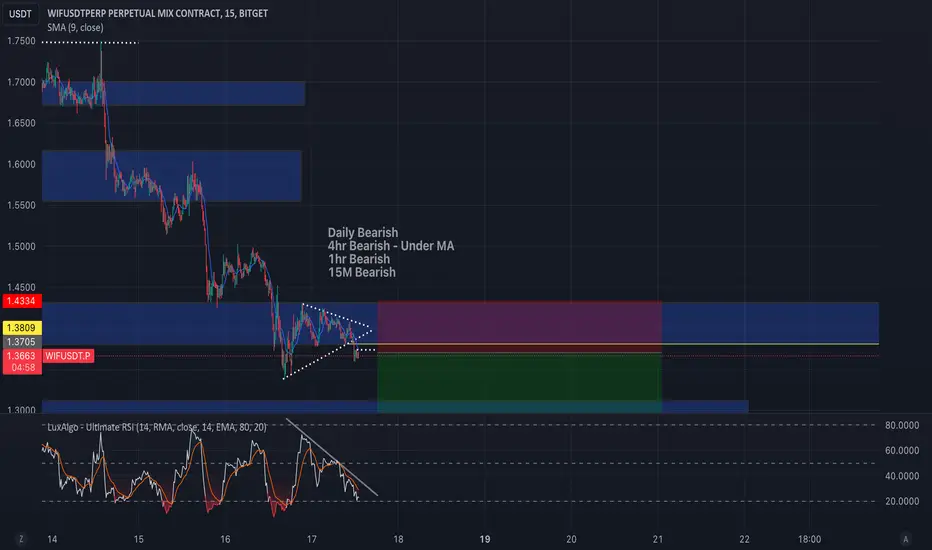
Bearish WIFUSDTThis Market Show Bearish Trend.
Daily Bearish
4hr Bearish - Under MA
1hr Bearish
15M Bearish
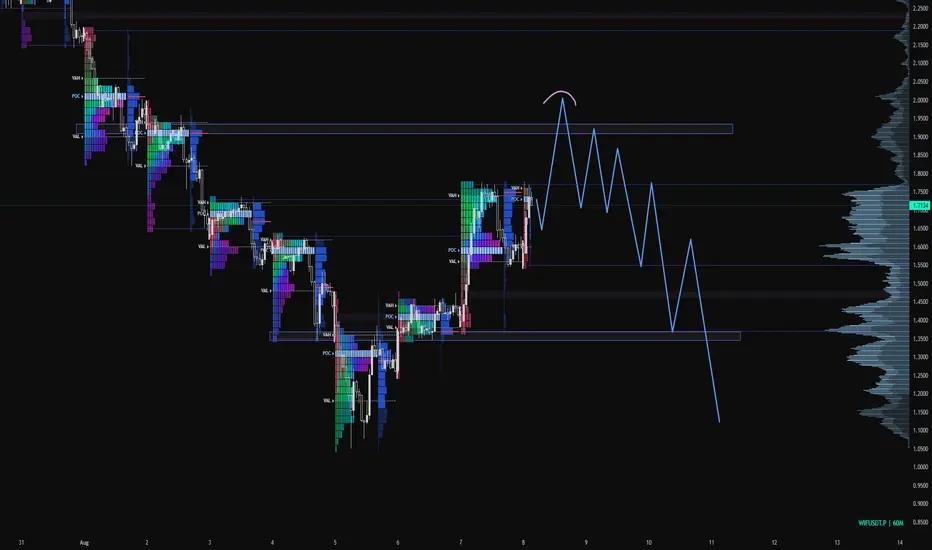
WIF — Strong Selling Pressure And About To Re-Visit $1.10 WIF is a perfect example of how volatile meme coins can be. A blessing for traders and nightmare for investors who bought the top.
Just a couple of days ago, WIF almost hit 3 dollars. And today? The dogwifhat is about to revisit its crucial support at $1.10.
So, let's have a look at the chart.
After touching the $1.1 support during the Black Monday Crash, WIF has started to recover.
However, when WIF printed an inverted U-shape, it quickly became clear that the recovery didn't look healthy. In addition, the sell pressure has been massive (check the chart).
Even worse, on Thursday, WIF fell below a crucial support at $1.55 and continued its downtrend.
Without support from the broader market (e.g., Bitcoin starts to pump like crazy), WIF will likely revisit the $1.1 support.
At this point, it will be interesting to see whether WIF will print a double bottom or is on its road toward <$1

OP reclaiming supportOP reclaimed its trend support and looking to play out and breakout soon
target around 2$
OP reclaiming supportOP reclaimed its trend support and looking to play out and breakout soon
target around 2$


Wif / Usdt BINANCE:WIFUSDT
Wif Pretty Decent To Buy That Area You Can Easily Understand What i My Chart Say To You Btc Need Some Rest Zone .
Disclaimer : I am Not Financial Advisor
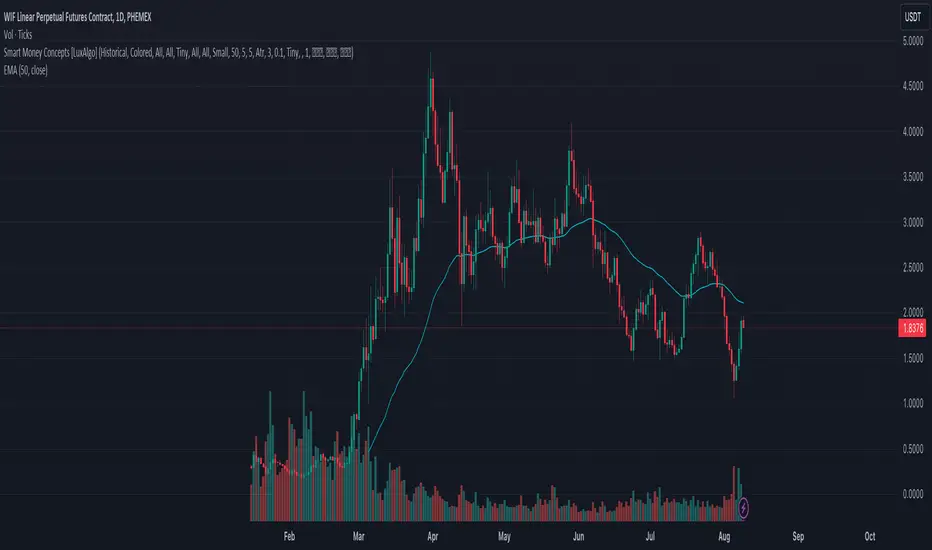
Phemex Analysis #13: WIF 63% & 86% Wild RIde!PHEMEX:WIFUSDT.P has exhibited extraordinary price action, plunging 63% from its recent peak and subsequently rallying 86% in a matter of days. Such dramatic swings highlight the inherent risk and reward associated with this asset.
Potential Price Scenarios
Given WIF's recent volatility, it's crucial to consider multiple price paths before making your trading decisions:
1. Bullish Continuation: If the current uptrend gains momentum, immediate resistance levels are at $2.0 and $2.35. However, a bearish macro environment could cap gains. Traders should monitor volume and RSI for confirmation of strength.
2. Potential Double Bottom: Alternatively, the price might form a second low around $1.0. Ideally, this low would be higher than the previous one, followed by a period of consolidation. A higher RSI compared to the first low could indicate a stronger base, making it a potential accumulation zone.
3. Bearish Breakdown: A decisive break below the $1.0 support with increased volume signals a potential significant downtrend. Given WIF's correlation with BTC, a sharp decline in Bitcoin could exacerbate downside risks. Exercise caution in such conditions.
Trading Considerations
Risk Management: Due to WIF's high volatility, implementing strict stop-loss orders is essential.
Leverage: Using high leverage in WIF trading can easily lead to liquidation. Carefully consider leverage to manage risk effectively.
Market Sentiment: Stay informed about overall market trends and sentiment, particularly Bitcoin's, as they can significantly impact WIF's price.
This analysis provide a potential outlook and trading consideration for WIF's price movement. However, it's essential to conduct thorough research before making any trading decisions.
Note: Pulse is offering $500 PULSE to all new Phemex users. Sign up for Pulse quickly!
Disclaimer: This is NOT financial or investment advice. Please conduct your own research (DYOR). Phemex is not responsible, directly or indirectly, for any damage or loss incurred or claimed to be caused by or in association with the use of or reliance on any content, goods, or services mentioned in this article.
WIF deez nutzGo outside and take a wif, the sun is shining. Buy WIF Coin, its worthless but at least hes wearing a hat.
Buy from 1.4 to 2.1.

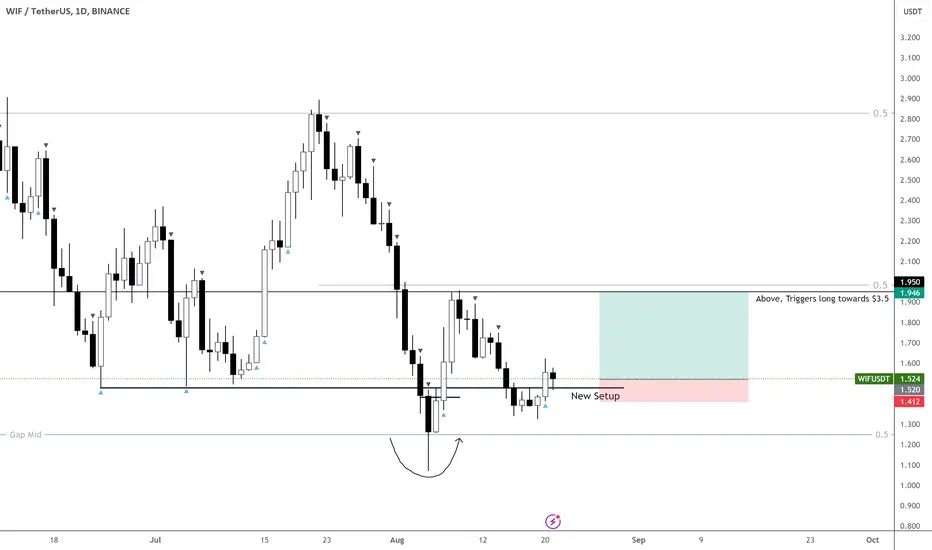
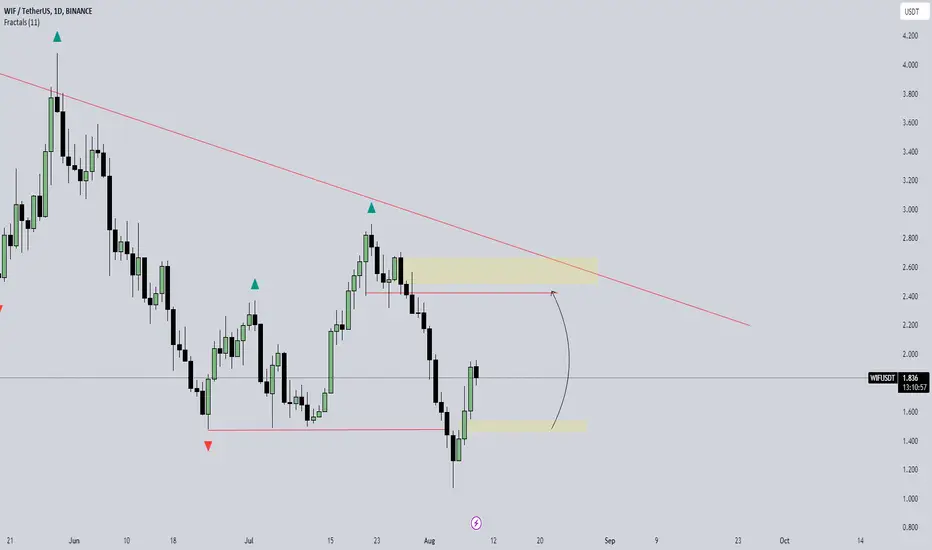
WIF — Trade Setups Don't Have To Be Complex!The current WIF chart provides a super straightforward picture. Overall, we have three areas to watch:
1️⃣ $1.5 — Main support level. The drop on Monday pushed the price below this level. However, WIF recovered quickly and is already back above!
2️⃣ $2.25 - $2.30 — The middle band that has been acting as support and resistance during the last 5 months.
3️⃣ $3.20 — The upper resistance of the channel. Breaking above this level is a crucial step to reaching a new ATH.
From a trading perspective, this is a rather simple setup. You don't need any technical indicators and can set up your strategy based solely on the support and resistance levels. Of course, it is crucial to set the stop loss slightly below the respective level.
As already mentioned, WIF has reconquered the lower support line. Accordingly, there is a good chance (especially when we see a confirmation today) that WIF is heading towards the middle band.
WIF Trade SetupWIF has recently shown strong performance, rising over 65% from its bottom at $1.08. Currently, the price is pulling back towards a key support zone at $1.50, which also represents a significant psychological level and a potential demand zone. This pullback offers an opportunity to enter a trade, with the expectation of a bounce from support.
Trade Plan:
Entry: Around the $1.50 support zone.
Take Profit: Targets set at $2.2 and $2.8.
Stop Loss: Placed at $1.36 to minimize downside risk.
This setup leverages the strong recent momentum of WIF while managing risk effectively. The trade is designed to capitalize on a potential bounce from the $1.50 support level, which has shown to be a key area of interest.

Could This Be the Next Bull Run for #WIFUSDT? Positive SignsYello! Are you ready to catch the next big move of the #dogwifhat? Let's look at the latest analysis of #WIF and see what's happening:
💎#WIF is currently showing promising signs of a bullish continuation from a crucial support zone at $1.36. We've been closely monitoring #WIFUSDT as it has been following a descending channel for quite some time.
💎Recently, it broke above the descending resistance and is now gaining momentum at this key support level. If the price holds strong at this level, there's a high probability of a bullish rally, similar to previous trends.
💎A breakout above the probable resistance at $2.01 could lead to targeting the next resistance zones and beyond.
💎However, if the momentum doesn't hold at the key support, we might see a bullish rebound from the lower demand area around $1.06.
💎It's crucial to stay vigilant and monitor #dogwifhat price movements closely. A daily closure below the demand area could invalidate the bullish outlook and potentially lead to further declines.
Stay vigilant and monitor #dogwifhat price movements closely.
MyCryptoParadise
iFeel the success🌴

$WIF ltf playHere's what I'm looking on lower timeframe (1-hour timeframe)
If we can hold $1.65 here, I'm expecting a deviation around $2, where I will be looking to short
There's a good support at $1.54 to $1.50 area, so we might get a reaction at this level retesting the supply zone
A break of $1.50 support, it could lead us down to $1.38 or even lower revisiting its local low
WIFUSDT(dogwifhat) Updated till 08-08-24WIFUSDT(dogwifhat) Daily timeframe range. PA got lots of space to move around but of course depends on market condition. retraced back from its local low 1.242. now trying to close over 1.651. it will be confirm after daily close if its stay valid.

Dogwifhat (WIF): Possible Zone of Rejection / Sell Off? Dogwifhat is looking interesting after a nice downward movement from the upper zones, resulting in a nice break in structure and a switch in trend.
We are looking here to see further rejection and weakness, which would dump the price back to lows of $1.12. From there on, we will be looking for price action and a possible bounce but who knows?
Swallow Team
