WIF: Key Levels and Buy StrategyThe trading volume is 438.706K WIF, indicating significant market activity.
Indicates a potential bullish trend with the SAR at $2.364.
The SMA is at $2.561, indicating that the current price is slightly above the moving average, which can be a bullish sign.
The histogram value is 0.008, MACD line is 0.008, and the signal line is -0.001, indicating a bullish trend.
%K at 79.49 and %D at 81.50, indicating near overbought conditions.
The RSI stands at 52.57, suggesting that WIF is in a neutral zone but with a bullish bias.
Market Sentiment
The market sentiment for WIF appears cautiously optimistic. While the Stochastic Oscillator indicates nearing overbought conditions, the MACD and Parabolic SAR suggest bullish momentum.
Potential Market Scenarios
Bullish Scenario:
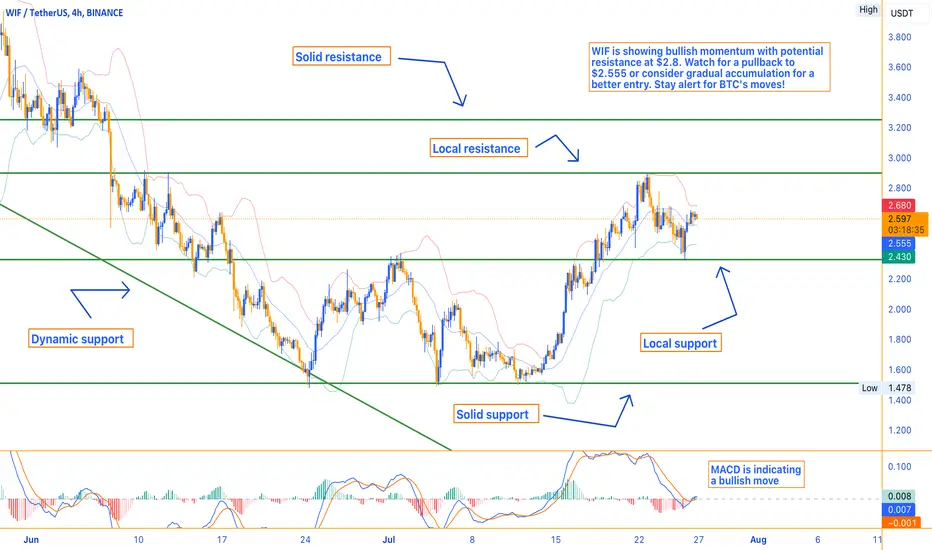
A decisive break above the local resistance at $2.8 could lead to further upward movement, targeting the solid resistance at $3.2.
Bearish Scenario:
If WIF fails to break above the local resistance, it could retest the support levels at $2.555 and $2.43. A break below $2.43 could signal further declines.
When to Buy WIF for Investment
Current Situation:
Given WIF's current price at $2.6 and the technical indicators suggesting potential overbought conditions, a cautious approach is warranted.
Optimal Buying Strategy:
Wait for a Pullback: Considering the Stochastic Oscillator indicating near overbought conditions, waiting for a pullback towards the local support level at $2.555 could offer a better entry point.
Solid Support Level: If the price drops further, the solid support at $2.43 is a strong level to consider for investment. Historically, WIF has found significant buying interest at this level, making it a safer entry point.
Gradual Accumulation: Alternatively, adopting a dollar-cost averaging (DCA) strategy by buying small amounts at regular intervals can mitigate the risk of market timing and take advantage of potential dips.
Conclusion and Market Outlook
WIF is currently positioned with significant support and resistance levels to watch. While technical indicators suggest potential overbought conditions in the short term, the bullish MACD and overall market activity suggest room for growth.
Impact of Bitcoin:
It's essential to note that Bitcoin (BTC) is currently at a crucial level. If BTC fails to surpass its all-time high and experiences a significant drop, it could negatively impact the broader cryptocurrency market, including WIF. Monitoring BTC's price action is vital for understanding potential risks to WIF's price movements.
WIFUST trade ideas
WIF#WIF Analysis
It Exactly hit the support zone and pumped
Now,
$2.320 is acting as a new current support,
From here we can expect a upside move

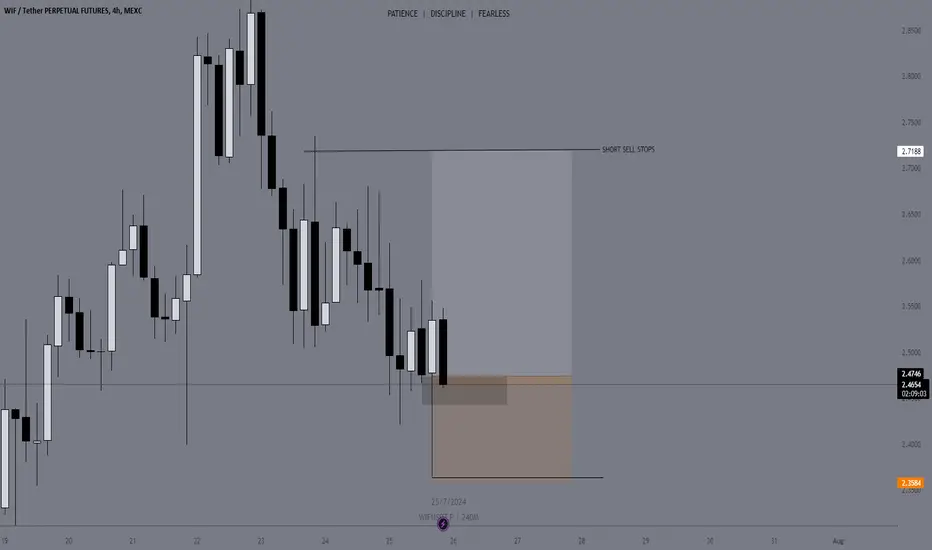
WIFUSDT.P - LONGHuge amount of sell stops resting above am expecting to take these out first before heading our way down as am long on btc as well. lets see what happens here


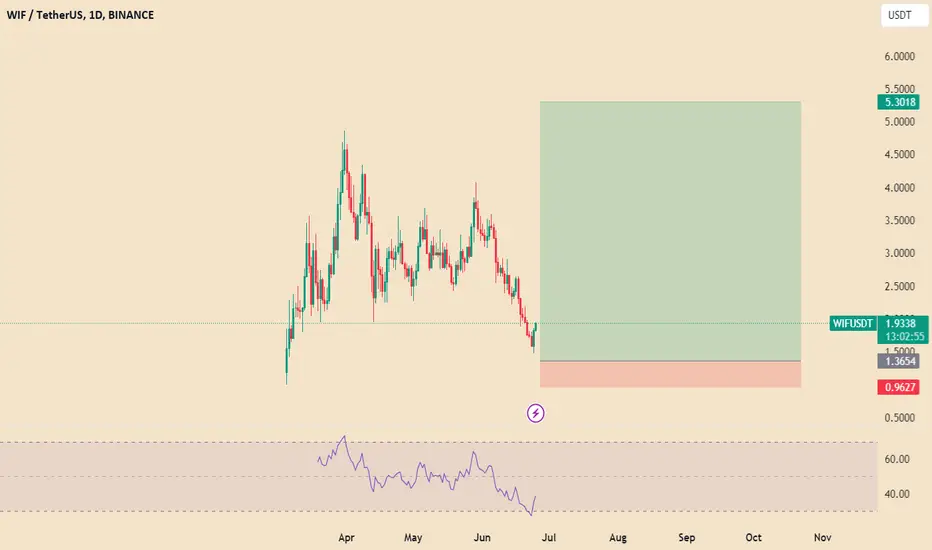
WIF LongWIF looks good to accumulate here, but im longing it at $1.35 targeting $5. These kinds of memecoins are risky to play with and i don't approve owning them for long periods.
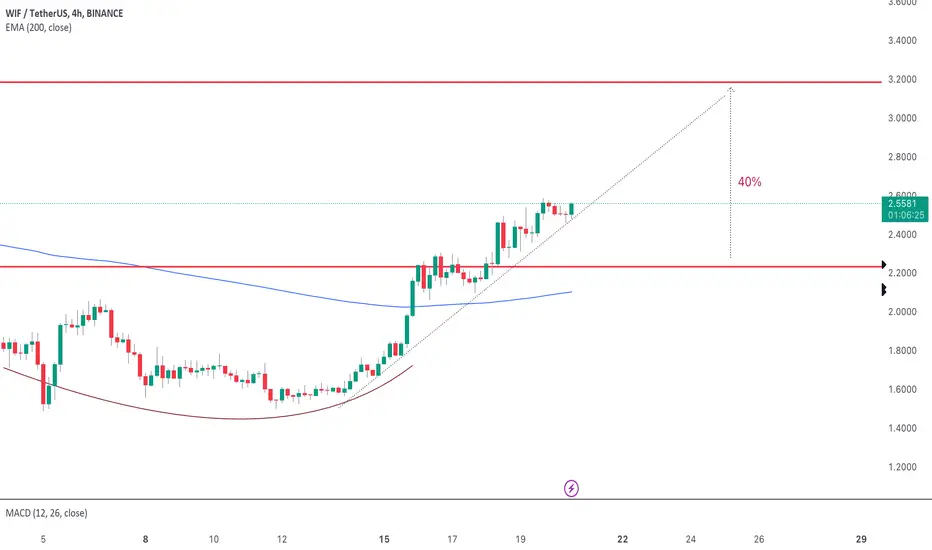
WIF — Following The Trend Line Towards $3.18As discussed in the last few days, WIF broke through the resistance at ~2.2. We've been waiting for this signal to enter a trade with the ultimate target of ~3.18.
So far, WIF is respecting and following the bullish trend that was one week ago. The latest candles on the 4H chart once again touched the trend and support line and bounced nicely.
Based on that, I expect a stronger push to the upside shortly. The ultimate goal of a price above $3 should be reachable at the beginning of the next week.
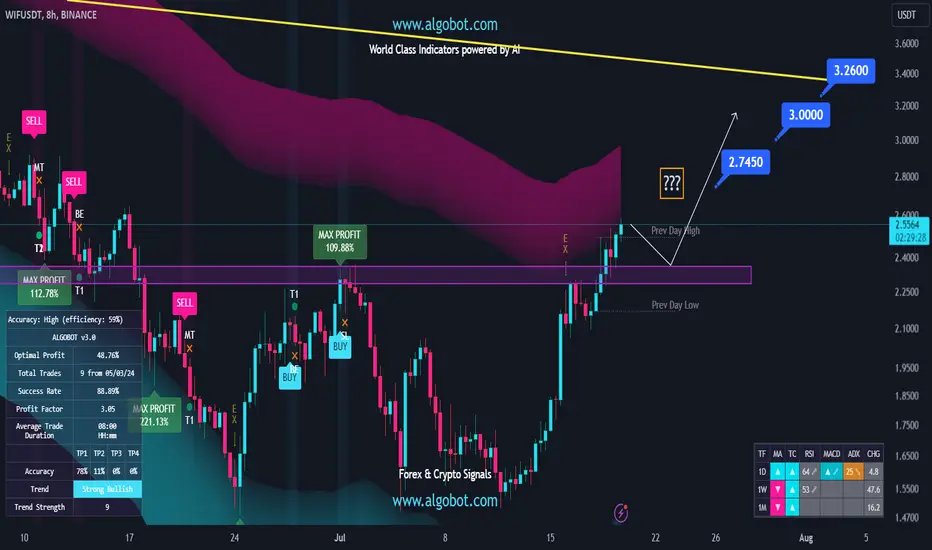
WIF 8H possible LONG/BUY setup (Short-term) - July 19 2024WIF doesn't seem to be bad for a small buy/long (Spot & Futures)
entry: 2.3 - 2.57
TPs: 2.745 - 3.00 - 3.26
SL: 2.29 (tight SL)
Max lev: 2x
WIF PriceIts price action indicates a follow-on recovery and buyers have started to accumulate the coin. Once it crosses its pivot of $2.50, further upswing toward the $3 mark can be anticipated soon.
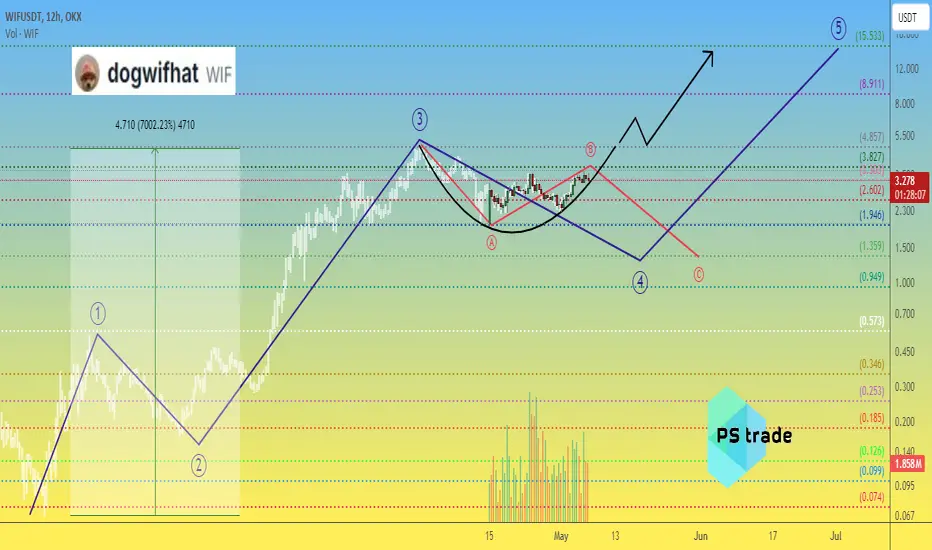
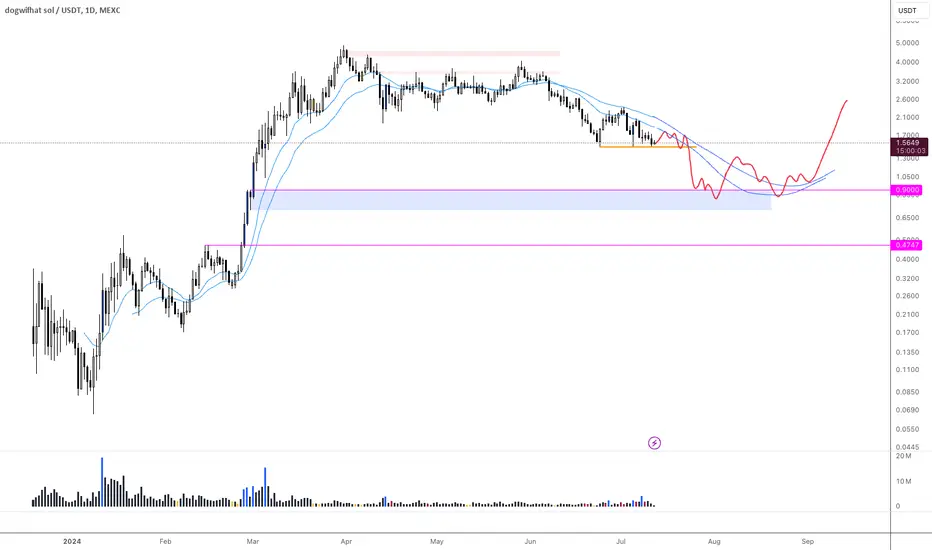
Dogwifhat WIF price looks like ... 👇Do you think the memecoin era has already passed or do they need to rest a little more before they can continue "show"?
The chart shows the global price movement of #WIFUSDT. Since the beginning of 2024, this asset has grown neither a little not a lot, just do +7000%)
Applying wave analysis to this coin, it seems to us that there need one more corrective wave down.
At $1.35, we might consider buying CRYPTOCAP:WIF , but at $3.30, we don't feel comfortable to buy.
Or are you saying that we are wrong and the price of #WIFUSDT will soon consolidate above $4.85 and head straight for $15 for #dogwifhat?)
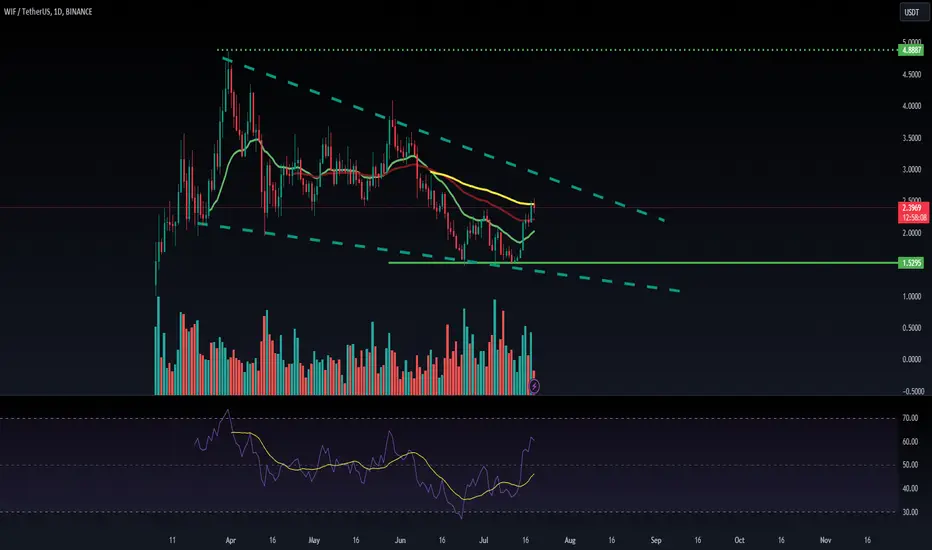
WIFUSDT Double BottomWIFUSDT Technical analysis update
WIF price is breaking the double bottom neckline on the daily chart, and the price has broken above the 100 EMA. We can expect a strong bullish move in the coming days.
Buy zone : Below $2.45
Stop loss : $1.97
Take Profit 1: $2.85
Take Profit 2: $3.60
Take Profit 3: $4.85

dogwifhat — We're Almost Ready To Roll — 40% Potential!
WIF is currently consolidating below its major resistance. Once this level breaks, the token should quickly rally 40%.
The details are based on chart analysis, technical indicators, and trade signals.
1️⃣ Chart Analysis
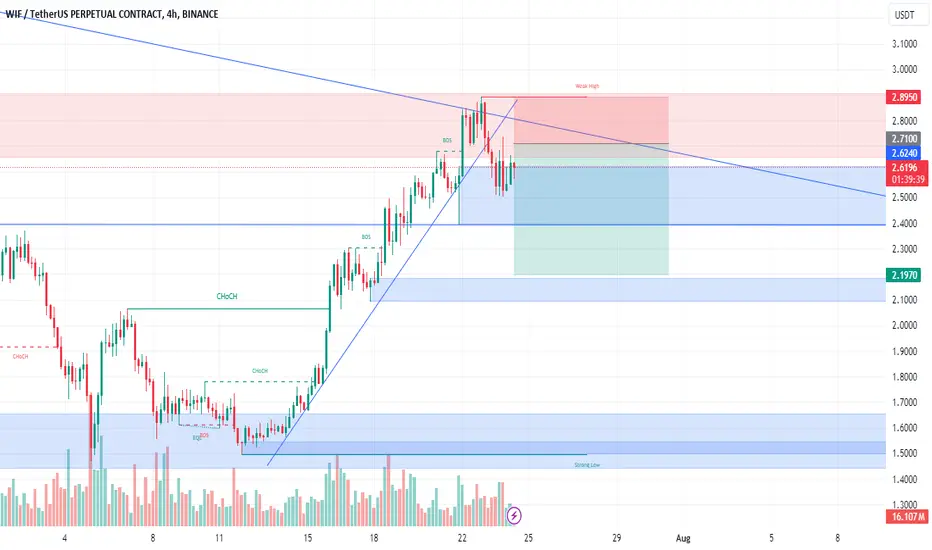
WIF has formed a double bottom at $1.5 and is currently facing resistance at ~$2.3, where it was rejected twice on the daily chart. Once this resistance breaks, WIF should rally towards the level of $3.20, resulting in a 40% profit potential.
2️⃣ Technical Indicators
Many momentum indicators have turned overbought due to the recent bounce of their local bottom. However, given the current consolidation below the 2.3 resistance, momentum indicators could quickly return to neutral zones. Trend indicators signal a clear bullish trend across all timeframes. Additionally, the ADX indicates a strong trend.
3️⃣ Trade Signals
On lower timeframes (4H & 1H), WIF flashed several bullish Power Scalper signals. These signals usually appear short before a correction/consolidation. Accordingly, this played out well. On the 1W timeframe, WIF printed a bullish MACD crossover, which further seconds the potential during the next days and weeks.
🚀 Trading Scenario
The most healthy and sustainable scenario requires a consolidation below the resistance for a day or two so momentum indicators can return to neutral zones. Afterward a push should break the resistance and lead to a rally toward $3.2
Therefore, from a trading point of view, an entry right above 2.3 seems solid.

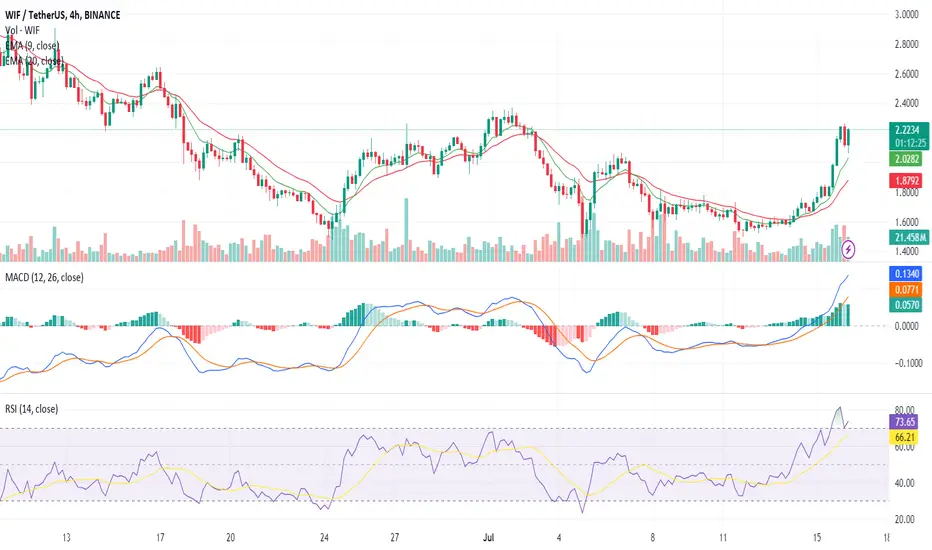
Dogwifhat Price Prediction: Bullish Signals You Can't IgnoreBINANCE:WIFUSDT shows a mixture of bullish and bearish signals, indicating potential volatility in the upcoming sessions. Closing prices reflect a recent uptick, peaking at $2.2397 before a slight pullback to $2.1553. This movement suggests that the price is struggling to sustain higher levels, facing resistance at $2.1663.
The 9 EMA and 20 EMA are trending upward, currently positioned at $2.0146 and $1.8727, respectively. This alignment indicates a bullish trend, as the shorter-term EMA is above the longer-term EMA, suggesting a positive momentum. However, the gap between these EMAs has been narrowing, hinting at a potential consolidation or minor correction phase.
MACD values further support the bullish sentiment, with both the MACD line and the signal line rising. Histogram values indicate increasing momentum, though the most recent histogram shows a slight decline, which could signal a weakening bullish trend or an upcoming reversal.
Meanwhile, the Relative Strength Index (RSI) has fluctuated, reaching a high of 81.66 before dropping to around 71.45. An RSI above 70 typically signals an overbought condition, suggesting that the asset might be due for a correction. The recent decline in RSI supports this possibility, indicating that the buying pressure is easing off.
The key resistance levels to watch are at $2.1663, $2.3171, and $2.4656. If the Dogwifhat price breaks and holds above $2.1663, it could target the higher resistance at $2.3171. A successful breach of this level might propel the price towards $2.4656.
On the downside, the immediate support levels are at $2.013, $1.9824, and $1.9624. If the price fails to maintain above $2.013, it might test the lower support at $1.9824. A break below this could lead to further downside towards $1.9624.
For long trades, a potential entry could be considered if the price breaks and sustains above $2.1663, with targets at $2.3171 and $2.4656. Stop-loss orders should be placed below the support at $2.013 to mitigate risk.
For short trades, an entry might be viable if the price drops below $2.013, targeting the supports at $1.9824 and $1.9624. A stop-loss above the resistance at $2.1663 would be prudent to limit potential losses.
The overall sentiment for the Dogwifhat price on the 4-hour chart leans bullish, given the EMA alignment and MACD trends. However, the high RSI and recent price pullback suggest caution, as a correction could be imminent. Traders should closely monitor the mentioned support and resistance levels for potential entry and exit points.
#WIF/USDT#WIF
The price is moving within a bearish channel pattern on the 12-hour frame, which is a strong retracement pattern and was broken to the upside.
We have a bounce from a major support area in green at 1.50
We have a tendency to stabilize above the Moving Average 100
We have a downtrend on the RSI indicator that supports the rise and gives greater momentum, and the price is based on it to rise after it was broken upward.
Entry price is 1.90
The first goal is 2.32
Second goal 2.68
Third goal 3.10

Fisher crossoverSimple new script I created for Fisher crossovers. Nothing is 100% accurate in trading but this seems to have a good hit rate. I like to confirm signals with DPO for added confidence.
Enjoy!

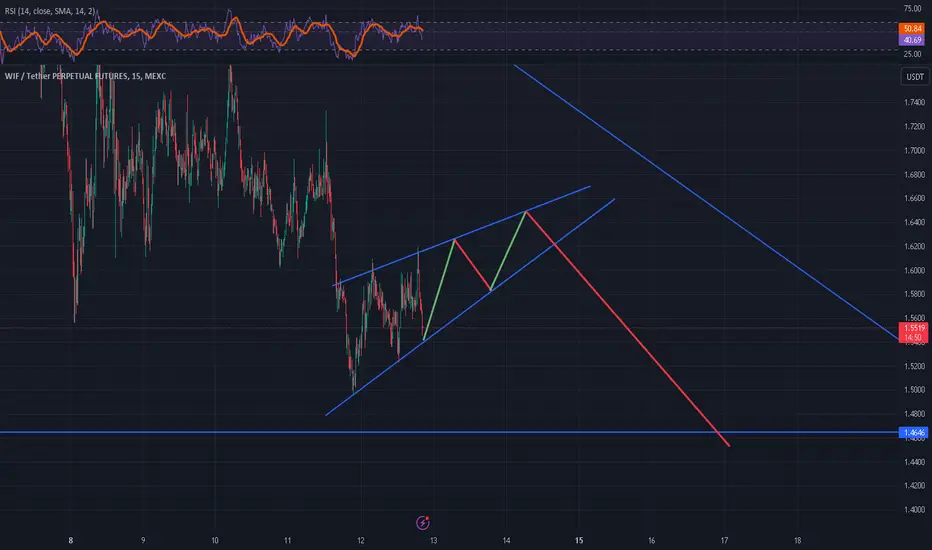
WIF will fall!Wiff will fall by Bearish Rising Wedge. Keep in mind that we will go up 2 times first before we go down.
This is no financial advice always DYOR.
$WIFMy WIF roadmap for this weekend.
Please dyor before take a position and make a decision
Always use stop loss whatever your position.

BULLISH ON WIF ..LOLIm bullish on Wif
the areas on the line are places we expect WIF to be at in a few days
Dogwifhat Price Analysis: Is a Reversal on the Horizon?Current price action for BINANCE:SOLUSDT suggests that the meme coin is facing strong resistance at $1.6809, with further resistance levels at $1.7204 and $1.8468. These levels represent potential barriers that the price must overcome to initiate a bullish reversal. On the downside, immediate support is observed at $1.5572, with a critical support level at $1.524. A break below these support levels could lead to further declines, signaling caution for traders considering long positions.
The 9 and 20 Exponential Moving Averages (EMAs) are currently positioned above the closing prices, reinforcing the bearish outlook. The downward slope of the EMAs indicates that selling pressure remains dominant in the market.
Meanwhile, the Moving Average Convergence Divergence (MACD) further confirms the bearish sentiment. The MACD line remains below the signal line, and the histogram continues to print negative values, suggesting sustained bearish momentum. This bearish crossover typically signals that the selling pressure could persist in the near term.
Relative Strength Index (RSI) values, hovering around the 30-40 range, indicate that the Dogwifhat price is approaching oversold conditions. While an RSI below 30 usually suggests a potential for a bullish reversal, the current readings imply that the price might continue to face downward pressure before any significant recovery occurs.
For traders looking to capitalize on the current market conditions, the prevailing bearish indicators suggest a cautious approach. Short positions could be considered if the price fails to break above the $1.6809 resistance level, with potential exit points around the $1.5572 and $1.524 support levels.
Conversely, for those anticipating a bullish reversal, it would be prudent to wait for confirmation of a break above the $1.6809 resistance level before entering long positions. A successful breach could pave the way for targeting higher resistance levels at $1.7204 and $1.8468, with stop-loss orders placed just below the $1.5572 support to manage risk.
The current technical outlook for the Dogwifhat price on the 4-hour chart suggests a bearish trend, with significant resistance levels limiting upward movement and technical indicators pointing to continued selling pressure. Traders should exercise caution and consider both the potential for further declines and the possibility of a bullish reversal when planning their trades.
Disclaimer: The information presented in this article is for informational and educational purposes only. The article does not constitute financial advice or advice of any kind. Ecoinimist is not responsible for any losses incurred as a result of the utilization of content, products, or services mentioned. Readers are advised to exercise caution before taking any action related to the company.

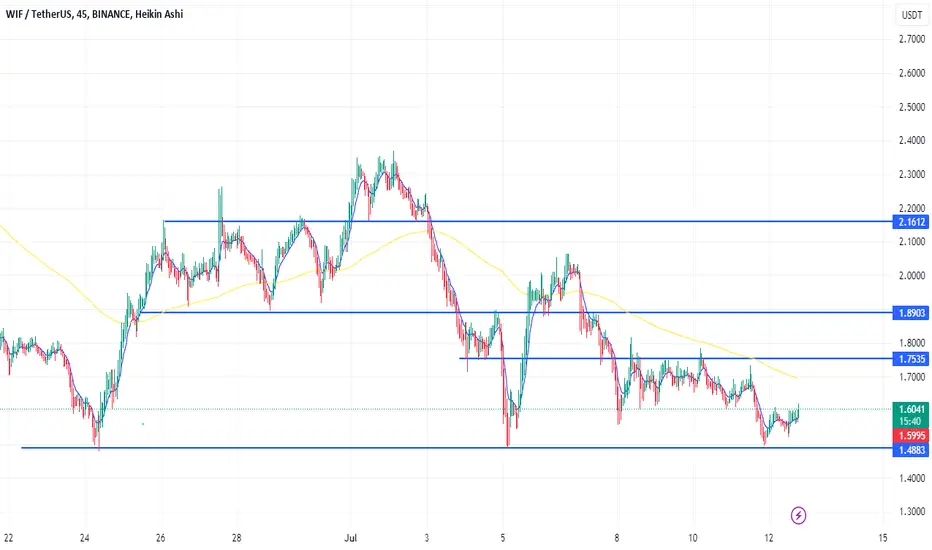
WIF summer accumulationSome chart patterns and what I would like to see to be confident in a hold for the H2 of the crypto bull market.
WIF Trade Setup#WIF in the hourly timeframe is holding support at $1.655. A bounce back, followed by a breakout above the $1.77 resistance, will most likely set a bullish trend aiming for a decent 20% gain.
- Entry: $1.655 to CMP.
- Stop loss: $1.5448.
- Leverage: 3x to 5x.
- Targets: $1.77, $1.87, $1.98, $2.05.
Make sure you do your own research before investing.
Regards,
Team Dexter.
#wif #cryptomemes

WIF Plan**WIF** is looking good here. It's getting support on the daily timeframe and showing upward momentum. You can take an entry with a small stop-loss (SL). If the SL is hit, then the next level is mentioned.
