WLDUSDT.PS trade ideas
Worldcoin Price Analysis Shows Bearish Trend on 4-Hour ChartAs of the latest analysis, BINANCE:WLDUSDT exhibits intriguing patterns on the 4-hour chart, suggesting potential market movements and trading opportunities. This comprehensive technical analysis delves into key indicators and levels that could influence the pair's trajectory.
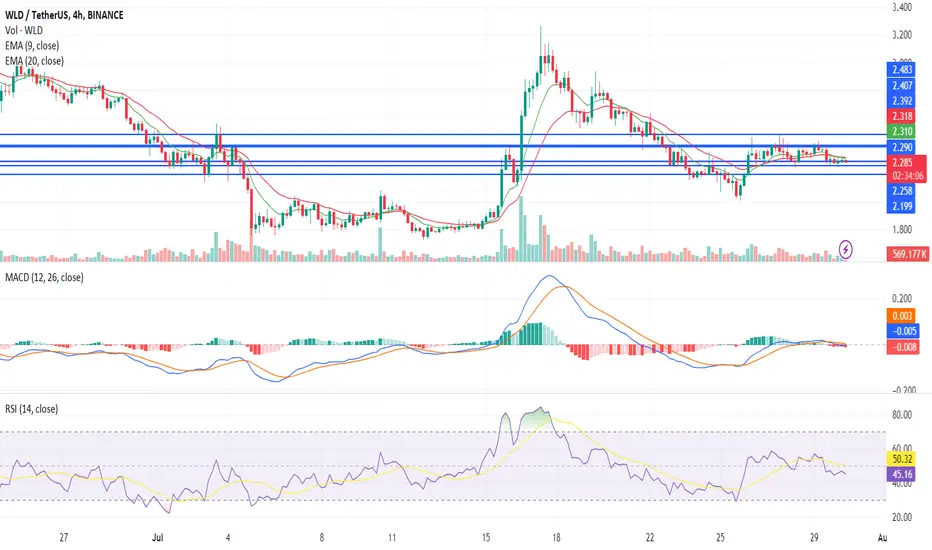
WLD's recent closing prices indicate a slight decline, with the crypto trading between $2.297 and $2.307. This sideways movement suggests a period of consolidation as the market tries to find direction. The 9 EMA stands at $2.312, while the 20 EMA is at $2.319, showing a bearish crossover, which typically signals potential downward pressure in the short term.
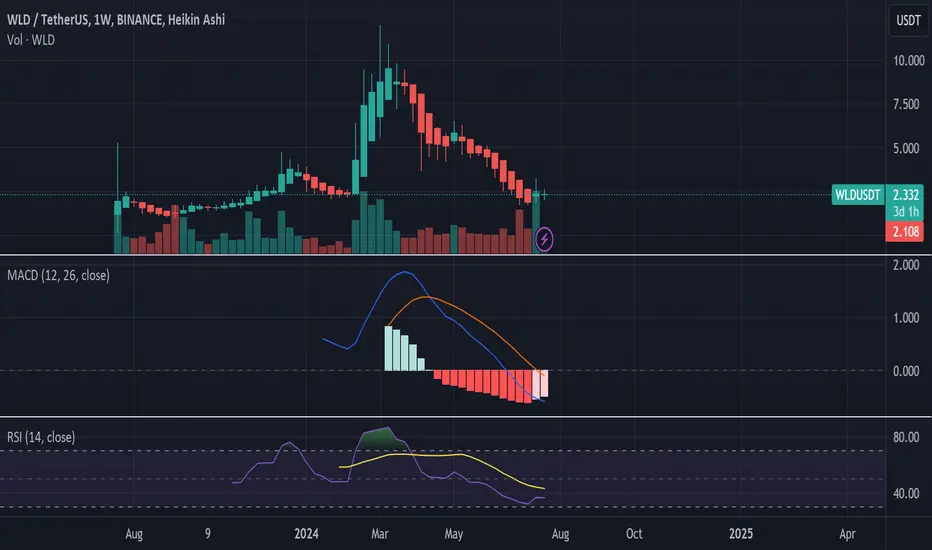
Meanwhile, the Moving Average Convergence Divergence (MACD) indicator shows a bearish trend with the MACD line below the signal line, evidenced by negative histogram values. This bearish divergence suggests that selling momentum may be increasing. Similarly, the Relative Strength Index (RSI) is hovering around 47, indicating that the pair is in neutral territory but leaning towards bearish sentiment. The RSI's position below 50 implies that sellers have a slight edge, though it’s not in oversold territory, leaving room for further downside.
Analyzing the support and resistance levels, the Worldcoin price faces immediate resistance at $2.392, with further resistance levels at $2.407 and $2.483. These levels are crucial for the bulls to overcome to regain control and push the price higher. Conversely, the support levels to watch are $2.29, $2.258, and $2.199. A break below these support levels could signal a continuation of the bearish trend, potentially leading to lower prices.
For traders looking to enter the market, it is essential to consider both long and short trading opportunities. A potential long entry could be considered if the Worldcoin price manages to break above the immediate resistance at $2.392, with a target at the next resistance level of $2.407. However, caution is advised as the bearish indicators suggest that a false breakout could occur.
On the short side, entering a position below the support level of $2.29 could be prudent, targeting the next support at $2.258. This strategy aligns with the current bearish sentiment indicated by the MACD and RSI.
In conclusion, the Worldcoin price is currently exhibiting bearish signals, with key technical indicators suggesting a potential downside. Traders should closely monitor the support and resistance levels and be prepared for potential market shifts.
WLDUSDT Analysis WLD - Technical analysis
Open interest in WLD increasing massively, which means more participation of traders entering long positions and volume also increasing.
That is the reason , if you see quick pump from that coin to first red box area.
I have put next bearish/bullish liquidity zones (red/green box for buying/selling opportunity)
Next sell area for take profits,
3.2-3.6
4.4-4.8
7.4-8.2
Cut down your positions if this drops below 1.5-1.8$ region.
DYOR.

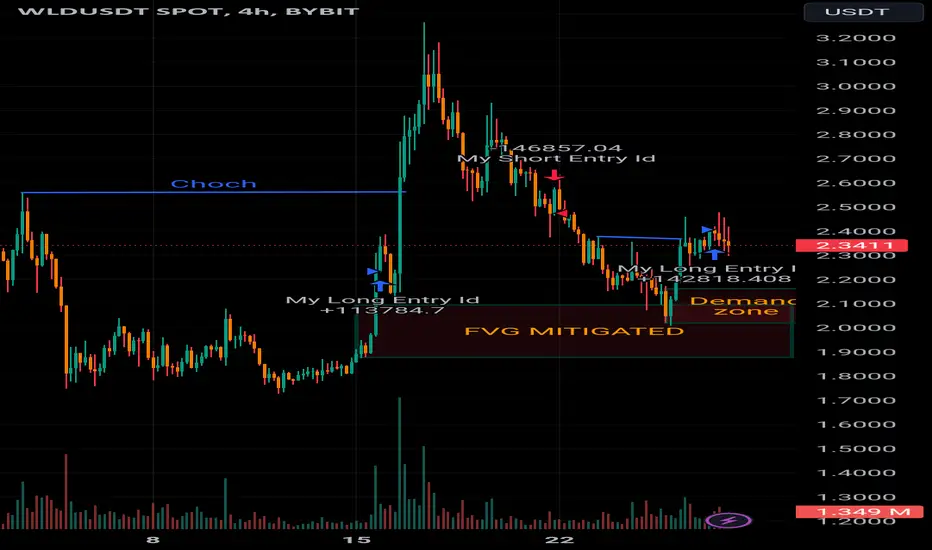
WLD/USD ANALYSIS Price changed character as seen on the 4 hours chart and tapped into the FVG......
Anticipating a more bullish movement after clearing liquidity below taking the 1hr demand /FVG.......
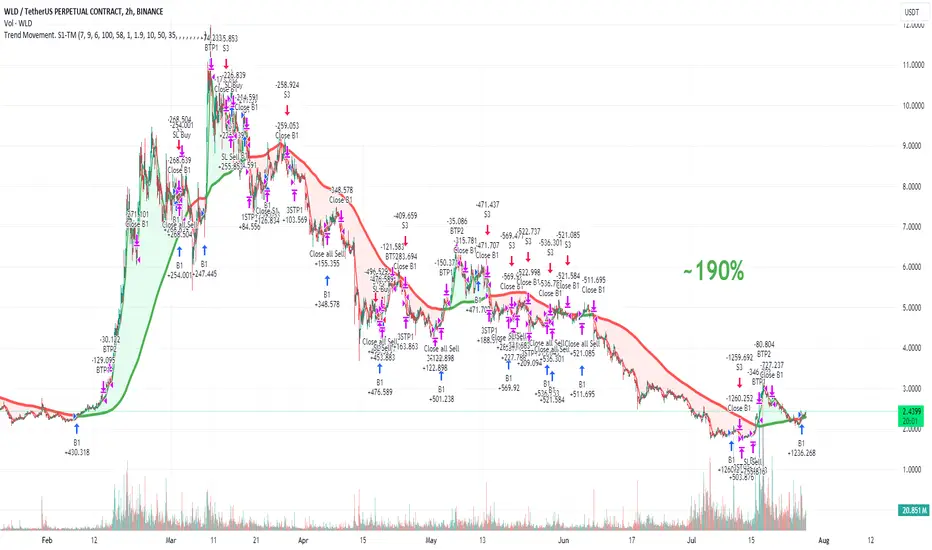
WLD perfomance 7 months in 2024We have seen a sharp decline in altcoins recently. Including WLD. Looking at the whole process, WLD had a very strong price increase and then fell again. What are the buying and selling points? With the S1-TM strategy, we had 48 closed orders s, with a net profit of ~190% (including commissions). This is quite acceptable for autotrade.
NOTE: This is my personal opinion on this strategy. This is not investment advice!!!. The market always has risks and opportunities. Please consider carefully before making any decision!
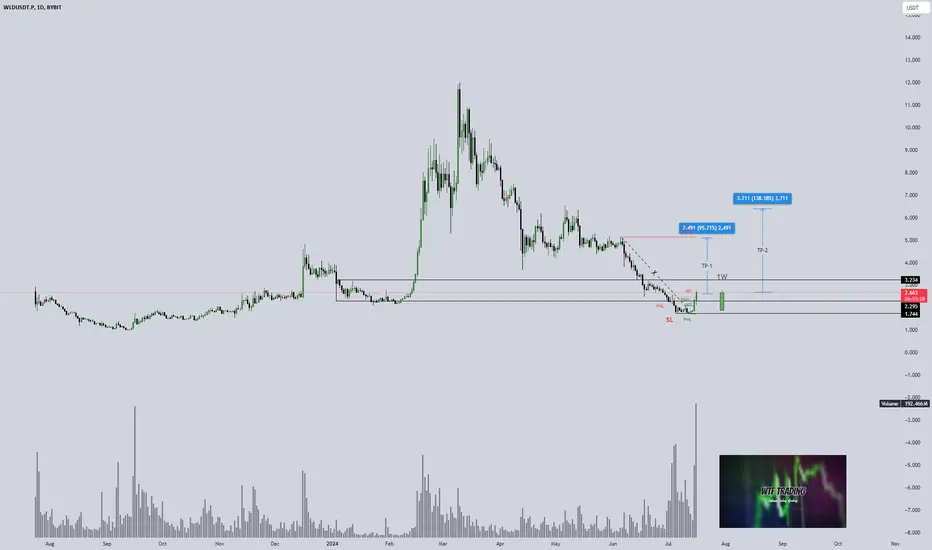
WLD - Big structure change with 200% oi riseWLD - Big structure change with 200% oi rise
In a video i shared with you my WLD plans why we bought it on PSOT and bi g Open interest increase
We`ll take LONG on Futures after clear SL hunt
with targets
1st - $3.3
2nd - $4.8
3rd - $6.6

WLD - OI is HUGE 200% riseWLD - OI is HUGE 200% rise
that's why i think big move would happen
With my team we expect big rise but for that we need clear pattern for entry
it could be
- structure change or big volume spike at VAL
In both cases we wait
What's your plan?

$WLD Swing LongMIL:WLD Bullish Idea
- Potential Breakout from Wedge
- Support at previous yearly VWAP
- Targeting previous quarter VWAP at 3.55

Worldcoin Price Plummets, Critical Support Levels Under ThreatIn the latest technical analysis of BINANCE:WLDUSDT on the 4-hour chart, there has been a notable interplay between price movements and key technical indicators, shedding light on potential market trends and trading opportunities.
Closing prices for WLD have shown a downward trend, with the most recent price standing at $2.186. This decline is further accentuated by the 9 EMA, which has consistently trended below the 20 EMA, indicating a prevailing bearish sentiment. The current 9 EMA of $2.211 is significantly lower than the 20 EMA of $2.282, suggesting sustained selling pressure.
MACD analysis supports this bearish outlook. The MACD line has remained below the signal line, although the histogram indicates a decreasing bearish momentum with values like 0.002056, suggesting a potential for a trend reversal if this pattern continues.
RSI values, hovering around 37.43, also point to a bearish market. An RSI below 40 typically signals that the asset is nearing oversold conditions, which might attract buyers and result in a price correction.
Given the current technical setup, the Worldcoin price is likely to encounter resistance at the $2.251 level. A break above this could pave the way for a move towards the next significant resistance at $2.483, and eventually, $2.745 if bullish momentum builds.
On the downside, immediate support is found at $2.178. If this level fails to hold, we could see a drop to the lower support levels of $1.835 and potentially $1.821, which are crucial for preventing a further decline.
For traders considering long positions, a potential entry point could be around the $2.178 support level, with a target towards the $2.251 resistance level. This strategy should be accompanied by a stop loss below $2.178 to mitigate risks from further bearish movements.
Conversely, those looking to short the market might consider entering around the $2.251 resistance level, with targets set at the $2.178 support level, and further down at $1.835 if the bearish trend persists. A stop loss above $2.251 would help manage potential losses from unexpected bullish reversals.
In conclusion, while the technical indicators for the Worldcoin price currently suggest a bearish market, there are potential opportunities for both long and short trades depending on key support and resistance levels. Traders should closely monitor these levels and indicators for any signs of trend reversals or continued momentum.

WLD to shortWld is traveling in a descending channel. one can short from 2.4800.
Tp 1 : 2.345
Tp 2 : 2.1380
Stoploss :2.6670
Follow for more

#WLD/USDT#WLD
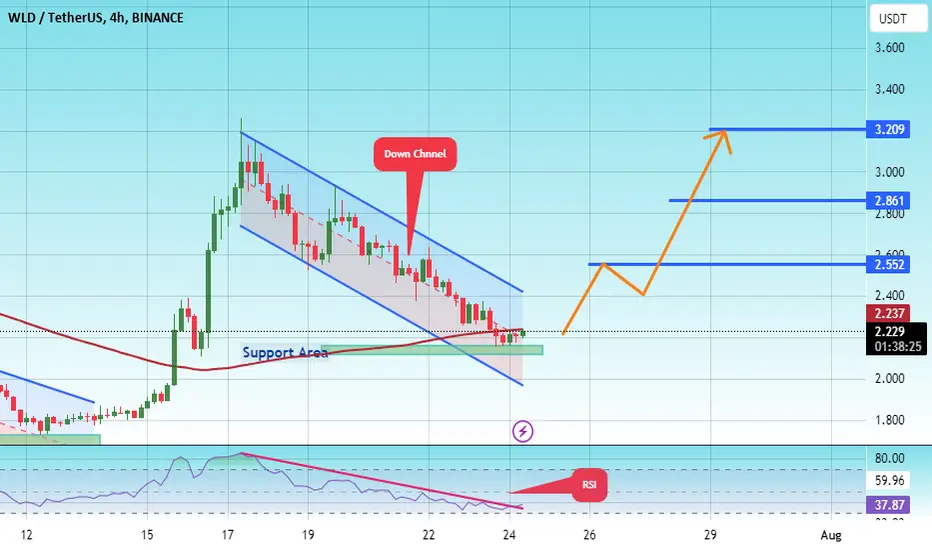
The price is moving within a bearish channel pattern on a 4-hour frame and broke it upward after adhering to it significantly.
We have a downtrend on the RSI indicator, and it has been broken to the upside, and we have a trend to hold above
We have a major support level in green at 2.10
We have a trend of domes above the Moving Average 100
Entry price 2.22
The first target is 2.55
Second goal 2.86
Third goal 3.20
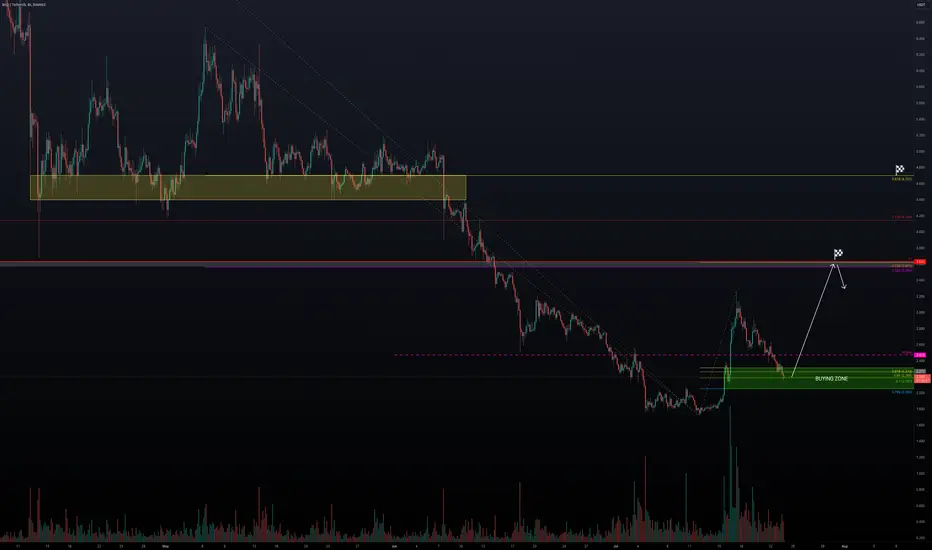
WLDUSDT - Setting Up for the Next Bullish Move?Are the bulls back? With price rising by 89% in just 5 days. Let's now analyse the present retracement and our next Trade.
Bullish Run: During our previous bullish run, we witnessed high volume entering the market, which resulted in an 89% price increase in just 5 days.
Price Retracement: At this point, the price has retraced 34%, putting us in a fantastic purchasing position.
Long Trade Setup: Watching for Bullish Momentum
1.) Volume Monitoring:
Bullish Momentum: It is important to observe the volume carefully for indications of a resurgence of bullish momentum.
Range Formation: To provide a strong base for the following move, some consolidation or a range would be good.
2.) Buying Zone:
Entry Area: Exactly in line with important support levels, our buying zone is between $2.30 and $2.00.
3.) Target Levels:
Yearly Level and Fibonacci Confluence: The Fibonacci 0.382 and the negative Fibonacci 0.234 coincide to the yearly level, which is our first target region for profit taking.
Main Target: The Fibonacci 0.618 level, or roughly $4.70, continues to be the primary target for the long position. Here is the previous trading range where the price fluctuated for more than 56 days.
Strategy: Executing the Long Trade
Primary Entry: Enter a long trade within the buying zone of $2.30 to $2.00.
Volume and Price Action: Monitor the volume and price action closely to confirm bullish momentum.
Target Profits:
Initial TP: Aim for the yearly level and Fibonacci confluence area as the first take profit zone.
Main TP: Set the main take profit target at the Fibonacci 0.618 level around $4.70.
Fibonacci remains one of my favourite tools for indicating where to buy and take profits, a simple yet powerful tool.
What are your thoughts on this analysis? Are you ready to go long on WLD? Share your thoughts down below.
WLDUSDT reversal possibilityTrend Lines and Patterns:
The chart shows a descending yellow trend line indicating a downward trend.
There is an upward channel marked by a series of blue and orange arrows, suggesting a potential reversal and upward movement.
Support and Resistance Levels:
Key support levels are marked in red around 2.1932, 2.0727, and 1.8819. These are prices where the asset found buying interest and bounced back up.
Key resistance levels are marked in green at 2.4625, 2.2989, 3.5857, 3.7512, and 5.4107. These are prices where selling interest might increase and could potentially halt upward movement.
Potential Price Movements:
The chart suggests a bullish outlook with a projected rise to the green resistance levels at 3.5857, 3.7512, and 5.4107.
The blue rectangle and the percentage (186.38%) indicate a possible target move to 5.4107, which represents a significant increase from the current price of 2.1941.
Price Analysis:
The price has recently broken above the descending trend line, indicating a potential trend reversal.
If the price continues to follow the projected path (blue and orange arrows), it could encounter resistance at the identified levels before potentially moving higher.
In summary, after a significant downtrend, WLD/USDT may be preparing for a bullish reversal, aiming for the higher resistance levels, with a potential substantial price increase if the bullish momentum continues.

WLD COIN PRICE ANALYSIS AND POSSIBLE TRADE SETUPS IDEAS!!MIL:WLD Coin Update !!
•WLD Coin two strong support areas 2.15$-2.05$ & 1.75$-1.65$ are clearly mentioned on a chart where you guyz able now to Find strong Trade setup🔥
I am expecting now bounce back in its price if markete now get little bit stabl🫡
follow us for more free analysis and trade setups !!

Worldcoin Price Analysis Reveals Potential Bullish BreakoutBINANCE:WLDUSDT has shown varied action over the past trading sessions. Recent closing prices have displayed a mix of upward and downward movements, highlighting a market that is currently in a consolidation phase. Despite the lack of a clear trend, examining key technical indicators can provide valuable insights for potential trading opportunities.
Focusing on key resistance and support levels, the first major resistance level to watch is $2.483. A break above this level could signal the beginning of a bullish trend. If the price moves past $2.483, the next significant resistance point at $2.745 could come into play, leading to substantial upward momentum. The upper resistance level at $2.78, if surpassed, might confirm a strong bullish reversal.
On the downside, the initial support level is at $2.258. Holding above this can prevent further downward pressure. A critical support level is found at $2.199, and a drop below this could accelerate the selling pressure. The lower support level at $1.835 may act as a strong defensive line against further declines.
Examining the Exponential Moving Averages (EMA), the 9 EMA currently trends below the 20 EMA, indicating a bearish sentiment in the short term. The prices hovering around these moving averages suggest a market in flux, waiting for a decisive move. Should the 9 EMA cross above the 20 EMA, it could be a signal for a bullish shift.
The Moving Average Convergence Divergence (MACD) values indicate a bearish trend, as the MACD line remains below the signal line. However, the histogram shows diminishing negative values, hinting at a potential slowing of bearish momentum. Traders should watch for a possible bullish crossover, which could signal a good entry point for long positions.
The Relative Strength Index (RSI) levels, hovering between 33 and 42, reflect a market that is approaching oversold conditions but is not yet there. An RSI below 30 would typically indicate a stronger buy signal, while a movement above 70 would indicate overbought conditions.
For those considering long positions, waiting for a break above the $2.483 resistance level could be prudent. This level acts as a potential entry point, with the target set at the next resistance at $2.745. A stop-loss order below the $2.258 support level could help mitigate risks.
Traders looking to short might consider entering around the $2.483 resistance level if the price fails to break above it convincingly. The first target could be the support level at $2.258, with a more aggressive target set at $2.199. Placing a stop-loss just above the $2.483 resistance can help protect against unexpected bullish moves.
WLD exhibits a blend of bearish and consolidative signals. The market is poised for potential movements, with key resistance and support levels providing guidance for traders. Monitoring these levels and the behavior of technical indicators can help in making informed trading decisions.

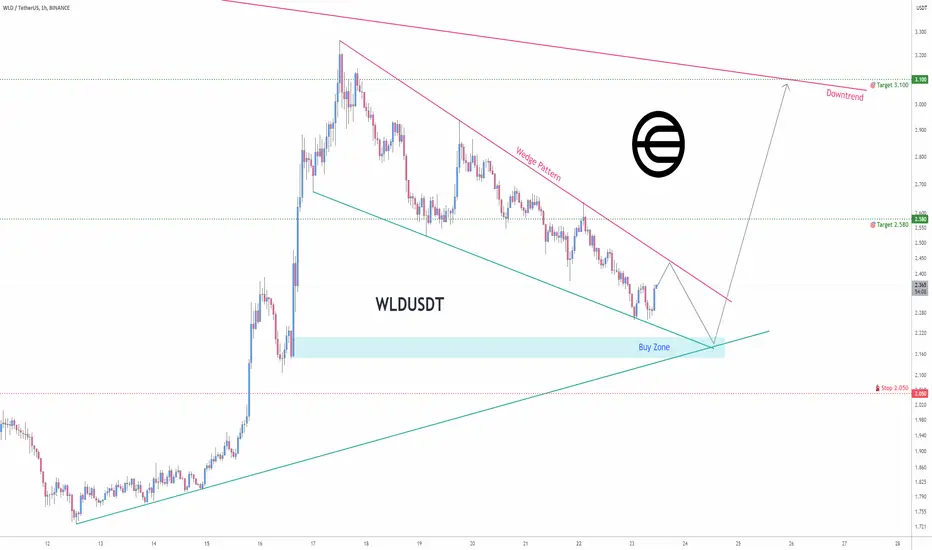
Trading opportunity (Wedge Pattern) for WLDUSDTBased on technical factors there is a Buy position in :
📊 WLDUSDT
🔵 Buy Now or Buy Zone
🪫Stop loss 2.050
🔋Target 1 2.580
🔋Target 2 3.100
💸RISK : 1%
We hope it is profitable for you ❤️
Please support our activity with your likes👍 and comments📝
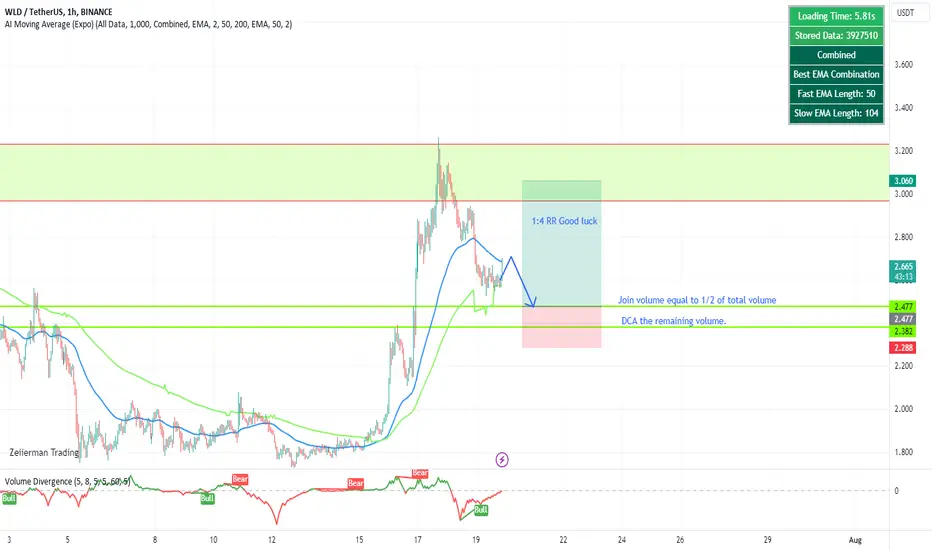
LONG WLDthis analyze is for a mid term trade that all the thing such as 2 point of entry, target and stop loss are shown in the picture.
don't forget the risk and capital management.

#WLD The chart is looking good for recovery"WLD, a cryptocurrency, has shown significant growth. However, at the current time, the price will probably experience a slight decrease."
Look at chart and order.
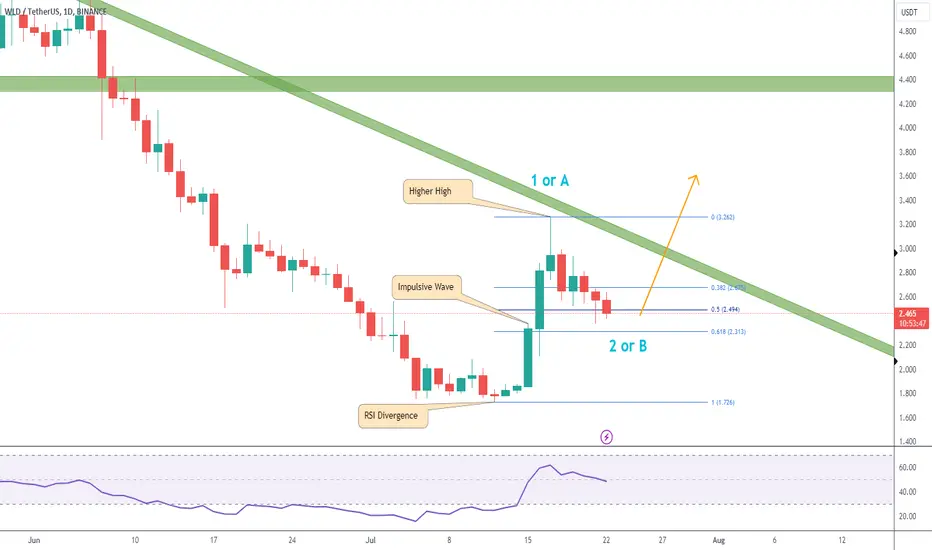
WLD aiming for another leg up
We have 3 important elements for a reversal:
- RSI divergence
- An impulsive wave
- A Higher High
The correction could be wave 2 or B, but in any case I expect short term highs soon.
Note that the green descending trendline could act as resistance, so let's keep an eye on that.
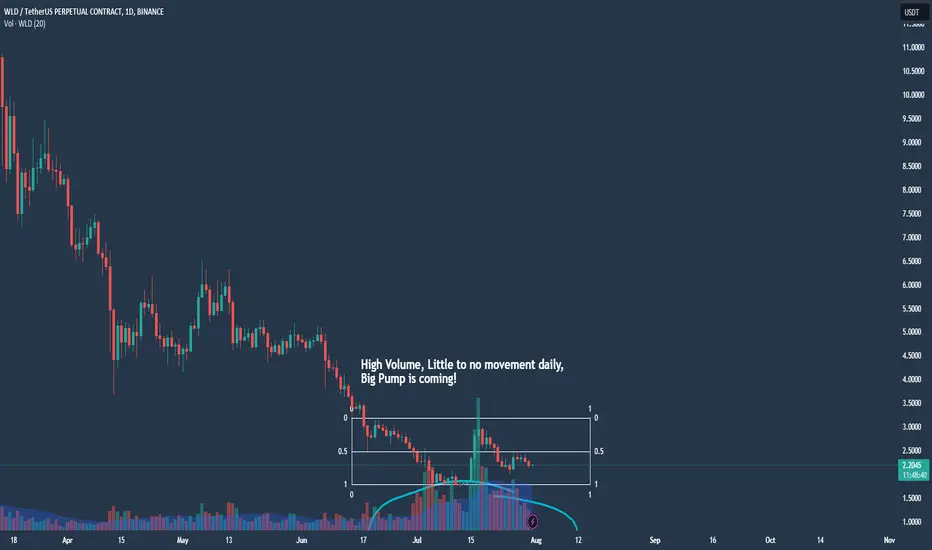
WLd Big PUMP is COMING!WLd Big PUMP is COMING!
Price started ump as i mentioned in a previous video
Main reason - Open interest increased by 100%
I think rise would go on
1st target - $3.2
all other target uYou will find in a video

WLD Pumped by 86% as plannedWLD Pumped by 86% as planned
that's a 1st target time to close 30%
next target $5
Better if price create a consolidation before new move
watch full plan

WLD/USDT LongBYBIT:WLDUSDT.P
This idea has a long-term profit target.
All targets are indicated on the graph.
- Risk 1-3% on deposit
- R/R min 1/2
P.S (This is not an investment recommendation, this is my personal opinion.)