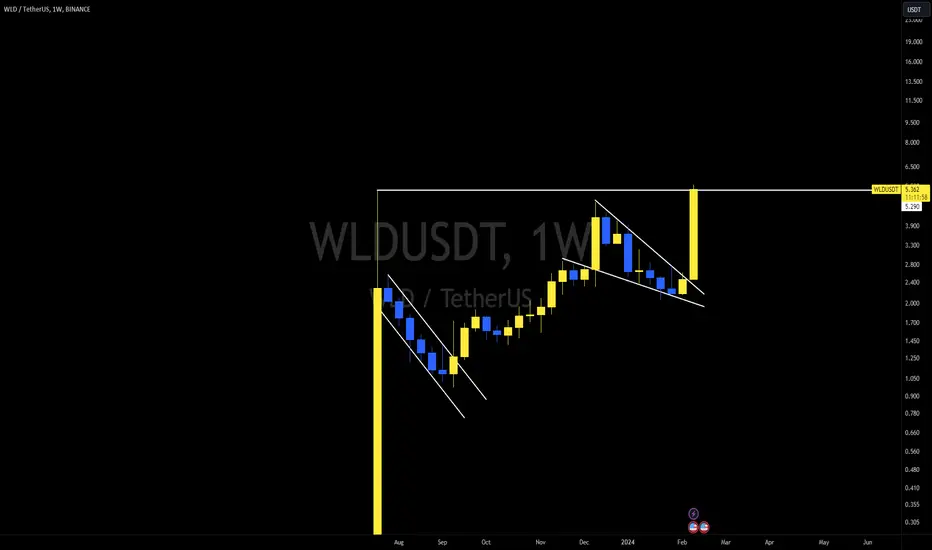
WLD with one of the biggest bullish impulseMIL:WLD next breakout setup is here, breaking all time high!✔️
Can see target of 10$ pretty easy here! Short term targets are 6$ and 8$ though! 📈
WLDUSDT trade ideas
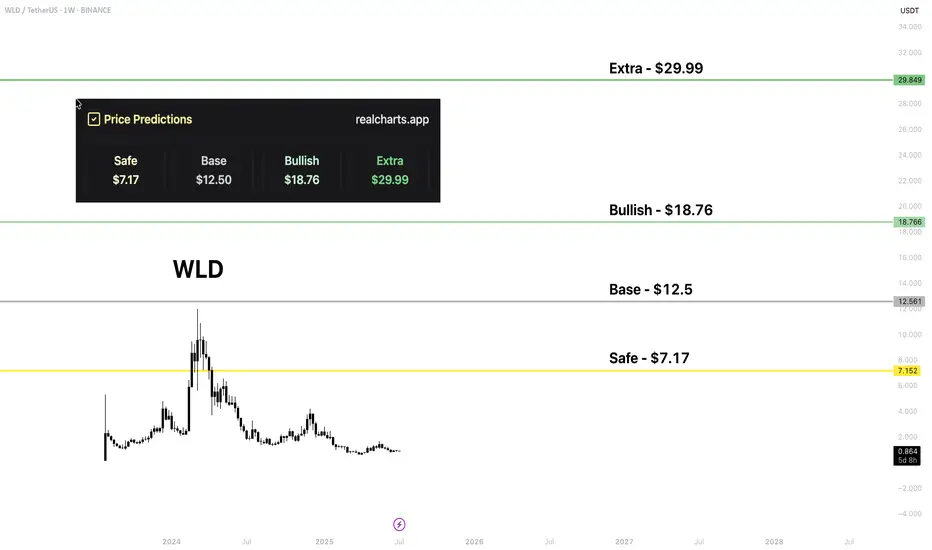
WLD | Price PredictionSam Altman has the second project about AI - BINANCE:WLDUSDT (World).
This is my top-1 investment at this moment. Those levels are from my platform.
WLD is not a regular asset because its tokenomics is hard to understand. People do not really understand it. One part of them think it is just printing tokens all the time, which isn't true if you're familiar with all the process. And another part doesn’t even know about WLD tokenomics.
This project has one of the most powerful tractions in the crypto. Razer and Tinder are already part of the ecosystem, and people don’t really talk about it. World is also an app store for Web3 apps with 1 BILLION total opens.
Price is just following the ETH price, as all of the ETH ecosystem tokens.
TradeCityPro | WLD Builds Pressure Inside Long-Term Range👋 Welcome to TradeCity Pro!
In this analysis, I want to review the WLD coin for you. It’s one of the Privacy and Identity coins with a market cap of $1.5 billion, ranked 55 on CoinMarketCap.
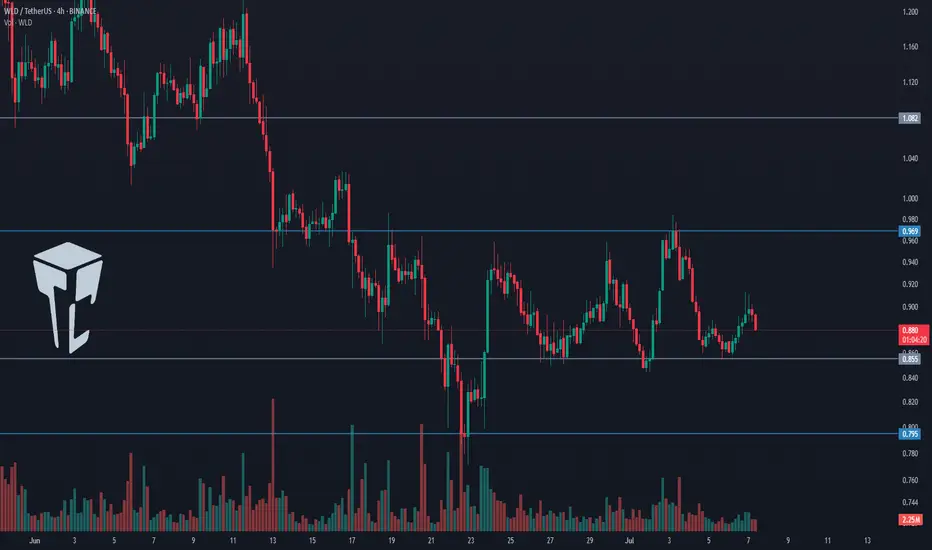
⏳ 4-Hour Timeframe
In the 4-hour timeframe, a ranging box has formed for this coin between the 0.855 and 0.969 zones, and it’s been fluctuating within this range for several weeks.
📊 Volume is gradually decreasing within this box, which could indicate that a move is approaching.
⚡️ For now, we can say the volume slightly favors buyers, as the green candles have more volume than the red ones. Additionally, the size and strength of the green candles are greater, which increases the likelihood of the box breaking upward.
📈 If the price moves up toward the 0.969 zone with increased volume, we can enter a long position upon breaking 0.969.
✔️ Alternatively, if the price is supported at the 0.855 bottom, we could also open a long position—but it’s riskier, and in my opinion, not worth it. It’s better to wait for the main trigger to activate.
🔽 For a short position, if the price forms a lower high below 0.969 and then moves toward 0.855, we can open a short if 0.855 breaks. The next support zone would be 0.795.
📝 Final Thoughts
This analysis reflects our opinions and is not financial advice.
Share your thoughts in the comments, and don’t forget to share this analysis with your friends! ❤️
WLDUSDT – Bullish Setup Unfolding!Hey Traders — if you're into high-conviction setups with real momentum, this one’s for you.
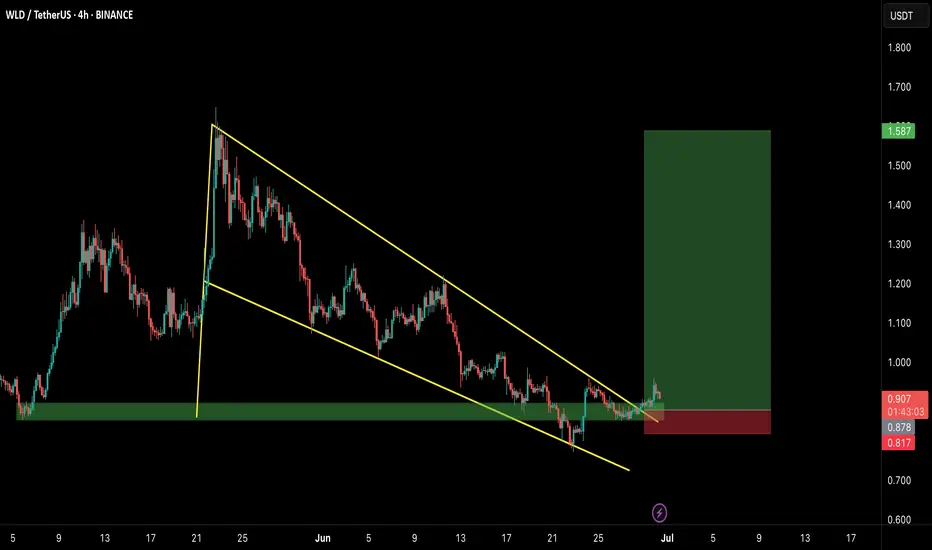
WLD is breaking out from a well-defined falling wedge pattern on the 4H chart — a classic bullish structure. Currently retesting the breakout zone while holding the green demand box like a champ. 📈
💥 Entry Zone:
$0.87 – $0.91 (accumulate inside the green box)
🎯 Targets:
• $1.08
• $1.28
• $1.45
• $1.58
🛑 Stop Loss:
$0.81 (below the wedge + demand zone)
Looks poised for a strong move. As always, use proper risk management and watch for volume confirmation.
Let’s see how this plays out — bullish structure, solid risk-reward!
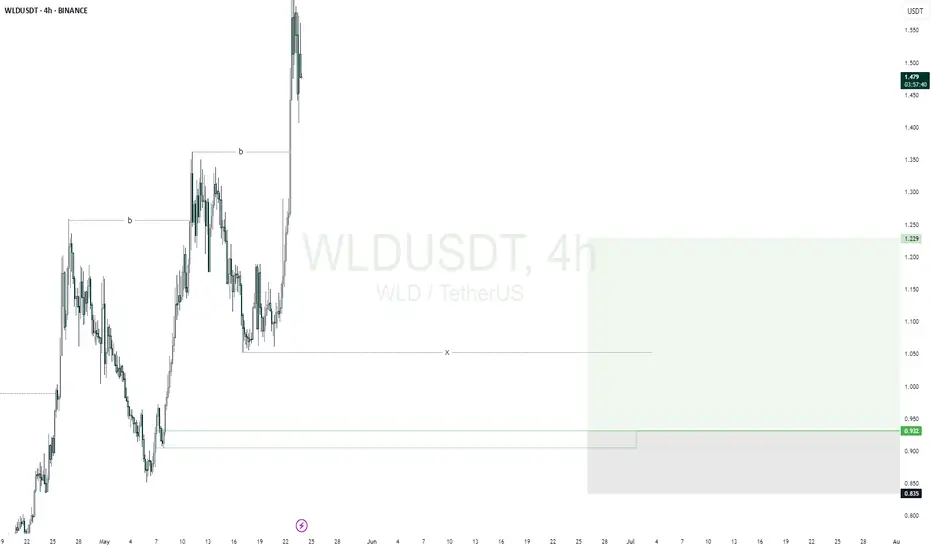
WLDUSDTmy entry on this trade idea is taken from a point of interest below an inducement (X).. I extended my stoploss area to cover for the whole swing as price can target the liquidity there before going as I anticipate.. just a trade idea, not financial advise
Entry; $0.932
Take Profit; $1.229
Stop Loss; $0.835
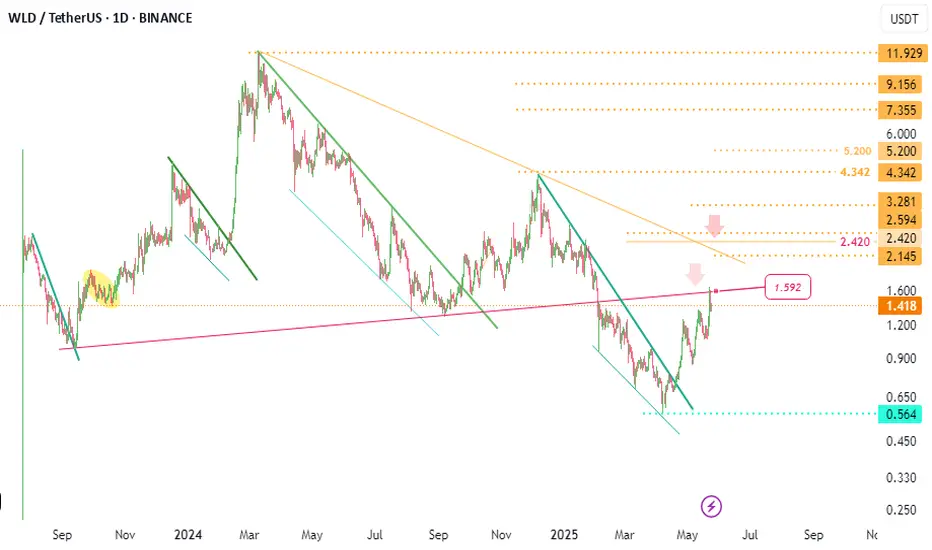
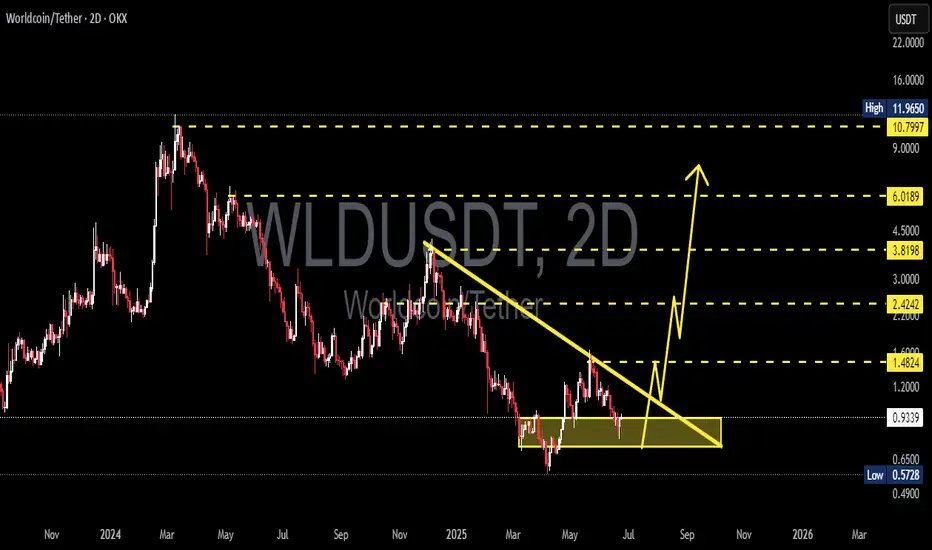
Worldcoin (WLD/USDT) Breakout Potential – Bullish Setup in PlayThis chart illustrates a potential breakout setup for Worldcoin (WLD) against USDT on the 2-day timeframe (2D), published on June 25, 2025. Key technical insights are as follows:
🔍 Technical Structure:
Strong support zone (accumulation area): Formed in the range of $0.9300 – $0.5728 (highlighted in yellow box). Price is currently consolidating within this zone, which has been tested multiple times and held, indicating a potential bottom formation.
Descending trendline: Has been broken with a bullish candle, suggesting an early signal of a potential trend reversal from bearish to bullish.
Key resistance levels (potential targets):
$1.4824 – initial breakout validation level
$2.4242 – mid-term resistance
$3.8198 – psychological and previous distribution zone
$6.0189 – major resistance before ATH
$10.7997 – $11.9650 – All Time High zone
📈 Projected Price Movement:
Bullish scenario depicted:
1. A possible retest of the breakout zone around $0.93
2. Gradual price rally toward $1.48 and $2.42 as initial targets
3. If momentum and volume support the move, a further rally toward $3.81 and $6.01 is possible
4. Ultimate long-term target lies near previous highs at $10.79–$11.96
💡 Additional Notes:
This setup is still unconfirmed and requires further breakout confirmation and supporting volume for reliability.
Trade remains high risk, as price is still near the final support zone before potential breakdown.
#WLD/USDT#WLD
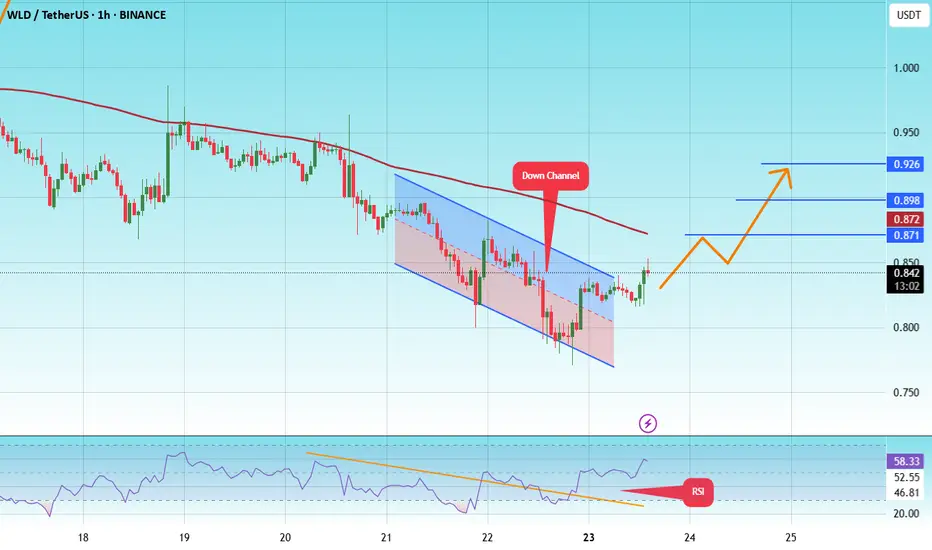
The price is moving within a descending channel on the 1-hour frame and is expected to break and continue upward.
We have a trend to stabilize above the 100 moving average once again.
We have a downtrend on the RSI indicator that supports the upward move with a breakout.
We have a support area at the lower limit of the channel at 0.825, acting as strong support from which the price can rebound.
Entry price: 0.846
First target: 0.871
Second target: 0.898
Third target: 0.926
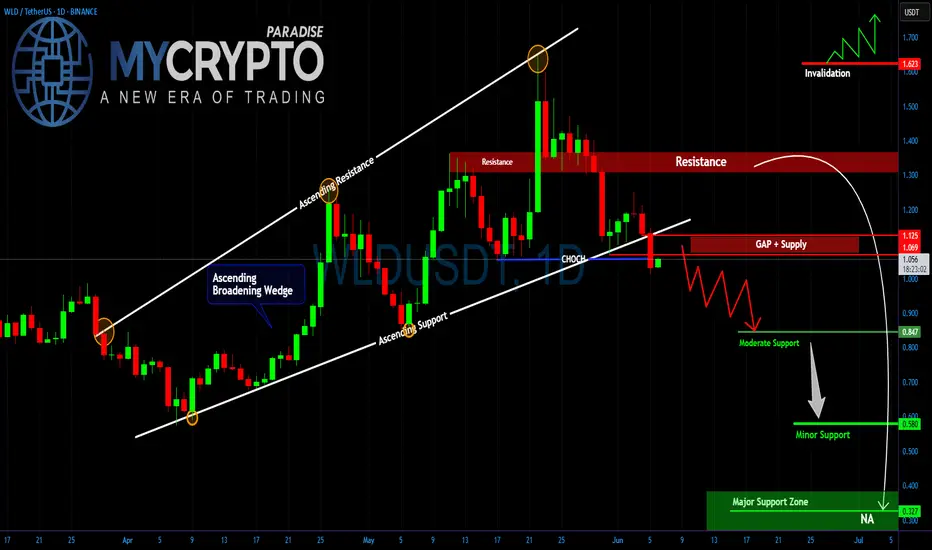
WLD Sparks Panic Here’s Why the Worst Might Still Be AheadYello Paradisers, have you seen how #WLDUSDT just collapsed out of nowhere? After weeks of slow, grinding price action inside a dangerous ascending broadening wedge, #Worldcoin has finally snapped, and this breakdown could be the start of something much bigger.
💎We had this move on the radar well in advance, as the structure continued maturing. The wedge was perfectly defined by rising support and resistance levels, and price got smacked down with precision from the top of that range. When #WLD printed a clear Change of Character (CHOCH), breaking beneath the wedge’s lower boundary, it wasn’t noise it was a direct signal of weakening momentum and a confirmed shift in market structure toward the downside.
💎What followed was a textbook retest of the breakdown level, which now aligns with a powerful supply and resistance zone between $1.069 and $1.125. As long as the price remains trapped below this zone, the bearish momentum stays in full control. Right now, the next area we’re eyeing is $0.847, where price might see a temporary pause. But make no mistake if the selling continues, #WLD is likely heading toward $0.580, and in the most extended bearish case, we’re watching the major support base at $0.347.
💎Any invalidation of this bearish setup would require a full breakout above $1.623, but with the current market structure, that kind of reversal seems extremely unlikely without a strong macro or fundamental catalyst flipping the narrative.
Trade smart, Paradisers. This setup will reward only the disciplined.
MyCryptoParadise
iFeel the success🌴
Worldcoin, How Long Will It Take For A $30 (2,544%) Target?Do you think a $30 target is possible for Worldcoin in under 6 months? What about a target of $19?
$19 gives 1,552% while $30 would yield a total of 2,544%. That's potential profits for this newly developing bullish wave.
The low was hit more than two months ago already, 7-April. This is important. Normally the build-up process takes some three months, and we are already two months in. This means that next month the market can become extremely green. Or by the start of next month everything will be 3 to 5 levels up. For Worldcoin this would be a minimum target of $9. That's 729% potential profits.
Two months just to recover from the market bottom. Three months for bullish momentum to be fully present and a new high established. Then a retrace or correction and then the final jump, makes sense? This is just a map, it can help us navigate the market, plan ahead.
We adapt to market conditions though as things can always change but this is the picture. This is how it always goes. The surprise can be prices moving beyond our calculations and that is always a nice surprise and welcomed.
Six months from now will put us in December 2025.
The next top can happen between October and December this year. These are good dates.
Since this project peaked in March 2024, no strong high in late 2024 or early 2025, this can be one of the pairs that continue growing into 2026.
Remember, some will end their bull market this year for sure and enter a bear market, others will continue growing into 2026. This is the most important part to keep in mind, it will make all the difference when taking profits.
We will continue with this thought process in one of the next charts.
I think of you when reading.
(I mean, "Thank you for reading.")
Namaste.

Worldcoin.So, unless WLD breaks above $1.50 and holds that level (in which case, $4 would be the target and we might see an invertes H&S), losing the $1 support could lead to a breakdown below the previous low. If that happens, I expect the bearish trend to continue. Based on two confirmations, I believe the price could drop to $0.30, before the bulls return.

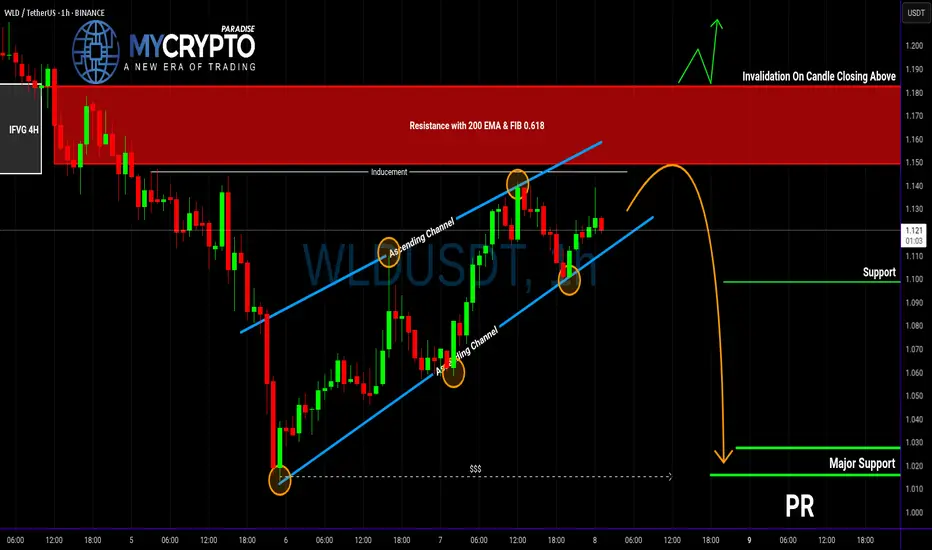
Is WLDUSDT Preparing for a Nasty Reversal?Yello, Paradisers! Have you been watching WLDUSDT creeping upward inside that nice channel and thinking this is a breakout in the making? Be careful. This setup might be laying a trap for overconfident bulls—and the signs are getting louder.
💎WLDUSDT is currently trading within an ascending channel, a structure that often signals weakening bullish momentum. The price is approaching a key resistance area, and what makes this zone even more dangerous is the confluence of bearish indicators stacked right on top of each other. We have the 200 EMA acting as dynamic resistance, the 0.618 Fibonacci retracement level overlapping perfectly, and a visible I-FVG (4H) in the same zone. This trio of signals significantly increases the probability of a strong bearish reaction.
💎If the price reacts from this resistance zone, performs an inducement move, and forms a clean bearish structure, we could be looking at a high-probability short opportunity. This would offer a solid risk-to-reward setup for those who are prepared and disciplined enough to wait for confirmation.
💎However, if the price breaks above the resistance and closes a full candle above it, then this bearish thesis will be completely invalidated. In such a scenario, it’s smarter to step back and wait for a clearer, more favorable structure to form. Chasing trades here would only increase the risk of getting caught on the wrong side of a fakeout.
🎖Discipline always wins in the long run, Paradisers. The market rewards those who wait for clean, high-probability setups — not those who trade based on FOMO. If you want to build long-term profitability, you must stay strategic, patient, and act only when everything aligns.
MyCryptoParadise
iFeel the success🌴
Worldcoin Eyes Breakout But Faces Strong HeadwindsWorldcoin is currently facing a key resistance zone that was previously acting as strong support — a classic flip that now caps upward moves.
Despite recent recovery, the price is still trading below the descending trendline, which continues to act as dynamic resistance.
Until we see a confirmed breakout above this confluence zone, upside potential remains limited. A rejection here could send the price back toward previous support levels.
Keep an eye on this area. A strong breakout could shift momentum, but for now, caution is warranted.
DYOR, NFA

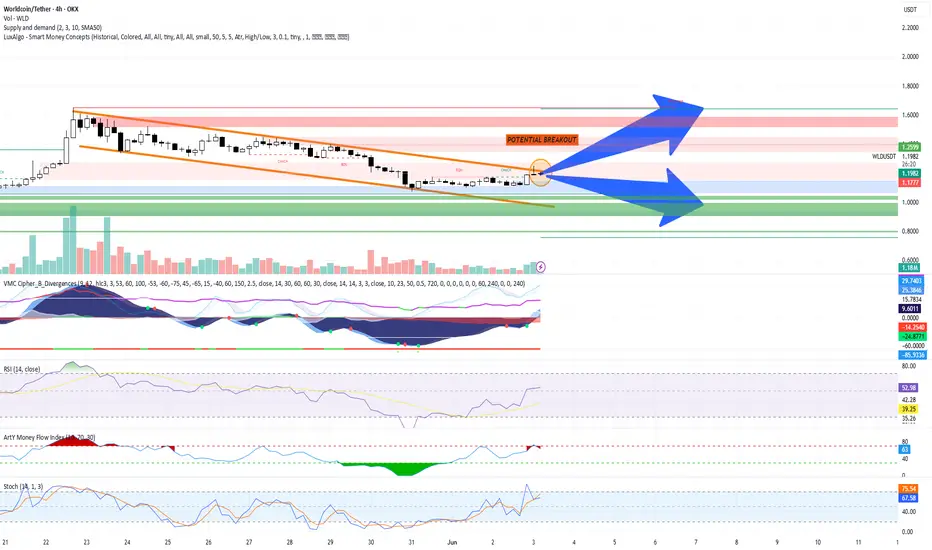
Technical Analysis: Worldcoin (WLD/USDT) + TRADE PLANTechnical Analysis: Worldcoin (WLD/USDT)
Chart Overview
Pattern: A falling wedge formation is clearly visible, typically a bullish reversal pattern.
Potential Breakout: The price has broken above the upper wedge resistance line, indicating a potential bullish breakout.
Key Levels:
Resistance Zones:
$1.26 (SMA50)
$1.55–$1.65 (major supply zone)
$1.80–$1.90 (final resistance target)
Support Zones:
$1.18 (local support)
$1.00–$1.10 (strong green demand zone)
$0.90 (final downside support)
Indicators & Oscillators
Volume
Volume shows moderate rising interest during breakout—confirmation would be stronger with larger volume spikes.
VMC Cipher B
Momentum waves and money flow are turning bullish.
Green dots at the bottom suggest bullish divergence and likely upward momentum.
RSI (14)
Currently at 52.77, crossing above 50—a bullish signal.
Not yet overbought, so there's room to move upward.
Money Flow Index (MFI)
Reading at 63, indicating strong inflows and increased buying pressure.
Stochastic RSI
Bullish crossover, currently at 66.78/75.27, heading upward—supports the breakout scenario.
Trading Plan
Scenario A: Bullish Breakout Confirmation
Trigger: Close above $1.20–$1.22 with rising volume and continued RSI/MFI strength.
Buy Zone (Spot 1): $1.18–$1.22
Buy Zone (Spot 2): On pullback to wedge breakout line ($1.15–$1.17)
Targets:
TP1: $1.26 (SMA50)
TP2: $1.55–$1.60 (supply zone)
TP3: $1.80 (long-term resistance)
Stop Loss: Below $1.10 (to invalidate breakout)
Risk-Reward Ratio: Minimum 1:2 for TP1, up to 1:4–1:5 for TP3
Scenario B: Failed Breakout / Bearish Rejection
Trigger: Rejection at $1.20–$1.26 and fall below $1.15 with increasing sell volume.
Short Entry (only for experienced traders): Under $1.15
Targets:
TP1: $1.05 (mid-demand zone)
TP2: $0.95–$1.00 (major demand zone)
Stop Loss: Above $1.22
Note: Prefer to stay out if volume is low—wait for clearer structure.
Risk Management & Strategy Notes
Use position sizing: No more than 3–5% of capital per trade.
Be patient—wait for candle close confirmations.
If the price consolidates near $1.20 and volume increases, a strong upward move is likely.
Avoid emotional trading—react to price action, not assumptions.
Worldcoin (WLD/USDT) is showing strong bullish potential with a confirmed breakout from a falling wedge. Indicators support upward momentum, and the structure favors a move toward the $1.50–$1.80 range. Monitor volume and key support levels to manage risk and confirm trend continuation.
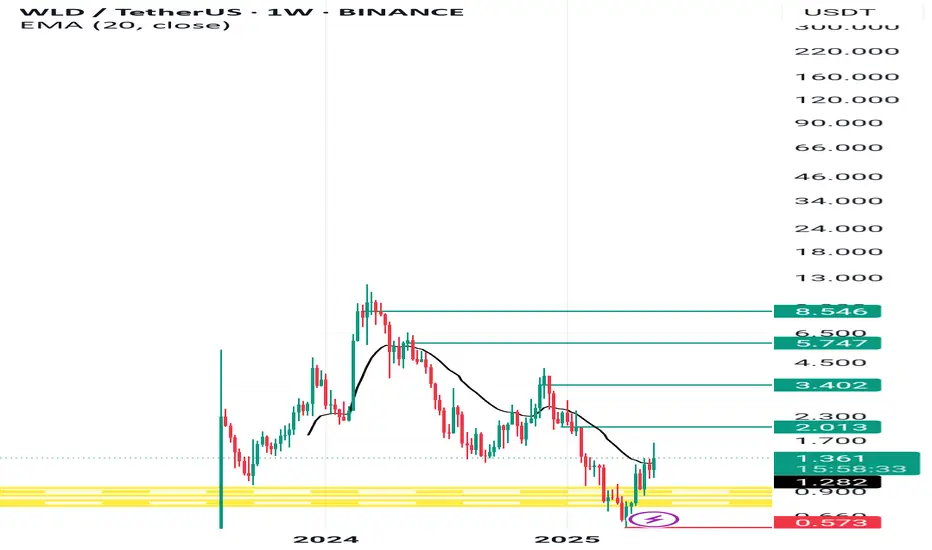
WLDUSDT 3D AnalysisWLD ~ 3D Analysis
#WLD Buy gradually from here if you still have confidence in this coin with a short term target of at least 15%+ from here.

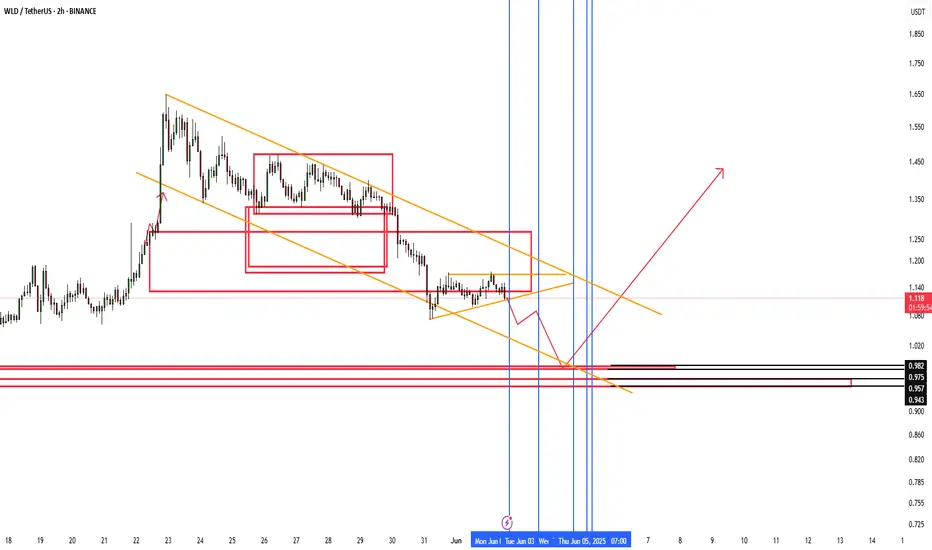
WLD Price Compression Near Key Support – Watch June 3–5 for Move📊 WLD/USDT – Reversal Zone & Time Projection Analysis by AngleTrader
Timeframe: 2H
Method: Gann Trend Lines | Rectangles (Reversal Zones) | Time Cycles
🔍 Idea Summary:
Price is currently in a corrective downtrend channel marked by two orange descending trend lines.
Several breakout-based reversal zones (red rectangles) have been highlighted from prior breakout levels.
A multi-touch consolidation is happening near the lower orange trend line, indicating indecision.
Time cycle lines (blue verticals) suggest upcoming volatility windows between June 3 and June 5, aligning with a potential reversal.
🔻 Bearish Scenario:
Price may break down through the current support range.
Watch the high-probability demand zone:
0.943 – 0.982 USDT
(Marked by thick red/black rectangles)
This zone aligns with a trendline intersection and past accumulation.
🔺 Bullish Scenario:
If price respects the lower support zone and reacts strongly with volume,
Expect a reversal breakout above the descending channel, targeting:
1.25 – 1.40 USDT in the next leg.
📅 Key Dates to Watch:
June 3–5, 2025 – Major time confluence.
Reversal or breakout is likely around these dates.
⚠️ Notes:
This setup uses no indicators, just pure structure, Gann angles, and price behavior.
Wait for confirmation from price action within the demand zone
is WLD READY FOR NEW CYCLE to $4Worldcoin looks to have new data, which could mean a new cycle is on processing.
Low time frame focus target $1,70

WLD (Worldcoin) – Long Spot Trade Setup After 180% RallyAfter a massive 180% surge, WLD is showing signs of exhaustion and is likely to retrace toward the next major support zone. A pullback into the $1.22 – $1.35 area provides a favorable entry opportunity for continuation of the trend, assuming support holds.
🔹 Entry Zone (Support):
$1.22 – $1.35
🎯 Take Profit Targets:
🥇 $1.65 – $1.85 (prior consolidation and resistance zone)
🥈 $2.40 – $2.65 (upper range resistance / extension target)
🛑 Stop Loss:
Just below $1.10 (below structural support and invalidation level)

1.43 RR tradeIf WLD keeps coming down and eventually hits the entry, this could be an OK trade. A bit risky since long-term target already hit on top. If there's a move up before entry is hit, cancel the trade.
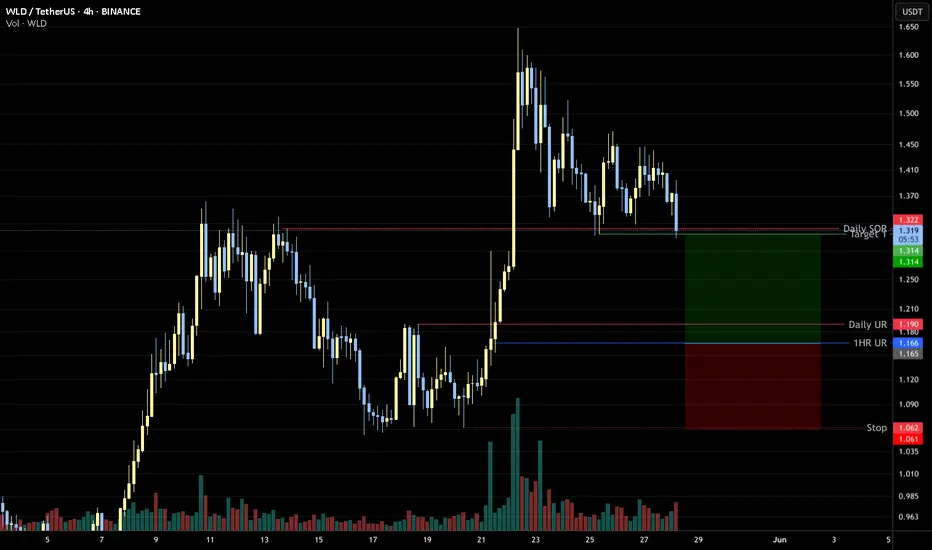
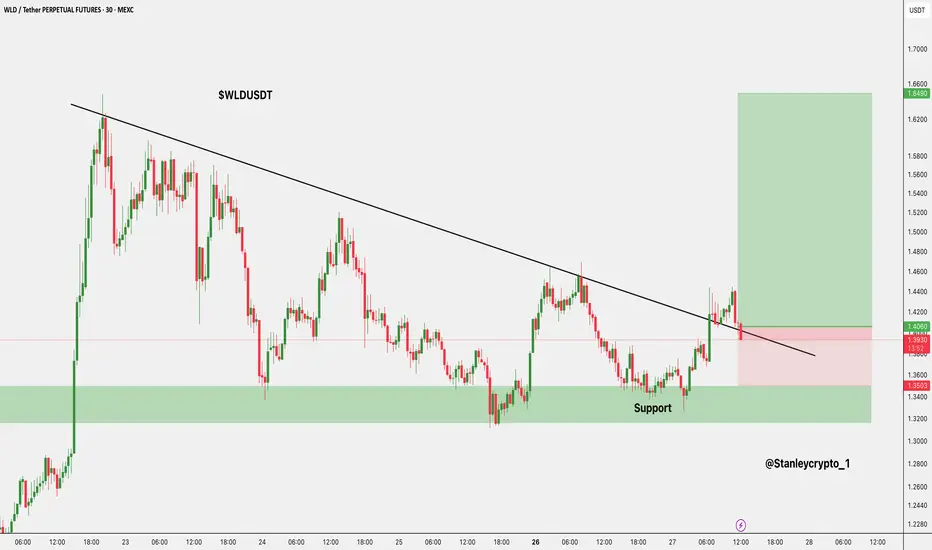
$WLD Trade Setup MIL:WLD Trade Setup
Breakout above the trendline, strong support hold.
- Entry: $1.408 - CMP
- SL: $1.3501
- Target: $1.6490
Already in the trade, let’s see how it plays out.
DYRO, NFA
where to buy ?Hello friends
Given the good growth of this currency, we are witnessing a price correction and this is an opportunity to buy in the price correction in the support areas and move with it to the specified goals, of course with capital and risk management.
*Trade safely with us*

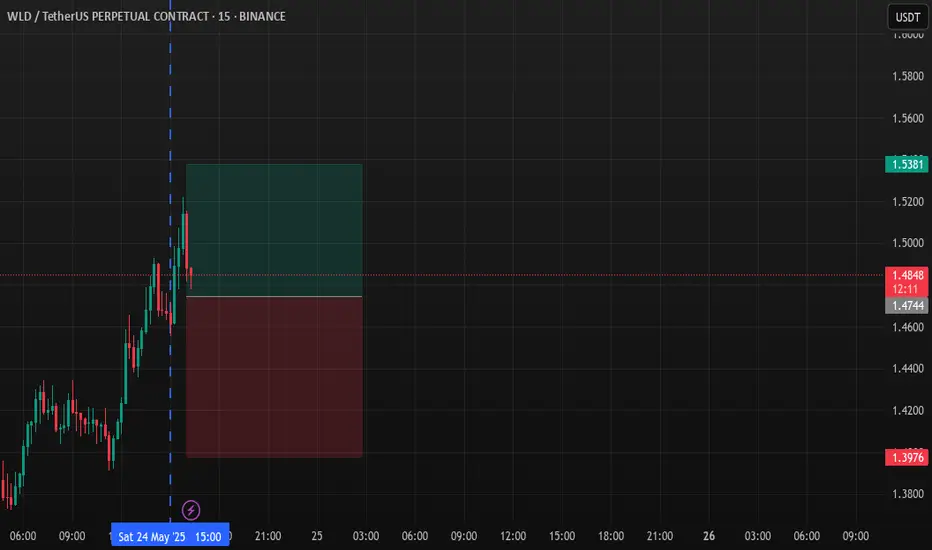
WLD – Long Idea (15M)A similar long opportunity on WLD, confirmed by my Fibbo Time Levels strategy. The timing window suggests a bullish shift, supported by recent price action.
📌 Timeframe: 15M
🎯 Target & SL: Marked on the chart
⏳ Confidence: Strong time-based signal
#WLDUSDTFor now, the recent growth can be considered a pullback to the red line (at the lower red arrow).
For the next good growth, it must be able to break this resistance, which
will be seen in the chart if the next red resistances are broken
So for now, we wait for a good candle above the lower red arrow