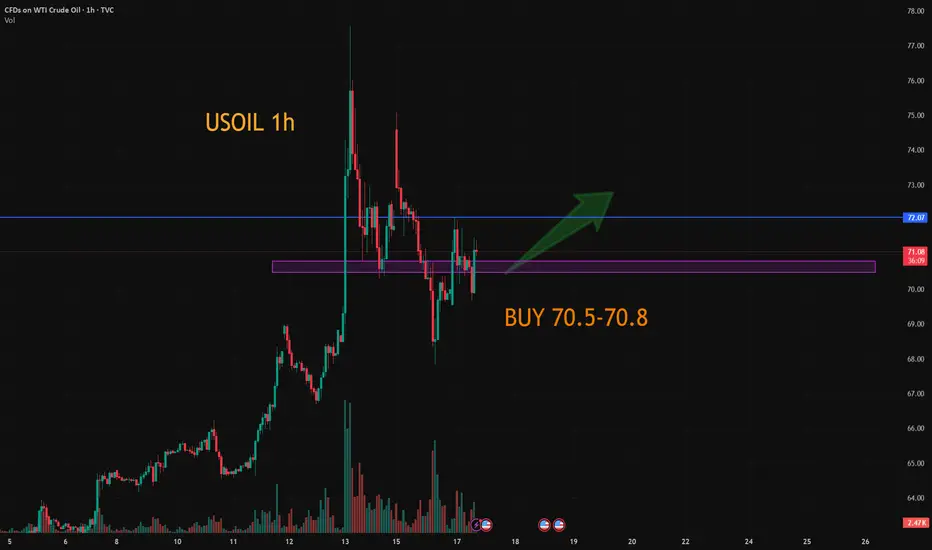
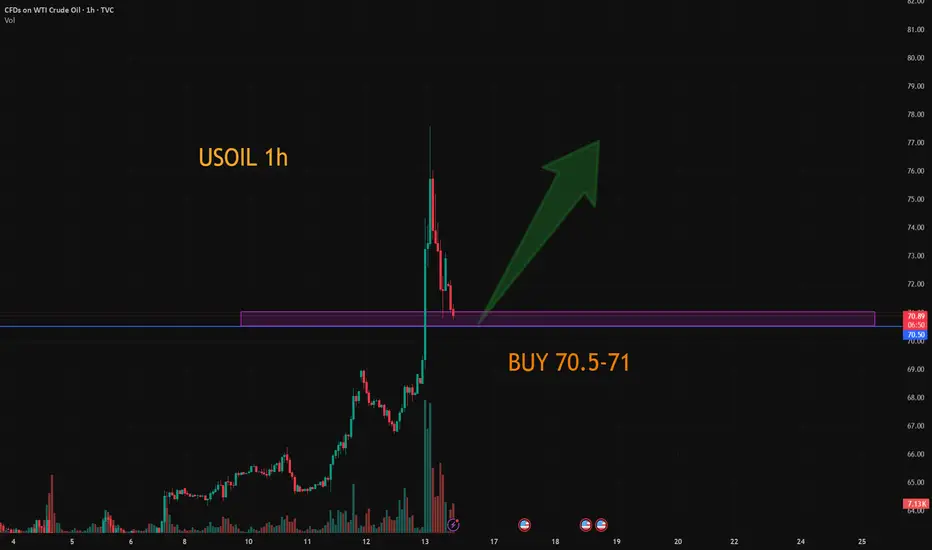
USOIL:A long trading strategy
Oil prices also fell sharply under the stimulus of the news, and then completed the correction rebound in the sub-session, and now back to around 71 again. The current trend is in the upward rhythm of the main trend, and it is expected that the trend of crude oil will be mainly in the form of shock consolidation.
Trading ideas than yesterday did not change too much, adjust the appropriate profit point.
Trading Strategy:
BUY@70.5-70.8
TP: 71.8-72.3
↓↓↓ More detailed strategies and trading will be notified here ↗↗↗
↓↓↓ Keep updated, come to "get" ↗↗↗
WTI trade ideas
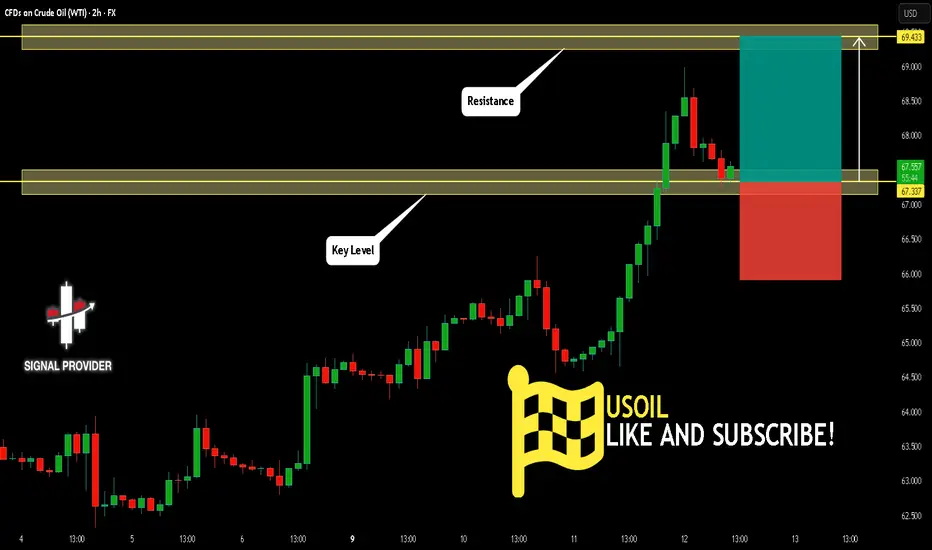
USOIL Will Go Higher From Support! Buy!
Take a look at our analysis for USOIL.
Time Frame: 2h
Current Trend: Bullish
Sentiment: Oversold (based on 7-period RSI)
Forecast: Bullish
The market is testing a major horizontal structure 67.337.
Taking into consideration the structure & trend analysis, I believe that the market will reach 69.433 level soon.
P.S
The term oversold refers to a condition where an asset has traded lower in price and has the potential for a price bounce.
Overbought refers to market scenarios where the instrument is traded considerably higher than its fair value. Overvaluation is caused by market sentiments when there is positive news.
Disclosure: I am part of Trade Nation's Influencer program and receive a monthly fee for using their TradingView charts in my analysis.
Like and subscribe and comment my ideas if you enjoy them!
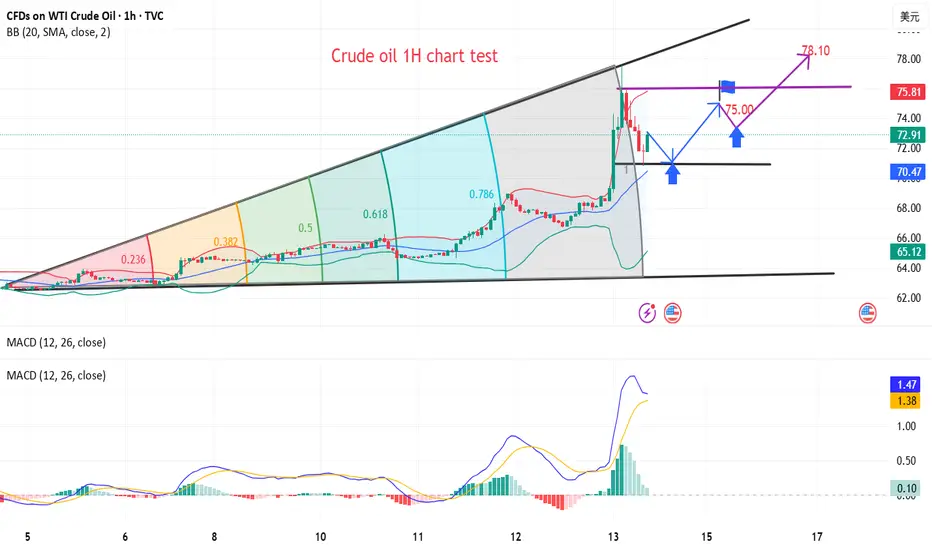
USOIL-– Bearish Reversal Toward $72.04Crude oil is showing signs of weakness after testing a significant resistance zone near $74.50 – $75.00. The price had previously broken out of a descending channel, triggering a bullish correction. However, it’s now approaching a critical resistance level which has been tested multiple times historically.
The bearish projection (shown in red) suggests a possible lower high formation, signaling exhaustion in bullish momentum. If the resistance holds, a drop toward the next target at $72.04 looks probable, aligning with previous support and the breakdown zone of the ascending move.
Key Levels:
Resistance Zone: $74.50 – $75.00
Support Zone: $68.00 – $70.00
Intermediate Target: $72.04
📉Bias: Bearish below $75.00
Confirmation: Watch for bearish candle patterns or rejection wicks near resistance.

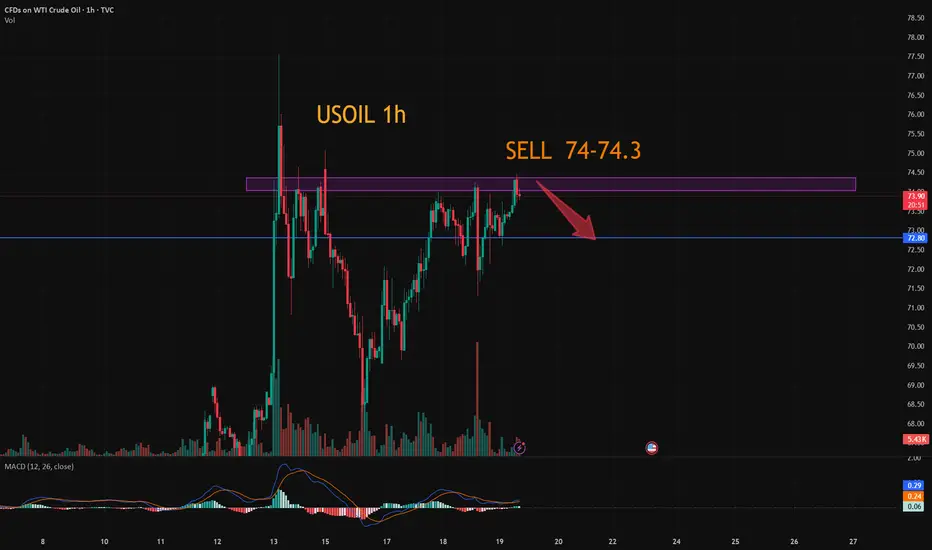
USOIL:The trading strategy of going short
USOIL: Consider shorting for now, as there are signs of a top above 74.5, but I think this is only a short-term high and will continue to surge higher. The trading idea is to sell short today and wait for the right position to be long.
Trading Strategy:
SELL@74-74.3
TP: 73.2-72.7
↓↓↓ More detailed strategies and trading will be notified here ↗↗↗
↓↓↓ Keep updated, come to "get" ↗↗↗
USOIL - Near CUT n REVERSE Area? holds or not??#USOIL.. straight bounce after #IranvsIsrael war situation, and now market just reached near to his current Resistance Area / region
keep close that region and if market holds then drop expected otherwise not at all.
NOTE: we will go for cut n reverse above region on confirmation.
good luck
trade wisely

US-Iran war or peace?Oil options are more bullish now than they were just after the outbreak of the Russia-Ukraine conflict in 2022, indicating that global markets are on edge over the confrontation between Israel and Iran, and speculation that the United States may join the attack.
As of Tuesday's close, the premium of Brent crude call options relative to put options was the widest since 2013. As the turnover of option contracts has been higher than usual in recent days, a measure of implied volatility has also risen sharply.
The war between Israel and Iran has raised concerns that crude oil export infrastructure could be targeted, which could curb supply and trigger a price surge. On Wednesday, Brent crude oil prices approached $76 a barrel, having previously hit a new high since the conflict broke out in January.
According to ABC, US officials said that the next 24 to 48 hours will be critical and will determine whether the Israeli-Iranian issue can be resolved through diplomatic means or whether Trump will take military action.
Trump summoned his senior advisers in the White House Situation Room on Tuesday. Trump significantly stepped up his rhetoric against the Iranian regime ahead of the meeting, claiming that the United States knew exactly where Khamenei was hiding.
Despite the apparent saber rattling, U.S. negotiators on Tuesday believed Iran was in a weak position and could be forced to return to the table and ultimately accept a deal that would require it to abandon all nuclear enrichment, according to multiple officials involved in the diplomatic process.
The Iranian regime has indicated a willingness to resume discussions with the United States as Iran and Israel trade blows, the officials said, adding that the Trump administration has been seeking more concrete commitments before abandoning its path to war.
If Iran returns to the talks and agrees to abandon uranium enrichment, U.S. officials see a potential high-level meeting led by special envoy Steve Witkoff and Vice President J.D. Vance as soon as this week.
But such a scenario would likely require Iran to act quickly. Trump has acknowledged that his patience with the situation in the Middle East is wearing thin.
Sources familiar with Trump's mindset say he is frustrated by the volatile situation in Iran and the inability to provide the administration with immediate answers, and he seems very reluctant to see Tehran successfully send him a military warning.
The U.S. military is already moving assets to the region, including additional aircraft, a second aircraft carrier and its strike group to the Middle East. Officials say all of these moves are defensive.
Defense Secretary Pete Hegseth spoke about the U.S. posture in the Middle East in an interview with Fox News on Monday, saying, "We are strong, we are ready, we are defensive and we are present."
But while the redeployment of assets is intended to protect the roughly 40,000 U.S. troops stationed in the region, it also leaves options open for the Trump administration if it decides to directly assist Israel's ongoing offensive operations against Iran.
"Our job is to keep options on the table, but our posture remains defensive," one U.S. official said.
One major question is whether the U.S. will deploy B-2 stealth bombers. The heavy strategic bomber is capable of carrying 30,000 pounds of mass destruction and may be able to destroy Iran's deep underground nuclear facility at the Fordow Fuel Enrichment Plant.
Currently, the military's 19 B-2 bombers are based at Whiteman Air Force Base in Missouri. Six of the planes were previously based at an air base on Diego Garcia in the Indian Ocean — closer to Iran. But those bombers were replaced by B-52 long-range bombers that can’t carry the bunker-busting bombs needed to destroy Fordow.
There are already about a dozen U.S. Navy ships patrolling near Bahrain’s territorial waters, according to a U.S. Defense Department official. The ships have no official mission, the official said. They include a littoral combat ship, four minesweepers and six surface patrol boats.
The Navy also has two destroyers, an aircraft carrier in the Red Sea and three other surface ships in the Arabian Sea. Two more U.S. destroyers are stationed in the eastern Mediterranean, each equipped with a missile defense system capable of shooting down Iranian ballistic missiles.
Signs that the Trump administration may be moving toward military action could include canceling the president’s planned trip to the Netherlands next week for a NATO summit.
At a news conference on Tuesday, State Department spokeswoman Tammy Bruce said the summit was still "on the table," but she said things could change depending on dynamics with Iran.
"Things are moving very quickly. So I think anything is possible," she said. TVC:USOIL MARKETSCOM:USOIL SWISSQUOTE:USOILN2025 TVC:USOIL
WTI crude oil Wave Analysis – 17 June 2025
- WTI crude oil reversed from round support level 70.00
- Likely to rise to resistance level 78.00
WTI crude oil recently reversed from the round support level 70.00 coinciding with the upper trendline of the recently broken up channel from May.
The downward reversal from the support level 70.00 formed the weekly Japanese candlesticks reversal pattern Bullish Engulfing – which increases the probability WTI will continue to rise in the active impulse wave C.
Given the strength of the active impulse wave C, WTI crude oil can be expected to rise to the next resistance level 78.00 (target for the completion of wave (4), which reversed the price in January).

Oil Eyes $90+ as U.S.–Iran Conflict LoomsWTI Crude Oil — Bullish Reversal in Play as War Risk Escalates
Technical & Geopolitical Outlook — Weekly Chart | 17 June 2025
🧭 Current Market Condition:
WTI crude oil is breaking out of a multi-month falling wedge, a classically bullish reversal pattern, after bouncing from the $67–68 support region. This technical move is further amplified by rising geopolitical tensions in the Middle East, particularly fears of a potential U.S. military strike on Iran, which would threaten global oil supply routes through the Strait of Hormuz.
The current breakout attempt aligns with a sentiment shift from oversold to recovery mode, supported by a sharp rise in weekly momentum indicators.
📊 Key Technical Highlights:
Bullish Falling Wedge Breakout: Price breaking above descending resistance.
Key Resistance Levels:
$76.67 – immediate supply zone
$92.82 – prior breakout area; major target if breakout sustains
Key Support Levels:
$71.28 – breakout retest level
$67.00–$68.00 – wedge base, strong historical support
$52.00 – longer-term bearish invalidation (unlikely unless demand collapses)
Momentum: Weekly stochastic sharply rising from bottom, signaling strength building.
🔺 Bullish Scenario — If U.S. Attacks Iran:
If the U.S. carries out military strikes on Iranian targets, oil prices are highly likely to:
Price in geopolitical risk premium of $10–$20/barrel.
Spike toward $90–$100 range within days or weeks due to:
Fears of supply disruption (Hormuz choke point)
Panic buying and short covering
Strategic reserves hoarding
Technical Targets:
$76.67 → Break above confirms bullish continuation
$92.82 → First major upside target
$100–$110 → Stretch target if conflict escalates or prolongs
🛢️ Energy traders and institutions typically front-run geopolitical escalations, so price can jump before any physical conflict if tensions remain unresolved or rhetoric intensifies.
🔻 Bearish Scenario — Fake Breakout or De-escalation:
Rejection from $76.67 or failure to hold above $71.28 can trigger pullbacks.
If tensions cool and Iran conflict is diplomatically diffused:
WTI may slide back toward $68.00 and re-enter the wedge.
Below $67.00, oil could revisit $60–$52 range in a risk-off macro environment.
🛡️ Risk Management & Outlook:
Geopolitical events can override technicals, especially in commodities.
Gaps, whipsaws, and sharp reversals are common — caution with overnight positions.
Consider hedging strategies or limited-risk option plays if trading leveraged oil instruments.
📢 If you found this analysis valuable, kindly consider boosting and following for more updates.
⚠️ Disclaimer: This content is intended for educational purposes only and does not constitute financial advice.

US OIL 🛢️ USOIL Trade Plan – Based on Dow Theory (4H TF)
📌 Bias: Buy / Long
Dow Theory shows Higher Highs (HH) and Higher Lows (HL) structure on the 4H — indicating an uptrend
SL TP marked in Chart / Entry Instant or buy near CMP

CRUDE OIL (WTI): Detailed Support & Resistance Analysis
Here is my latest structure analysis for WTI Oil.
Resistance 1: 63.6 - 65.9 area
Resistance 2: 68.2 - 69.2 area
Resistance 3: 71.4 - 75.2 area
Support 1: 61.8 - 62.8 area
Support 2: 59.0 - 60.8 area
Support 3: 55.1 - 57.2 area
Consider these structures for pullback/breakout trading.
❤️Please, support my work with like, thank you!❤️

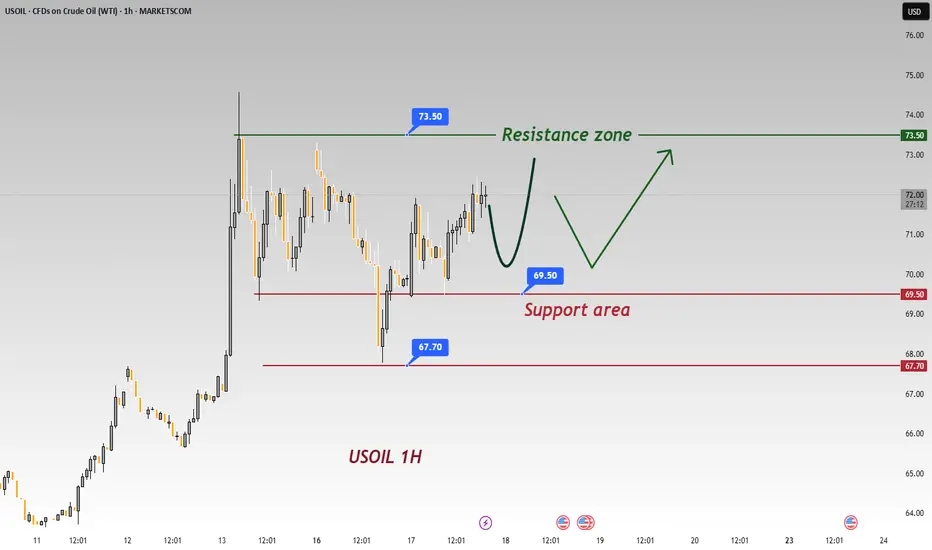
USOIL 1 - Hour Chart AnalysisUSOIL 1 - Hour Chart Analysis
Key Levels
Support: ~69.50 (short - term), 67.70 (critical backup).
Resistance: 73.50 (major hurdle, tested before).
Trend, Pattern & Middle East Conflict
Price oscillates between support/resistance, with a potential “V - shaped reversal”. Middle East conflicts add high uncertainty:
Escalation: Fears of supply cuts could push price above 73.50 rapidly.
De - escalation: May pressure price down, but 67.70/69.50 still get support from lingering supply - risk worries.
Trading Strategies
Bullish: If 69.50 holds (e.g., long lower shadows/bullish candles), small - size long. Target 73.50; stop - loss ~69.20. Watch for sudden conflict news.
Bearish: If 69.50 breaks (consecutive closes below), short. Target 67.70; stop - loss ~69.80. Stay alert to conflict updates.
Note: Oil prices hinge on supply - demand, Middle East tensions, and the USD. Combine tech/fundamental analysis; manage risk strictly.
⚡️⚡️⚡️ USOil ⚡️⚡️⚡️
🚀 Buy@ 70.50 - 71.00
🚀 TP 73.00 - 74.00
Accurate signals are updated every day 📈 If you encounter any problems during trading, these signals can serve as your reliable guide 🧭 Feel free to refer to them! I sincerely hope they'll be of great help to you 🌟 👇
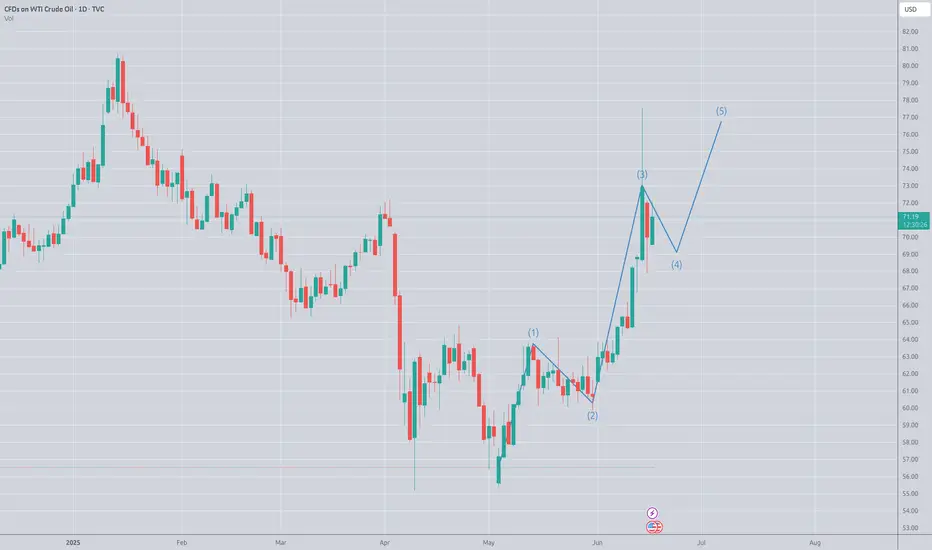
Long on OIL amid Israel-Iran confilctFundamental trends:
Israel-Iran conflict does not seem to end soon, Israel might target iranian facilities more
Recent insights suggest US involvement which whould lead to oil price rising.
Technical trends:
Plot seems to develope an Elliot impulse wave with clear 1-3rd waves already built. This suggests the impulse wave must end with rising on 5th wave.
Conclution
Overall trends tell in favor of future oil prices rising.
What do you think about the situation? Please, leave your comments
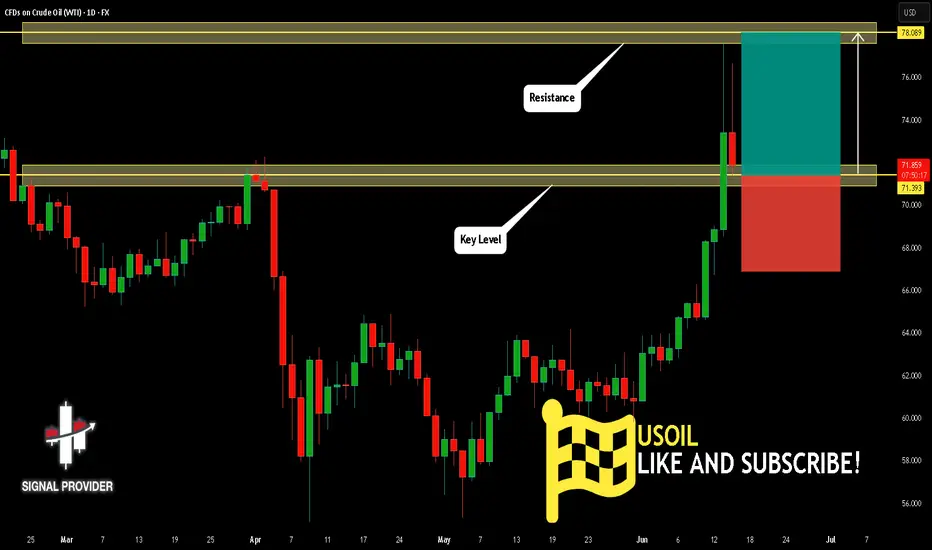
USOIL Will Move Higher! Buy!
Please, check our technical outlook for USOIL.
Time Frame: 1D
Current Trend: Bullish
Sentiment: Oversold (based on 7-period RSI)
Forecast: Bullish
The price is testing a key support 71.393.
Current market trend & oversold RSI makes me think that buyers will push the price. I will anticipate a bullish movement at least to 78.089 level.
P.S
Overbought describes a period of time where there has been a significant and consistent upward move in price over a period of time without much pullback.
Disclosure: I am part of Trade Nation's Influencer program and receive a monthly fee for using their TradingView charts in my analysis.
Like and subscribe and comment my ideas if you enjoy them!

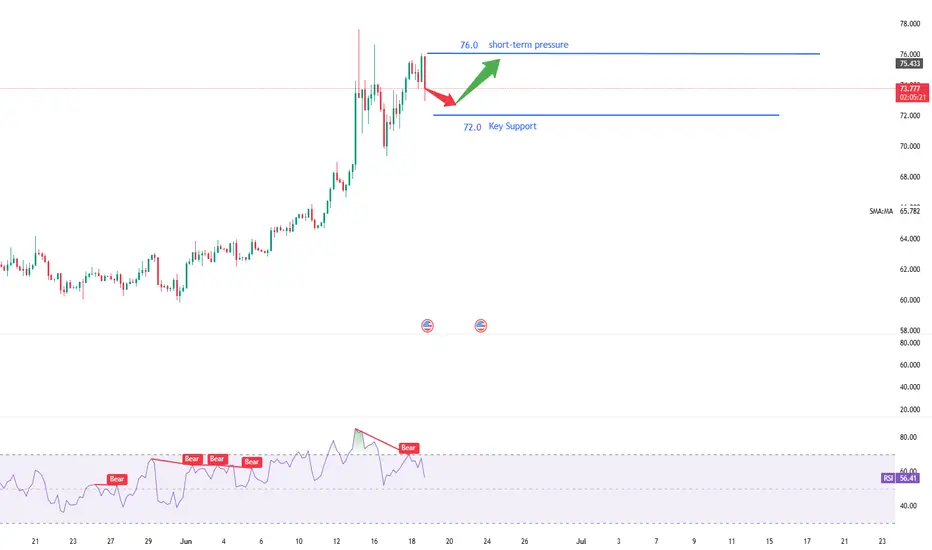
Analysis of the latest crude oil market trendCrude oil prices stabilized after a sharp rise on Tuesday, with the market keeping a close eye on the potential escalation of conflicts in the Middle East. According to market surveys, Iran's crude oil export infrastructure has not been directly hit so far, and most of the impacts are still concentrated on shipping. However, analysts point out that if the conflict spreads to the entire region, oil prices are likely to rise further significantly. The current rise in crude oil prices is not only dominated by actual supply and demand but is highly influenced by geopolitics. Market sentiment is extremely vulnerable to disturbances from external events. As the global energy artery, the stability of the Strait of Hormuz provides strong support for oil prices. When the uncertainty of the geopolitical situation intensifies, attention should be paid to the release of U.S. official inventory data and the development of diplomatic processes.
Technical analysis of crude oil: The moving average system is in a bullish arrangement, and the medium-term objective trend direction is upward. The current trend is in the rhythm of the main upward trend. The fast and slow lines of the MACD indicator coincide with the bullish columns above the zero axis, indicating that the bullish momentum is currently full. It is expected that the medium-term trend is expected to usher in a rising rhythm.
you are currently struggling with losses,or are unsure which of the numerous trading strategies to follow,You have the option to join our VIP program. I will assist you and provide you with accurate trading signals, enabling you to navigate the financial markets with greater confidence and potentially achieve optimal trading results.
Trading Strategy:
buy@72.0-72.5
TP:74.0-74.5
Crude oil is the ultimate winner
💡Message Strategy
Currently trading around $70.00 a barrel during Friday's European session, crude oil prices surged on growing concerns about supply disruptions. Rising tensions in the Middle East threaten navigation through the Strait of Hormuz, a key passage for about 20% of global oil shipments.
📊Technical aspects
From the daily chart level, crude oil prices in the medium term broke through the upper resistance of the range and tested a new high of 75.50. The moving average system is in a bullish arrangement, and the medium-term objective trend is upward.
The current trend is in the upward rhythm of the main trend. The MACD indicator fast and slow lines overlap with the bullish column above the zero axis, indicating that the bullish momentum is currently full, and it is expected that the medium-term trend is expected to usher in a wave of rising rhythm.
The short-term (1H) trend of crude oil continued to fluctuate upward, and the price near 74 was tested. The moving average system relies on the bullish arrangement of oil prices, and the short-term objective trend direction remains upward. Oil prices hit a new high near 75.30, and then fell back and closed with a negative real candlestick. The short-term momentum is still bullish, and it is expected that the trend of crude oil will continue to maintain a high-level oscillation upward rhythm.
💰 Strategy Package
Long Position:70.09-71.50
USOIL:Go short before you go long
The idea of crude oil is still to go long. Today, the more appropriate entry point is 72-72.3, there is still a little space at present, if you consider selling short first, then the more appropriate short point is 73-73.3 range. Give to the point to do, to wait to do more.
Trading Strategy:
SELL@73-73.3
TP: 72-72.3
BUY@72-72.3
TP: 73.7-74
↓↓↓ More detailed strategies and trading will be notified here ↗↗↗
↓↓↓ Keep updated, come to "get" ↗↗↗

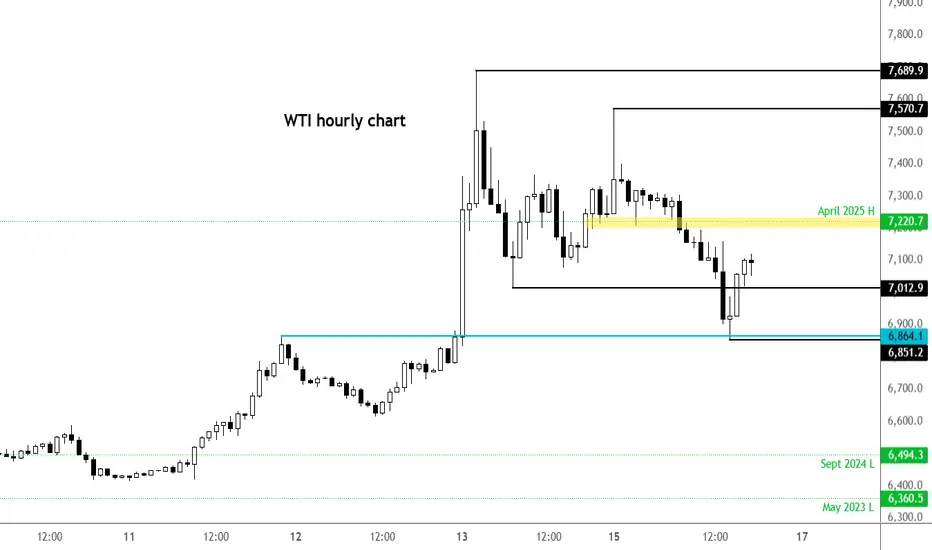
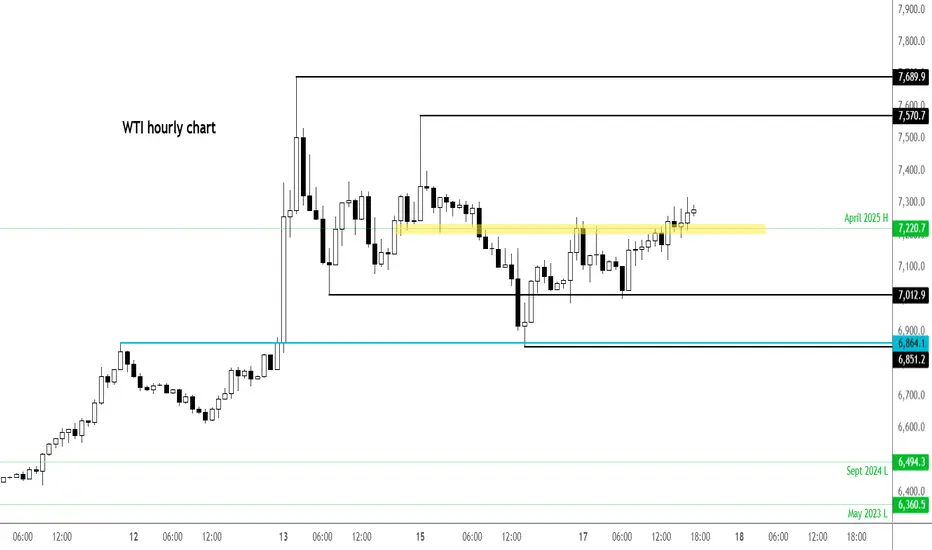
WTI rebounds from key support as Middle East tensions intensifyThe latest escalation in the conflict between Israel and Iran initially didn't cause much panic in the oil market. After spiking initially to an overnight high of $75.70, WTI has since been on a decline, before hitting a low so far of $68.50. That represents a 9.5% drop from the overnight high, which is massive. Investors have been pricing out the risk of of oil supplies being meaningfully impacted. But the latest air strikes on Tehran and Israel declaring that it had "full aerial operational control" over Tehran means tension are rising another bombardment of Tel Aviv was most likely on the agenda for Iran. Oil has been bouncing back as a result. So far, it hasn't impacted equities, with major US indices remaining near their session highs. But will that change if oil extends it recovery?
Key support at $68.60 has been defended as we can see on the hourly chart. $70.00/$70.10 is now reclaimed, which is a bullish sign. Resistance is seen around $72.20. Above that, $73.00 will be in focus.
By Fawad Razaqzada, market analyst with FOREX.com
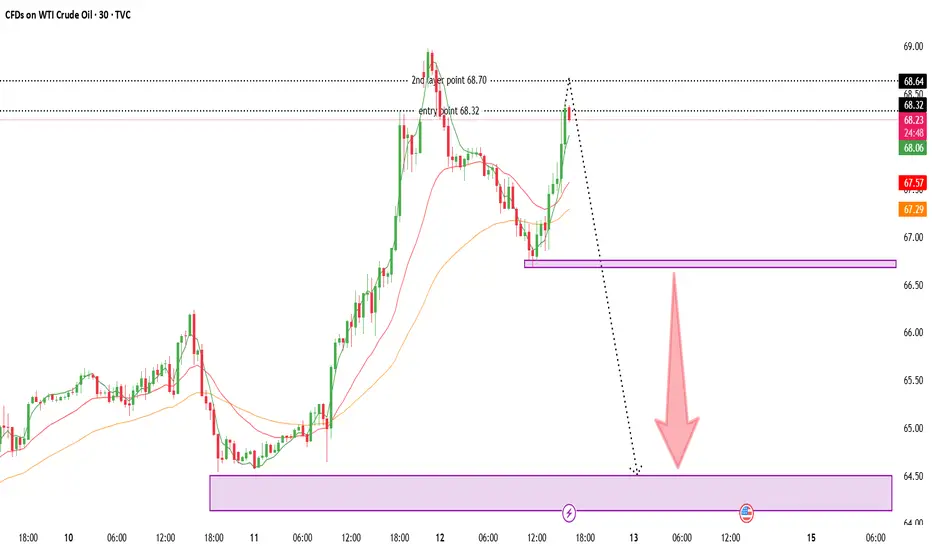
SELL TRADE IDEA Entry Point: 68.30SELL TRADE IDEA
Entry Point: 68.30
🔻 Initiating a SELL position on USOIL
🔍 Bearish trend forming – short-term weakness spotted
🎯 Final Target: 64.50
📉 Room for downside movement
📊 Following resistance rejection and trend signals
🛑 Risk Management Comes First
📌 Always set a stop-loss before entering
💼 Risk only what you can afford to lose
🔒 Protect your capital – it’s your trading fuel
🧠 Emotionless trading wins over time
📈 Adjust lot size to match account risk plan
⚠️ Oil markets can move fast – stay alert
⏱ Timeframe: Intraday to short-term swing
🚫 Avoid revenge trading – trust your setup
🔁 Re-evaluate if structure changes
🔧 Use trailing stops once in profit
💬 Smart trades are protected trades
#USOIL #CrudeOil #SellSignal #Commodities #RiskManagement #OilTrade
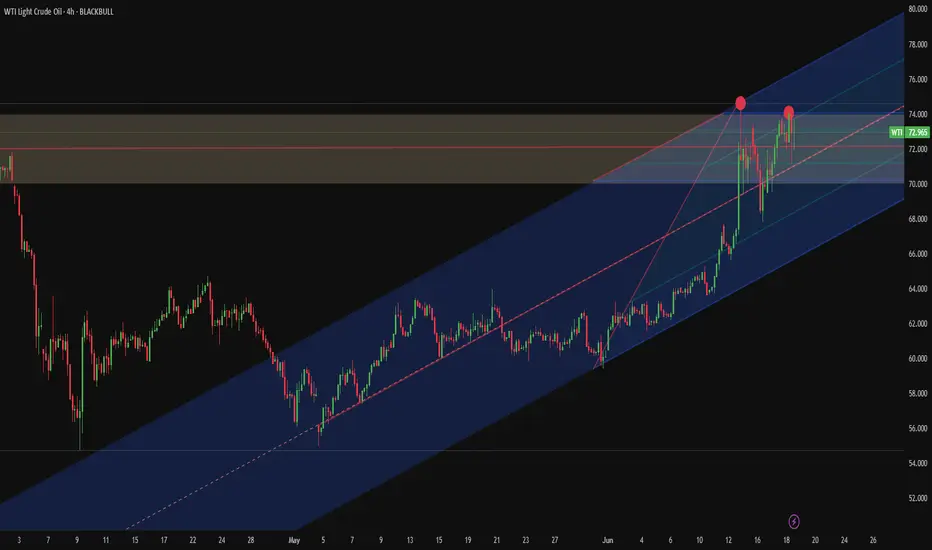
Strait of Hormuz risk priced in—or not yet?Iran has repeatedly threatened to block the Strait of Hormuz during periods of heightened tension with the U.S., notably in 2011, 2018, and 2020. The Strait is considered the world’s most critical oil chokepoint, with nearly 20 million barrels passing through daily.
Several banks warn that a full closure could push crude prices above $120–$150 per barrel, or higher if the disruption is prolonged. Still, most analysts view a complete shutdown as unlikely, since Iran also depends on the Strait to export its own oil.
Technically, recent WTI candles suggest that the risk premium may be fading. Price action near $74 shows hesitation, raising the risk of a developing double top—particularly if support at $70 fails. Unless tensions escalate materially, such as the U.S. becoming more directly involved, WTI may consolidate between $70–$74.
WTI above $75 on fears of US involvement in Israel-Iran conflictThe Israel-Iran situation is quite different this time and with Trump announcing that *we* now have full control over Iranian skies, suggesting the US is entering the fray – hardly a surprise to be honest - this is not going to end well. The conflict may get far worse in the short-term, and this will send shockwaves through the oil markets – especially if there are disruptions in the Strait of Hurmuz. Oil prices could easily spike to $100 and higher in the worst-case scenario. So, the situation is quite serious, unfortunately. Let's hope that it quickly de-escalates and lives are not lost.
But make no mistake, this could get really big - especially with headlines like these coming out in the last few minutes:
*US OFFICIALS SAY TRUMP 'SERIOUSLY CONSIDERING' STRIKE ON IRAN: AXIOS;
*TRUMP TO MAKE POLICY DECISION ON ISRAEL-IRAN: AXIOS
*IRAN WILL SOON LAUNCH 'PUNITIVE' OPERATION AGAINST ISRAEL: IRNA
The picture is looking quite grim, unfortunately.
by Fawad Razaqzada, market analyst with FOREX.com
USOIL:Go long
USOIL: Short-term momentum is still dominant, the trend of crude oil is expected to maintain a high shock upward rhythm.
Trading Strategy:
BUY@70.5-71
TP: 73-73.6
↓↓↓ More detailed strategies and trading will be notified here ↗↗↗
↓↓↓ Keep updated, come to "get" ↗↗↗
US OIL bullish rally !Technically, the $71-$74 range appears to be a reasonable short-term consolidation zone, provided no significant escalation in Iran tensions occurs. However, given the high likelihood of worsening tensions, USOIL may retest $80 and potentially even surpass $80 and can touch 86$, driven by geopolitical developments.
TVC:USOIL
entered @70$. SL 68.3$
partially booking @80
Holding rest till 85$ with Trailing SL
