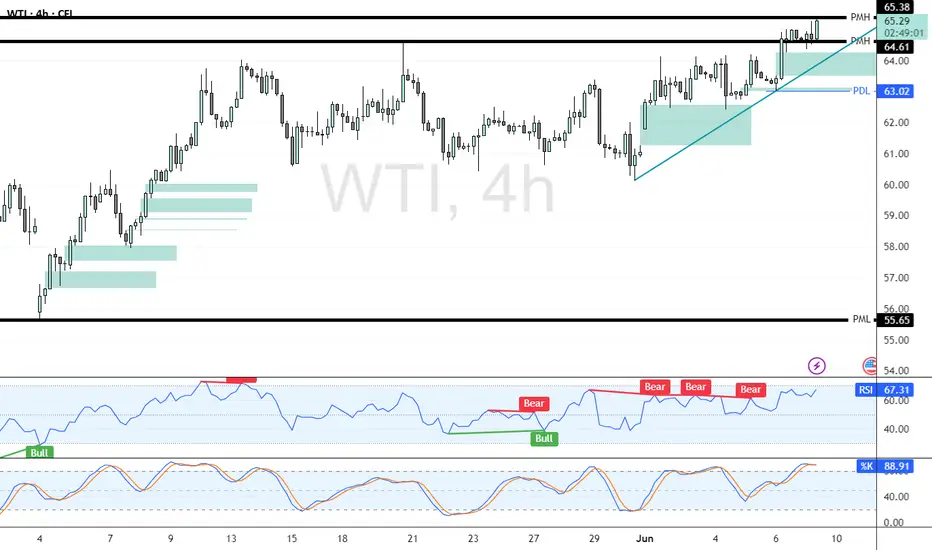
Crude Oil Tests Monthly High—Bullish or Liquidity Grab? FenzoFx—Crude Oil broke above its previous monthly high at $64.61, trading around $65.27. While a bullish trend is indicated by a 23,000 increase in buy-side contracts, technical signals suggest caution.
RSI 14 shows bearish divergence, and the Stochastic Oscillator remains overbought. Oil could consolidate before resuming its uptrend. Buying breakouts isn’t advised. A dip toward $63.02 may offer a discounted entry.
WTI trade ideas
$USOIL & $XLE: Sustainable bull run or short-term bounce?Recently the commodities and the commodity stocks are having a bull run. Oil being one of the largest categories within the Bloomberg Commodity Index Futures is late to the party after the AMEX:GLD rally. In my recent posts I made the case that the TVC:USOIL will remain range bound, and we will see 55 $ in $USOIL. But since then, TVC:USOIL has gone through a small rally with price currently @ 65 $ which has taken it closer to the 0.5 Fib retracement level. AMEX:XLE , which represents the S&P500 energy sector stocks, is also attempting to post a rally.
In the short-term markets have diverged from our last predictions. Let’s be honest in the short term such rallies might be accompanied by short covering and the weakness in TVC:DXY is also helping the Energy rally. But now the question comes where do we go from here?
TVC:USOIL and AMEX:XLE can have a bull rally due to short covering and momentum pushing it across the 0.5 Fib level. If TVC:USOIL breaks above 0.5 then the next stop 0.618 will take us 80 $ indicating a 25% upside form here. And a similar upside in the AMEX:XLE will take us 131 $, which is also 25% up from its current value and the upper range of the upward slopping channel indicative from the chart.
Verdict: Short term probable bounce in TVC:USOIL and $XLE. Long term bearish on TVC:USOIL with target 55 - 60 $.

TRADE ALERT: USOIL SELL SETUP ENTRY: 64.50 (Sell)TRADE ALERT: USOIL SELL SETUP
ENTRY: 64.50 (Sell)
🎯 Target 1: 64.00
🎯 Target 2: 63.00
🎯 Target 3: 62.00
🎯 Final Target: 60.00
🛑 STOP LOSS: Always use proper risk management!
⚠️ Risk no more than 1–2% of your capital per trade.
🔍 Setup based on technical analysis and price action.
💡 Breakdown:
• Strong resistance near 64.50
• Bearish momentum building
• Downtrend continuation likely
📊 Monitor volume and market sentiment
🧠 Stay disciplined, don’t chase entries
⏰ Timing is key — watch for confirmation
📅 Short to mid-term outlook
📌 This is not financial advice, just my trading plan.
✅ Stick to your rules
🔁 Trade the plan, not emotions
#USOIL #CrudeOil #TradingSignals #SellSetup #Forex #Commodities #RiskManagement #TradeSmart #TechnicalAnalysis #PriceAction

USOIL:Sharing of the Trading Strategy for Next WeekAll the trading signals this week have resulted in profits!!! Check it!!!👉👉👉
Fundamental Analysis:
OPEC+ plans to increase production by 411K bpd in July, with major producers like Saudi Arabia and the UAE holding ample idle capacity. This expansion could exacerbate global crude oil oversupply, pressuring prices. Concurrently, the U.S. steel import tariff hikes may trigger trade frictions, dampening global economic recovery and curbing industrial crude demand.
Technical Analysis:
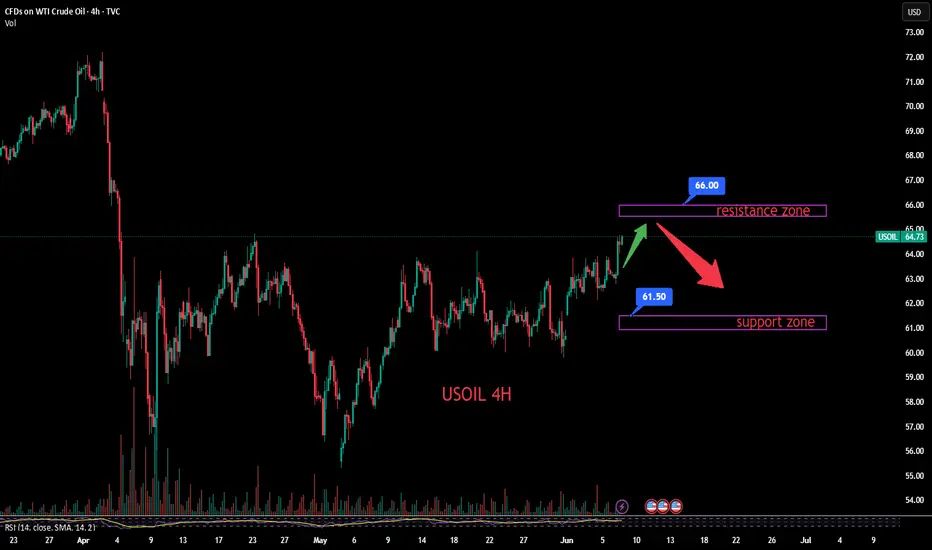
The MACD indicator shows expanding green bars (bearish momentum), with short-term moving averages trending toward a bearish crossover of long-term averages. However, recent price retracement from relative highs suggests potential rebound. Key resistance lies at the $66–67/barrel zone, while critical support holds at $61.5–62/barrel.
Trading Recommendation:
Aggressive traders may initiate light short positions near 66 on a confirmed resistance rejection.
Trading Strategy:
Sell@66-65.5
TP:63-62
Share accurate trading signals daily—transform your life starting now!
👇 👇 👇 Obtain signals👉👉👉
USOIL What Next? SELL!
My dear friends,
USOIL looks like it will make a good move, and here are the details:
The market is trading on 64.73 pivot level.
Bias - Bearish
Technical Indicators: Supper Trend generates a clear short signal while Pivot Point HL is currently determining the overall Bearish trend of the market.
Goal - 63.36
Recommended Stop Loss - 65.42
About Used Indicators:
Pivot points are a great way to identify areas of support and resistance, but they work best when combined with other kinds of technical analysis
Disclosure: I am part of Trade Nation's Influencer program and receive a monthly fee for using their TradingView charts in my analysis.
———————————
WISH YOU ALL LUCK
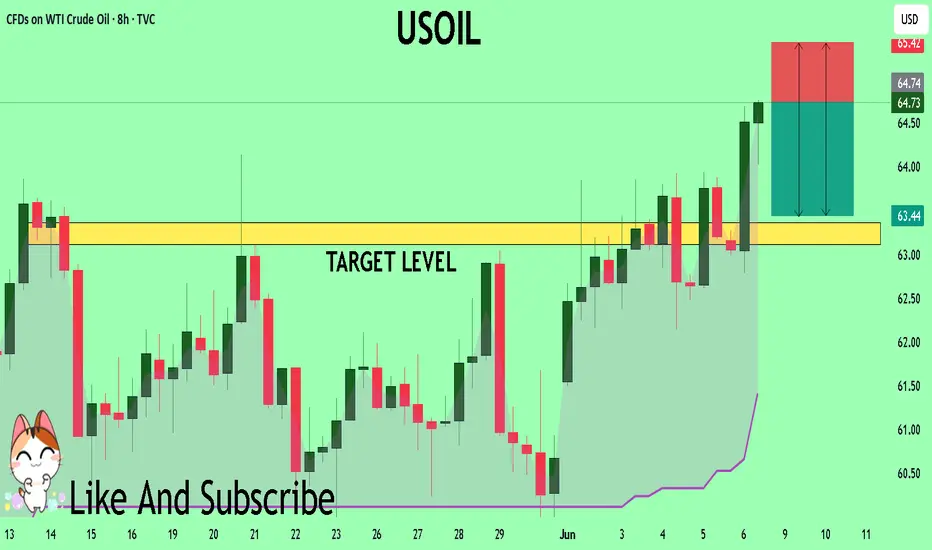
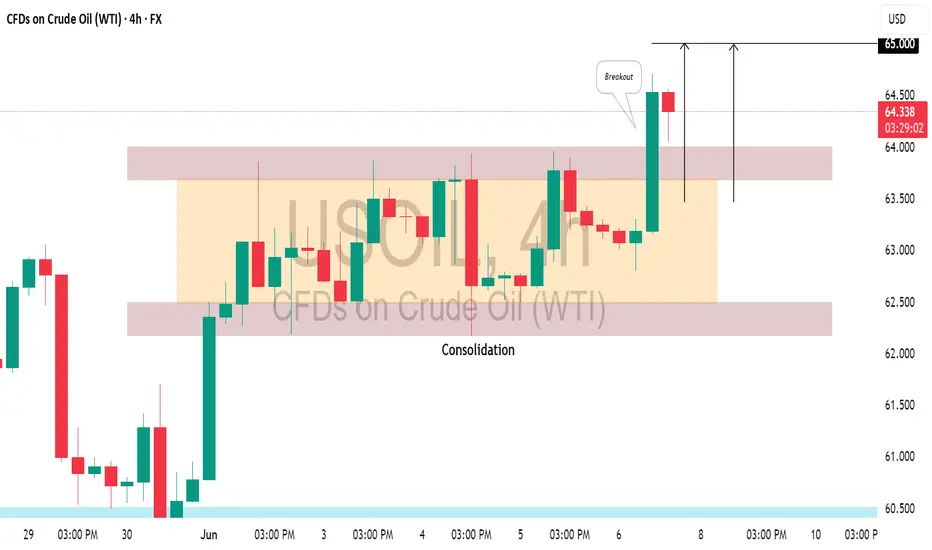
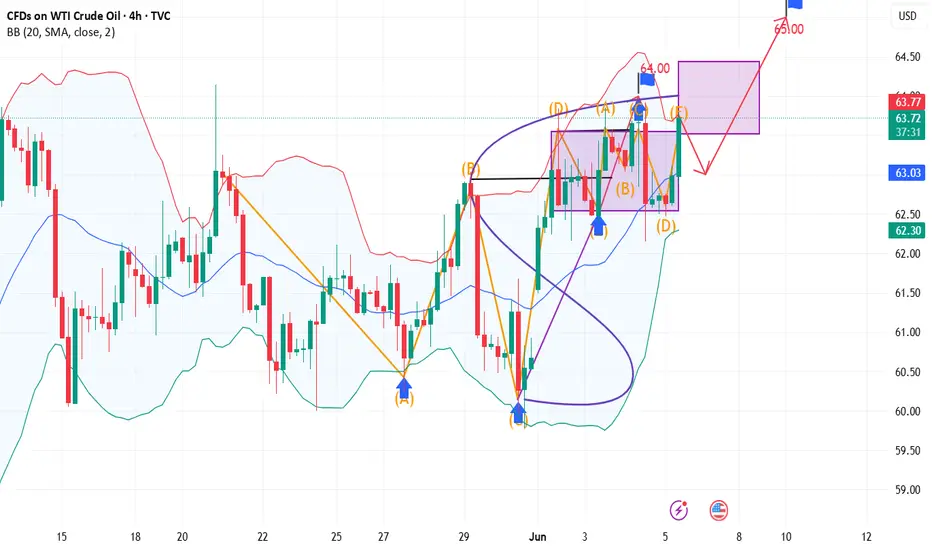
US CRUDE OIL(#WTI) : Bullish Trend Continues📈USOIL is trading in a bullish trend on a 4H time frame.
After a prolonged upward movement, it started to consolidated within a horizontal range for a while.
Recently, the resistance of this range was breached, indicating strong buyer momentum.
I believe the upward movement may persist, potentially leading the market to reach the 65.00 level soon.
USOILThe correlation between USOIL (WTI crude oil prices) and DXY (US Dollar Index) has historically been inverse, but structural shifts in global energy markets and economic dynamics are altering this relationship.
Oil is globally traded in USD. A stronger dollar makes oil more expensive for buyers using other currencies, potentially dampening demand and lowering oil prices. Conversely, a weaker dollar makes oil cheaper, boosting demand and prices.
Trade Balance Impact:
Historically, the U.S. was a net oil importer. Rising oil prices worsened its trade deficit, weakening the dollar. This reinforced the inverse correlation.
Recent Structural Shifts
U.S. as a Net Oil Exporter:
Since becoming the world’s largest crude oil producer (surpassing Saudi Arabia and Russia), higher oil prices now improve the U.S. trade balance by boosting export revenue. This has weakened the traditional inverse relationship
Geopolitical risks: Oil supply fears and safe-haven dollar demand can push both higher.
Federal Reserve Policy:
Hawkish monetary policies that strengthen the dollar can suppress oil prices, but if paired with strong U.S. growth (supporting oil demand), the correlation may turn neutral or positive.
Positive correlations may persist during risk-off events or U.S.-centric demand surges.
Inverse correlations likely resurface if global growth slows or the Fed pivots dovish.
The U.S. dollar may increasingly behave like a "petrocurrency," strengthening with oil prices as exports grow.
#usoil

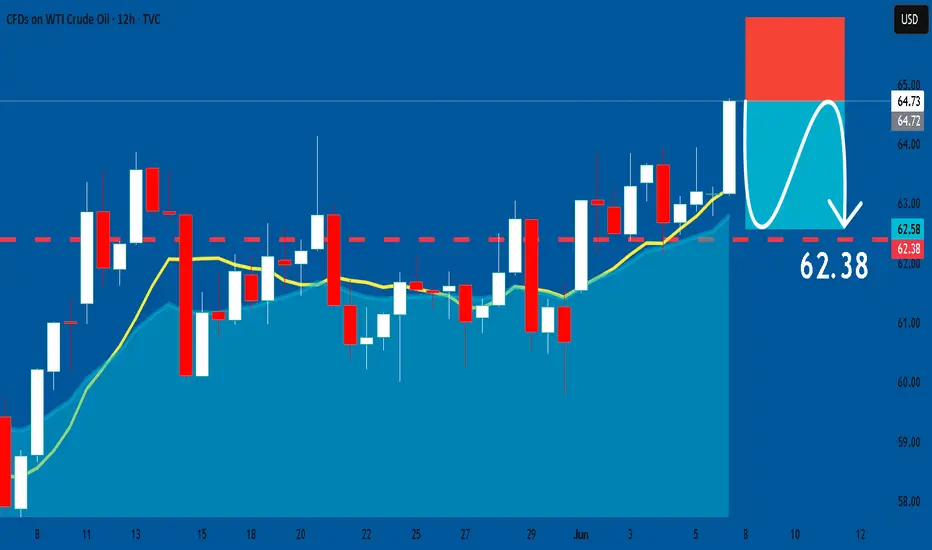
USOIL: Short Signal Explained
USOIL
- Classic bearish pattern
- Our team expects retracement
SUGGESTED TRADE:
Swing Trade
Sell USOIL
Entry - 64.73
Stop - 66.13
Take - 62.38
Our Risk - 1%
Start protection of your profits from lower levels
Disclosure: I am part of Trade Nation's Influencer program and receive a monthly fee for using their TradingView charts in my analysis.
❤️ Please, support our work with like & comment! ❤️
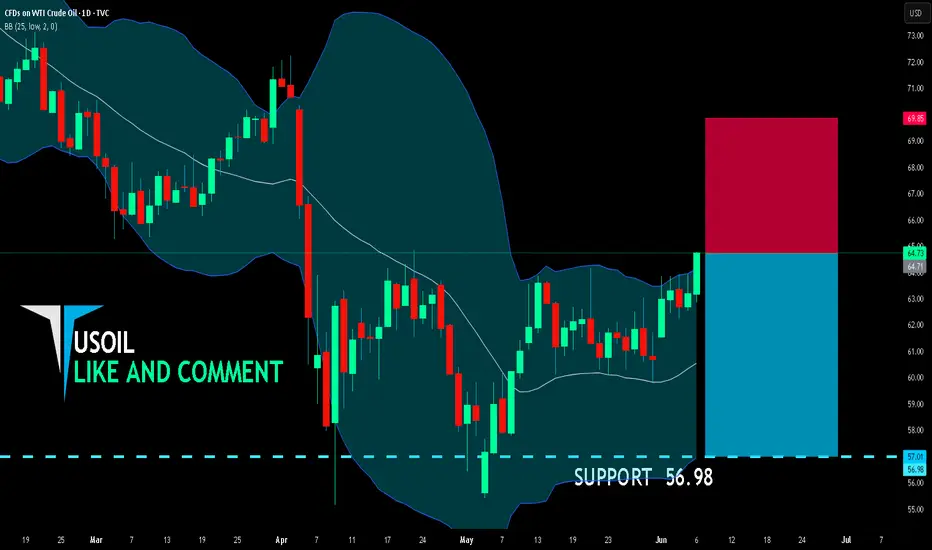
USOIL SHORT FROM RESISTANCE
USOIL SIGNAL
Trade Direction: short
Entry Level: 64.71
Target Level: 56.98
Stop Loss: 69.85
RISK PROFILE
Risk level: medium
Suggested risk: 1%
Timeframe: 1D
Disclosure: I am part of Trade Nation's Influencer program and receive a monthly fee for using their TradingView charts in my analysis.
✅LIKE AND COMMENT MY IDEAS✅
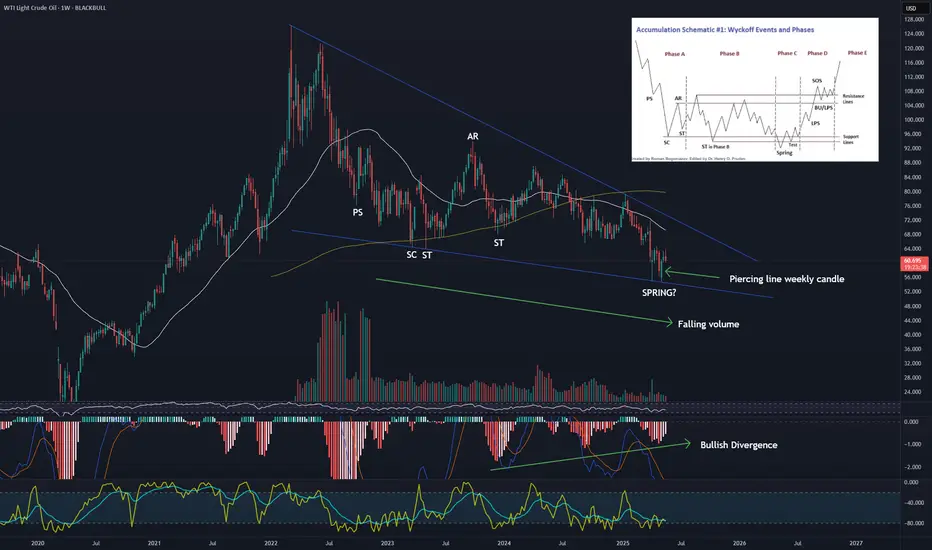
Textbook Falling Wedge & Wyckoff Accumulation Brewing?Analysis:
Looking at the daily chart for Crude Oil, we appear to be seeing a very compelling confluence of bullish technical signals that suggest a potential significant reversal to the upside.
Textbook Falling Wedge Formation:
Price action is clearly consolidating within a well-defined falling wedge pattern.
We have observed multiple clear touches (3+ on the upper, 4+ on the lower trendline), indicating these boundaries are highly respected by the market.
Crucially, volume has been declining as price consolidates within the wedge, a classic characteristic signifying diminishing selling pressure.
The angles of convergence also appear ideal, with the upper trendline being steeper than the lower.
Wyckoff Accumulation Schematic #1 in Play?
Diving deeper, the internal structure of this falling wedge strongly resembles Wyckoff's Accumulation Schematic #1.
We can identify potential phases:
PS (Preliminary Support): Early signs of buying.
SC (Selling Climax): A sharp sell-off often with high volume, marking potential capitulation.
AR (Automatic Rally): The first significant bounce after the SC.
ST (Secondary Test): Retesting the lows of the SC.
Spring: A key event where price dips below the established trading range support (or the wedge's lower trendline) only to quickly reverse back above it, effectively trapping sellers and confirming a shakeout of weak hands.
This internal Wyckoff structure within the falling wedge significantly strengthens the case for institutional accumulation taking place.
Bullish Candlestick & Oscillator Confluence:
At the recent lows, we observed a potential Piercing Line bullish reversal candlestick pattern forming right at the lower trendline of the wedge. This indicates aggressive buying stepping in.
The MACD indicator has confirmed this bullish shift, showing a recent bullish crossover (MACD line above Signal line) and a flip of the histogram from red to green.
Furthermore, there appears to be a bullish divergence on the MACD – as price made lower lows within the wedge, the MACD indicator made higher lows (or showed increasing bullish momentum), suggesting underlying bearish momentum is weakening significantly.
Market Sentiment & Potential Implications:
It's noteworthy that this bullish technical setup is occurring amidst increased bearish media and Twitter sentiment surrounding oil. From a contrarian perspective, extreme bearish sentiment often coincides with market bottoms, as "smart money" accumulates positions while the crowd is most pessimistic. This situation could set the stage for a strong reversal, potentially fueled by short covering.
Conclusion:
All signs from price action, volume, candlestick patterns, and oscillators point towards a high probability of a bullish reversal and an upside breakout from this well-formed falling wedge. The potential Wyckoff accumulation pattern adds significant weight to the idea that sophisticated players are positioning for a significant move higher.
What to Watch For:
The next critical step is a decisive breakout above the upper trendline of the falling wedge, ideally accompanied by a significant surge in buying volume. This would confirm the pattern's completion and signal the potential start of a new uptrend. A more aggressive approach is entering now and capturing more upside if it is to occur.
This is for educational purposes only and not financial advice. Always conduct your own research and manage your risk.
Crude oil pullback bullish trend
💡Message Strategy
Saudi price cuts and OPEC+ supply adjustments affect market sentiment
Crude oil came under pressure in the middle of the week after Saudi Arabia cut its July sales price to Asia to the lowest level in nearly two months. This follows OPEC+'s decision to increase production by 411,000 barrels per day in July, indicating that major oil producers are still prioritizing market share even amid volatile demand signals. This coordinated move by Saudi Arabia and Russia is seen as an attempt to constrain overproducers and strengthen control over global supply dynamics.
Refineries drive crude stock draw, but fuel demand lacks
Weekly data from the U.S. Energy Information Administration (EIA) delivered mixed messages. U.S. crude stockpiles fell by 4.3 million barrels to 436.1 million barrels, driven by a sharp increase in refinery runs, exceeding expectations. Utilization rose to 93.4%, indicating that refineries are preparing for a seasonal peak in demand. Adding to the bullish signal from the crude stock draw.
📊Technical aspects
On the technical side, the daily chart of WTI crude oil shows that oil prices have been under pressure for three consecutive trading days and are currently trading above the 20-day and 50-day moving averages, reflecting the dominance of short-term bullish sentiment. The MACD indicator shows a dead cross and the momentum column is enlarged, indicating that the upward trend is still continuing.
In the previous post, we have pointed out that the upward target and trend of crude oil have been reached. The main theme of crude oil in the future will still be a bullish correction.
💰 Strategy Package
Long Position: 62.50-63.00
OIL short termAfter yesterday rally today price must back down to first target 61.8-62 then to 61 and maybe we go lower to close GAP.
Could the price bounce from here?WTI Oil (WTI/USD) is falling towards the pivot, which has been identified as an overlap support and could bounce to the 1st resistance, which is a pullback resistance.
Pivot: 62.36
1st Support: 61.81
1st Resistance: 63.24
Risk Warning:
Trading Forex and CFDs carries a high level of risk to your capital and you should only trade with money you can afford to lose. Trading Forex and CFDs may not be suitable for all investors, so please ensure that you fully understand the risks involved and seek independent advice if necessary.
Disclaimer:
The above opinions given constitute general market commentary, and do not constitute the opinion or advice of IC Markets or any form of personal or investment advice.
Any opinions, news, research, analyses, prices, other information, or links to third-party sites contained on this website are provided on an "as-is" basis, are intended only to be informative, is not an advice nor a recommendation, nor research, or a record of our trading prices, or an offer of, or solicitation for a transaction in any financial instrument and thus should not be treated as such. The information provided does not involve any specific investment objectives, financial situation and needs of any specific person who may receive it. Please be aware, that past performance is not a reliable indicator of future performance and/or results. Past Performance or Forward-looking scenarios based upon the reasonable beliefs of the third-party provider are not a guarantee of future performance. Actual results may differ materially from those anticipated in forward-looking or past performance statements. IC Markets makes no representation or warranty and assumes no liability as to the accuracy or completeness of the information provided, nor any loss arising from any investment based on a recommendation, forecast or any information supplied by any third-party.

Today's crude oil trading strategy, I hope it will be helpful to Crude Oil Trend Analysis
(1) Geopolitics: Tensions Propel Oil Price Expectations
The Middle East has long been a "powder keg" for the crude oil market, and recent developments have intensified tensions. Military conflicts between Iran and Israel continue to escalate—Iran’s latest attacks injured approximately 50 people in Israel. Controlling the Strait of Hormuz, through which 30% of global seaborne crude oil passes, Iran’s strategic position is pivotal. After the conflict escalated, Iran threatened to block the strait, instantly igniting international oil prices. Brent crude surged to around $79 per barrel. As long as the conflict persists, market fears of crude supply disruptions—like an invisible hand—will continue to underpin price gains.
(2) Supply Side: Interplay of Production Increases and Geopolitical Risks
OPEC+ previously announced plans to increase production by 411,000 barrels per day, but actual output growth has fallen short of market expectations. With current Middle East tensions, the feasibility of this plan remains uncertain. If Iran’s crude production and exports are constrained by the conflict, global supply could tighten. In the U.S., shale oil production remains unstable, affected by technical, cost, and policy factors. Thus, the supply side is fraught with uncertainty: production increase expectations may exert downward pressure on prices, while geopolitical risks could tighten supply outlooks and push prices higher.
(3) Demand Side: Battle Between Seasonality and Economic Prospects
From a seasonal perspective, the northern hemisphere’s summer travel peak has boosted demand for petroleum products like gasoline and jet fuel. Data from the U.S. Energy Information Administration (EIA) shows U.S. crude oil inventories have declined for several consecutive weeks, indicating rising market demand. However, the global economic environment remains bleak: trade protectionism, tariff policies, and other factors have slowed global growth, constraining crude demand. Major economies like China and Europe have failed to meet oil demand projections. Thus, the demand side is torn: seasonal factors provide support, but economic headwinds act as a drag.
Today's crude oil trading strategy, I hope it will be helpful to you
USOIL BUY@72.5~73
SL:71.5
TP:74~75
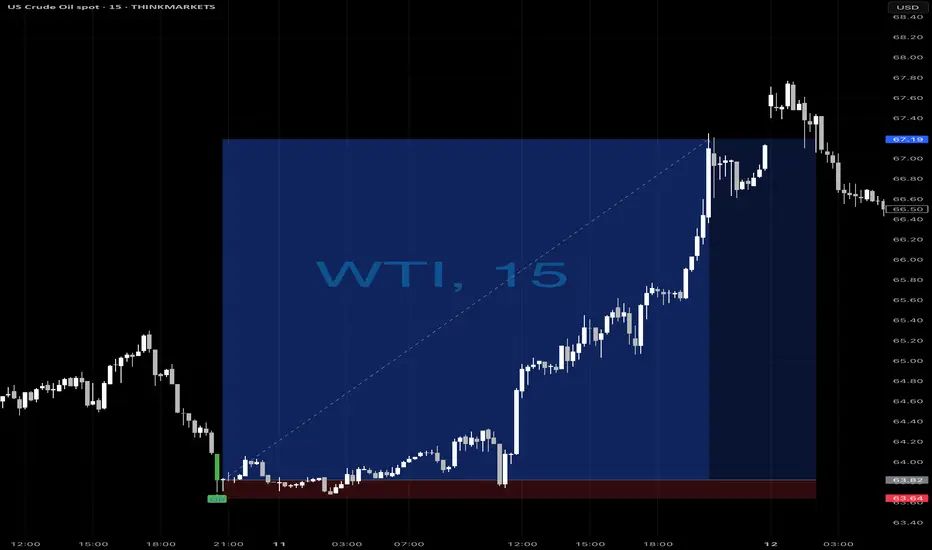
Oil diggers?🚀💥 OIL-DIGGERS, where you at?!
WTI delivered a picture-perfect reversal off the ELFIEDT – X-REVERSION signal, printing a clean “UP” just before price launched over 300 ticks straight up!
This is what happens when you combine exhaustion, momentum shift, and smart signal logic — early entries, minimal risk, and maximum juice.
🎯 SL below the signal candle. No hesitation. Just execution.
🛢️ If you trade oil and didn’t catch this one… it’s time to add this tool to your chart.
#WTI #OilTrading #Reversion #ELFIEDT #SmartMoneyMoves #TradingViewScripts #TrendReversal #CrudeOil
Trump’s “ambiguous” statement, where will oil prices go?
💡Message Strategy
Trump's remarks are repeated, and the geopolitical premium still limits the downward space of oil prices
Trump said that the United States "may or may not" join Israel's actions against Iran. Analysts pointed out that if the United States is officially involved in the conflict, oil prices may rise by $5; if peace talks are launched, they may fall by the same amount.
The geopolitical focus is still on the Strait of Hormuz
Iran produces 3.3 million barrels of oil per day, but more importantly, about 19 million barrels of crude oil are transported through the Strait of Hormuz. The escalation of the conflict may threaten the safety of the waterway.
The Fed's policy turn to dovish failed to effectively support oil prices
Although the Fed hinted that it may cut interest rates twice this year, Chairman Powell emphasized that the decision still depends on inflation data, and Trump's upcoming new round of import tariffs may push up prices and limit the boost in oil demand brought about by loose policies.
📊Technical aspects
From the daily chart level, crude oil prices in the medium term broke through the upper resistance of the range and tested a new high of 75.50. The moving average system is in a bullish arrangement, and the medium-term objective trend is in the direction.
The current trend is in the upward rhythm of the main trend. The MACD indicator fast and slow lines overlap with the bullish column above the zero axis, indicating that the bullish momentum is currently full, and it is expected that the medium-term trend is expected to usher in a wave of rising rhythm.
💰Strategy Package
Long Position:73.00-73.50,SL:72.50
The first target is around 75.50
The second target is around 76.50
If the situation in the Middle East escalates, the room for crude oil to rise will be enlarged

WTI Oil H1 | Overlap resistance at 61.8% Fibonacci retracementWTI oil (USOIL) is rising towards an overlap resistance and could potentially reverse off this level to drop lower.
Sell entry is at 76.02 which is an overlap resistance that aligns closely with the 61.8% Fibonacci retracement.
Stop loss is at 78.00 which is a level that sits above a multi-swing-high resistance.
Take profit is at 71.40 which is a swing-low support that aligns closely with the 78.6% Fibonacci retracement.
High Risk Investment Warning
Trading Forex/CFDs on margin carries a high level of risk and may not be suitable for all investors. Leverage can work against you.
Stratos Markets Limited (tradu.com ):
CFDs are complex instruments and come with a high risk of losing money rapidly due to leverage. 63% of retail investor accounts lose money when trading CFDs with this provider. You should consider whether you understand how CFDs work and whether you can afford to take the high risk of losing your money.
Stratos Europe Ltd (tradu.com ):
CFDs are complex instruments and come with a high risk of losing money rapidly due to leverage. 63% of retail investor accounts lose money when trading CFDs with this provider. You should consider whether you understand how CFDs work and whether you can afford to take the high risk of losing your money.
Stratos Global LLC (tradu.com ):
Losses can exceed deposits.
Please be advised that the information presented on TradingView is provided to Tradu (‘Company’, ‘we’) by a third-party provider (‘TFA Global Pte Ltd’). Please be reminded that you are solely responsible for the trading decisions on your account. There is a very high degree of risk involved in trading. Any information and/or content is intended entirely for research, educational and informational purposes only and does not constitute investment or consultation advice or investment strategy. The information is not tailored to the investment needs of any specific person and therefore does not involve a consideration of any of the investment objectives, financial situation or needs of any viewer that may receive it. Kindly also note that past performance is not a reliable indicator of future results. Actual results may differ materially from those anticipated in forward-looking or past performance statements. We assume no liability as to the accuracy or completeness of any of the information and/or content provided herein and the Company cannot be held responsible for any omission, mistake nor for any loss or damage including without limitation to any loss of profit which may arise from reliance on any information supplied by TFA Global Pte Ltd.
The speaker(s) is neither an employee, agent nor representative of Tradu and is therefore acting independently. The opinions given are their own, constitute general market commentary, and do not constitute the opinion or advice of Tradu or any form of personal or investment advice. Tradu neither endorses nor guarantees offerings of third-party speakers, nor is Tradu responsible for the content, veracity or opinions of third-party speakers, presenters or participants.

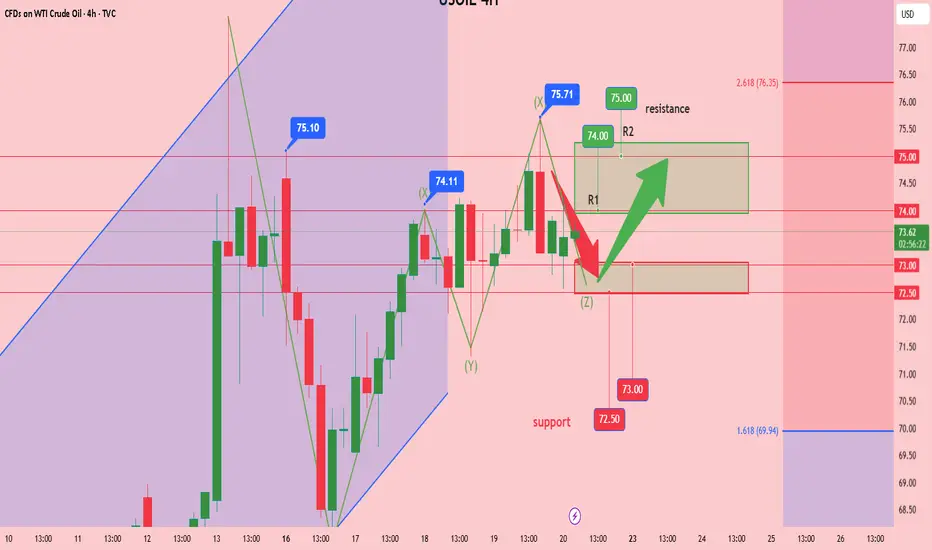
Will oil prices fall after the sharp surge in crude oil?Oil prices corrected under the dual pressure of news-driven factors and inventory data. Brent crude oil futures traded in a narrow range, reaching $76.38 per barrel, while WTI July contracts edged down to $73.35 per barrel. With intensified geopolitical uncertainties, market sentiment remains dominated by wait-and-see attitudes. The unexpected increase in EIA crude oil inventories dampened market optimism. According to the latest data from the U.S. Energy Information Administration (EIA), crude oil inventories in the U.S. increased by 2.6 million barrels for the week ending June 14, far exceeding the market expectation of a 1.1 million barrel decline, indicating weak demand. The rebound in inventories has exerted downward pressure on oil prices.
Oil prices have repeatedly crossed the moving average system, with the short-term objective trend showing a range-bound rhythm. In terms of momentum, the MACD indicator is intertwined near the upper side of the zero axis, reflecting weak bullish momentum. It is expected that crude oil prices will mainly maintain a consolidative pattern, with the trading range between 79.00 and 73.00.
you are currently struggling with losses,or are unsure which of the numerous trading strategies to follow,You have the option to join our VIP program. I will assist you and provide you with accurate trading signals, enabling you to navigate the financial markets with greater confidence and potentially achieve optimal trading results.
Trading Strategy:
buy@75.0-76.0
TP:78.0-79.0

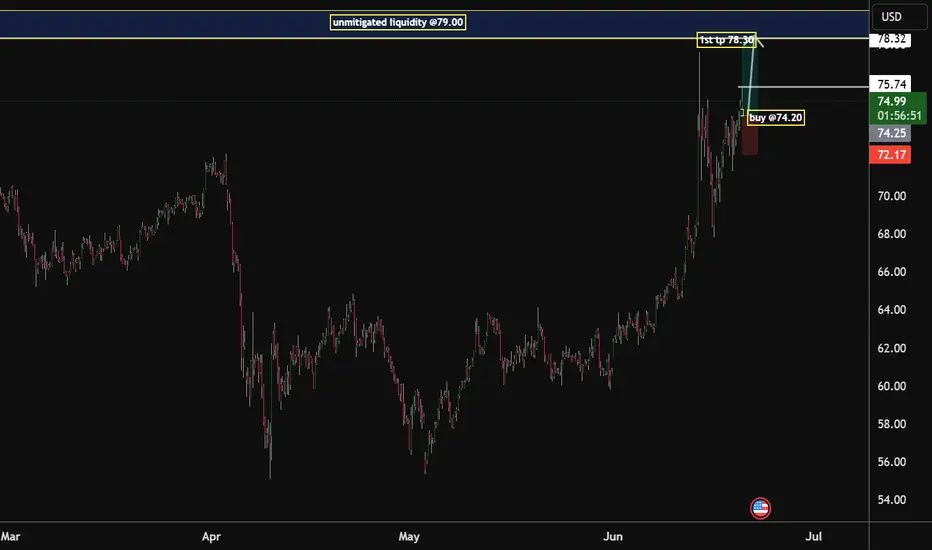
oil price Rise to seeking to mitigate the $ 78.00 per barrelCrude oil extended its rally to over $76.5 per barrel, the highest in five months, as worsening geopolitical tension threatened the supply of energy from the key region. Israel and Iran continued to exchange missiles late in the week. President Trump struck a hawkish tone against Iran to maintain the possibility of US involvement, which would risk global conflict and cut off tanker activity through the Strait of Hormuz. The demand for the crude will be so high that it will drive the Barrel at around $ 78.00 per barrel,that being said i will be aiming for the following areas
Main target for the week
Buy zone @74.00
tp 1:@78.00
The wealth code of crude oil is: low and long
💡Message Strategy
According to market research, Iran's crude oil export infrastructure has not been directly hit yet, and most of the impact is still concentrated on shipping. However, analysts pointed out that once the conflict spreads to the entire region, oil prices are likely to rise further.
The Strait of Hormuz has become the market's biggest concern. It is the throat of about one-fifth of the world's crude oil supply. Although there is no sign that Iran is trying to block the channel, any escalation of the situation may pose a serious threat to the global energy supply chain.
"Trump's threat to Iran's supreme leader shows that diplomatic channels are no longer effective," said Charu Chanana, chief investment strategist at Saxo Financial Markets Ltd. in Singapore. "If Iran's exports are interrupted, or even in the worst case scenario such as the Hormuz blockade, oil prices may soar rapidly."
The rise in geopolitical risks has also triggered turmoil in financial markets, with investors turning to safe-haven assets such as gold, and the volatility of the crude oil market has hit a three-year high. At the same time, crude oil producers have stepped up hedging operations, and futures and options trading volumes have surged.
The latest API crude oil inventory data showed that U.S. crude oil inventories fell sharply last week, further reinforcing market expectations of tight supply. According to data released by the American Petroleum Institute (API) in the early hours of June 18, U.S. crude oil inventories fell by 11 million barrels in the week ending June 14, far exceeding market expectations of a decline of 2.5 million barrels, marking the largest weekly drop since August last year.
📊Technical aspects
From a technical perspective, the daily chart of US crude oil (WTI) shows a clear bullish trend. After breaking through the previous high of $72, the price quickly rose and stabilized above $75, showing strong upward momentum. The current K-line has closed with long positive lines, and the red column of the MACD indicator has expanded, and the fast and slow lines have crossed, indicating that the bullish momentum continues to increase.
At the same time, the price has moved away from the 20-day and 50-day moving averages. There is a possibility of a technical correction in the short term, but the overall trend is still upward. If the geopolitical situation continues to be tense, the target may be raised to $77.5 or even the integer mark of $80, and the support will focus on the vicinity of $72.50.
💰 Strategy Package
Crude oil has reached our upward target of 74.00 yesterday and fell back. The current upward pressure on crude oil is around 75.50. If it breaks through upward, it will soon reach our second target of 77.50.
rend: Upward trend
Support: Around 72.50
Resistance: Around 75.50
Long Position:72.00-72.50,SL:71.50
The first target is around 75.00
The second target is around 77.50

USOILTrend: Bullish on Daily / 4H — making higher highs/lows.
However, price is now near a supply zone / local resistance at $75.60–$76.00.
You're executing a scalp short trade on a potential rejection at resistance before continuation.
USOIL – Short Setup in Bullish Context
Position: Sell (Short)
Entry: $75.672
Targets:
🎯 TP1: $74.600
🎯 TP2: $73.800
Stop Loss: ❌ $76.500
Trend Context: Medium-term bullish – shorting short-term resistance rejection

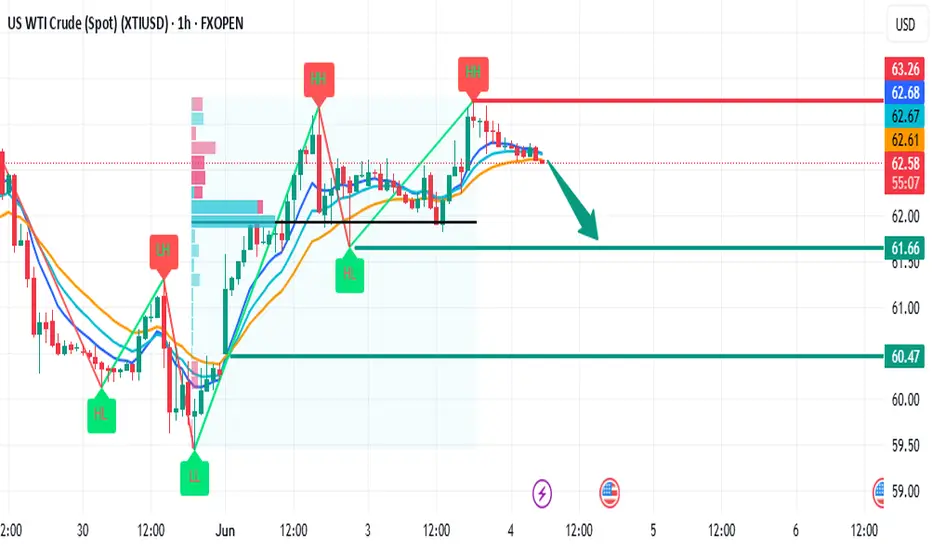
USOIL Bearish Reversal Setup from Rising Wedge Near Value AreaThis 1H chart of USOIL (WTI Crude Oil) shows a clear rising wedge formation approaching a strong supply zone near the $75.07 resistance level. The projection suggests a potential liquidity grab above the wedge, followed by a sharp bearish breakdown. The target for the drop is around $66.36, indicating a significant downside move after a failed breakout attempt. Price action traders should watch for bearish confirmation once the structure breaks.

Oil Traders Brace for Impact: US War or Pullback?WTI Crude Oil – Intraday Update: Tension Builds Inside Rising Channel
1H Technical Outlook — June 18, 2025
🧭 Current Market Structure:
WTI is currently trading at $72.54, holding above key support but struggling to break through a strong intraday supply zone around $73.80–74.00. Price has formed a rising channel, gradually climbing with higher highs and higher lows—often a pre-breakout structure.
Momentum on the Stochastic oscillator is turning, suggesting the market is preparing for a strong directional move.
📊 Key Technical Levels:
Resistance Zones:
$74.00 – intraday supply
$76.00 – swing high zone
$78.00+ – war-driven extension target
Support Zones:
$70.00 – mid-channel & psychological level
$68.00 – previous breakout zone
$66.00 – bearish continuation target if war is ruled out
🔺 Scenario 1: US-Iran War Escalates (Bullish Breakout)
If the U.S. launches airstrikes or there is confirmed military escalation:
Expect immediate breakout above $74.00.
Price likely to test $76.00, followed by an impulsive move toward $78.00+.
Intraday traders should watch for breakout retest setups on lower timeframes (M15/M5).
🛢️ Market could price in a $5–$10 geopolitical premium per barrel within hours if conflict begins.
🔻 Scenario 2: No War / De-escalation (Bearish Breakdown)
If headlines signal de-escalation or diplomacy:
Rising channel may break to the downside.
WTI could fall back to test $70.00, and if broken, flush toward $68.00–66.00 support.
Watch for bearish engulfing candles, divergence, or momentum fading.
📉 Oil often unwinds risk premium quickly when fear fades — beware sharp selloffs.
🔁 Neutral Intraday Note:
Price currently consolidating between $72.00–74.00 inside an ascending channel.
Break above or below this range will dictate momentum.
Wait for confirmation candle close before entering breakout trades.
🛡️ Risk Management:
Avoid large overnight positions — news headlines can cause gaps or whipsaws.
Use tight stops if trading breakout/down; volatility is news-driven.
Consider options strategies for limited risk exposure (calls above $74 / puts below $70).
📢 If you found this analysis valuable, kindly consider boosting and following for more updates.
⚠️ Disclaimer: This content is intended for educational purposes only and does not constitute financial advice.
