Wormhole Token Recovers From Bottom & Activates 2,400% PotentialTrue bottom and true recovery. We have a great situation here, this is a pair that has more than 2,400% potential for growth. The chart looks great right now, the signals are strong and confirmed.
Good afternoon my fellow Cryptocurrency trader, I hope you are having a nice Saturday. Let's consider
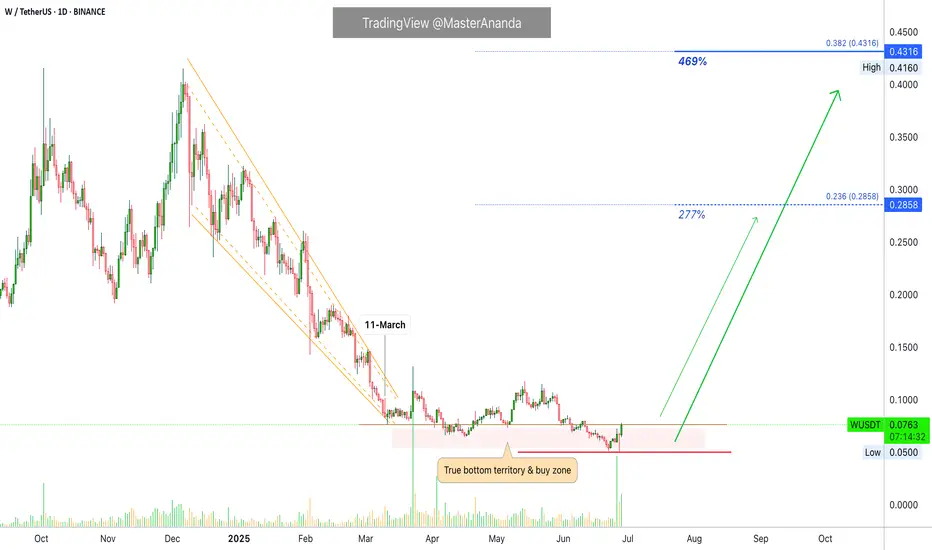
W/USDTKey Level Zone: 0.06700 - 0.07000
LMT v2.0 detected.
The setup looks promising—price previously trended upward with rising volume and momentum, then retested this zone cleanly. This presents an excellent reward-to-risk opportunity if momentum continues to align.
Introducing LMT (Levels & Momentum

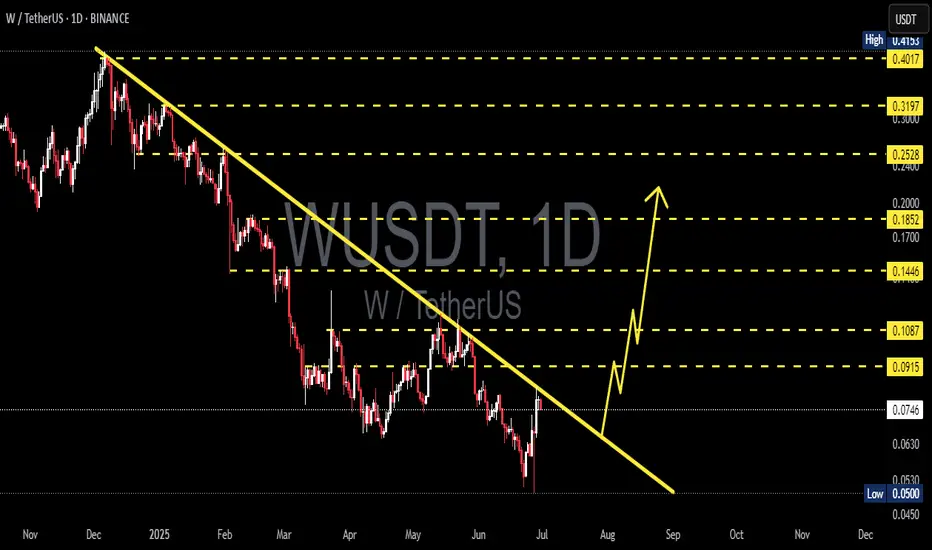
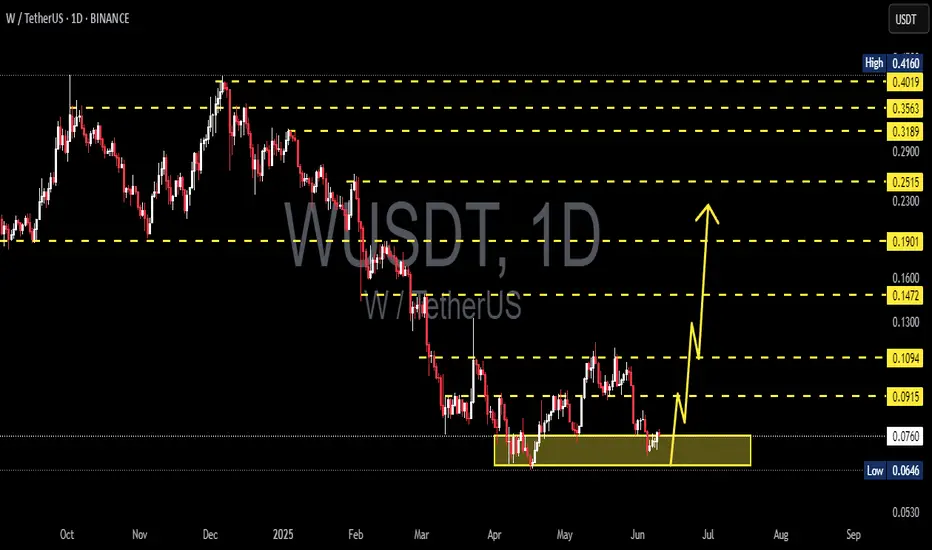
W/USDT Breaks Downtrend! Is This the Start of a Bullish Reversal🔍 Pattern and Chart Structure:
Timeframe: 1D (Daily)
Pattern: Breakout from a Descending Trendline that has been intact since late 2024.
Support and Resistance Levels:
Closest support: $0.0744
Key resistances: $0.0915 – $0.1087 – $0.1446 – $0.1852 – $0.2528 – $0.3197 – $0.4017
Volume & Momentu
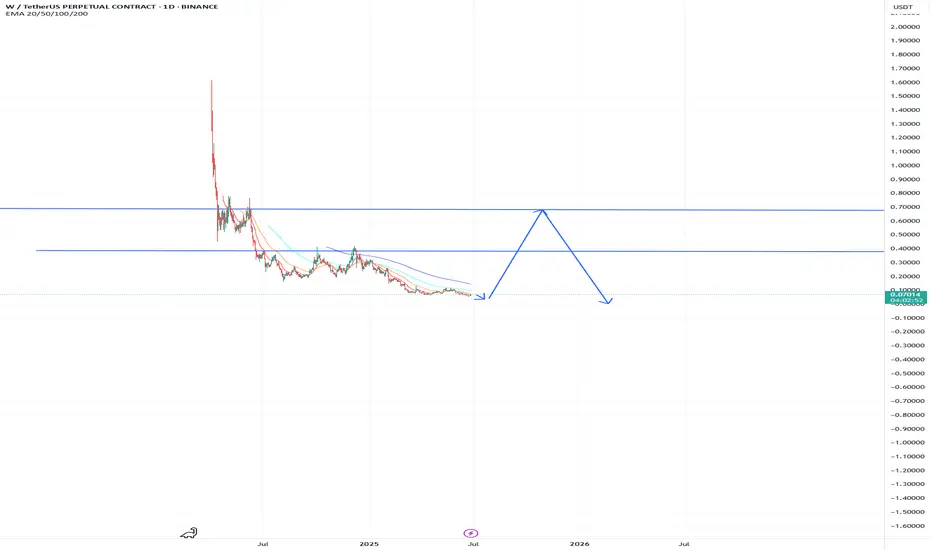
w partners with Ripple XRP.. alt season gemwhen alt season comes Q4 i expect $W to scam pump..
today it pumped 24% on the news with the partnership with Ripple / CRYPTOCAP:XRP
im waiting for a bottom around 3-4c to DCA in..
sell zone around 55-70c Q4
WUSDT Forming Falling WedgeWUSDT is beginning to show a powerful breakout signal from a well-defined falling wedge pattern, a classic technical setup often followed by strong bullish momentum. After weeks of steady downward pressure, the price has now pushed above the upper trendline, supported by growing volume, which furthe
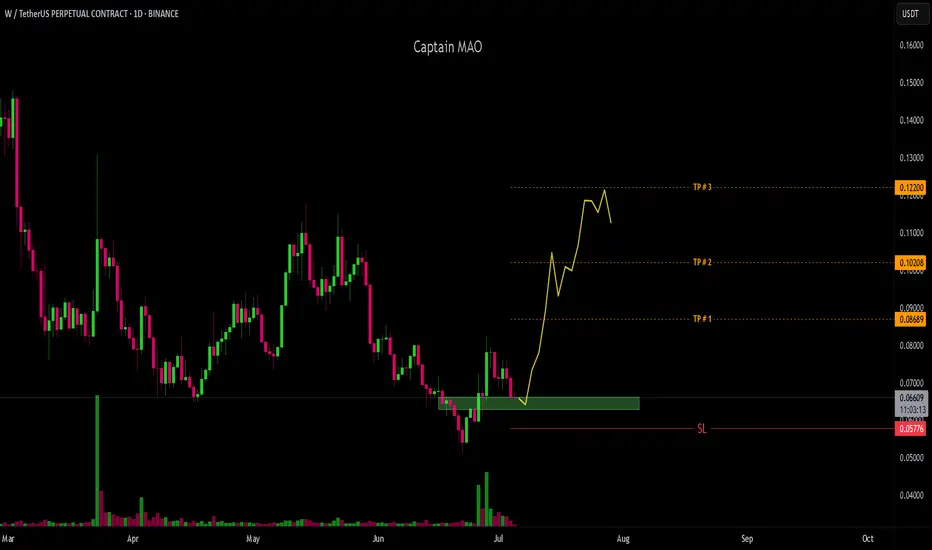
W/USDT Buy setup W/USDT has recently reclaimed the key 0.065 flip zone with strong confirmation from volume — signaling a clear renewed buyer interest. This level now acts as a solid support as the market gears up for the next leg higher.
After a healthy 20% correction, the price is offering an ideal re-entry oppor
WUSDT 1D Analysis W ~ 1D Analysis
#W Buy back gradually from here if you still have confidence in this coin with a short term target of at least 15%+
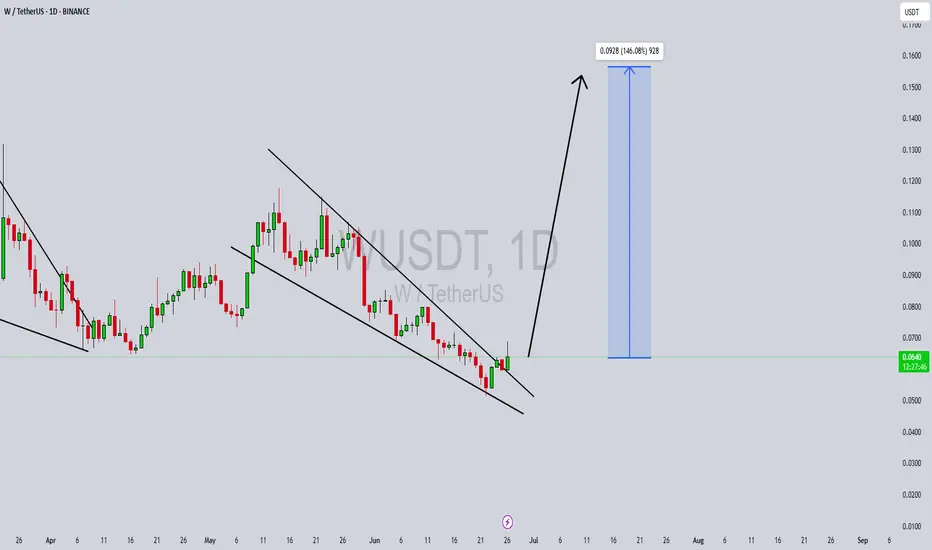
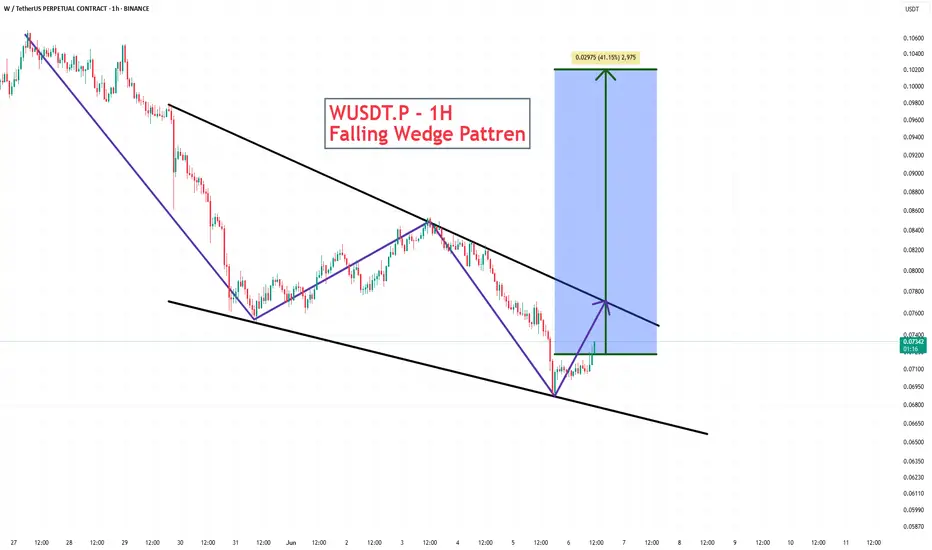
WUSDT.P - 1H Falling Wedge pattren🛫 COIN : WUSDT.P
🕯 CHART : 1H
📊 PATTREN : FALLING WEDGE
🔼 POSITION : BULLISH📈
💵1 Target - $ 0.07460
💵2 Target - $ 0.07675
💵3 Target - $ 0.07865
💵4 Target - $ 0.08140
💵5 Target - $ 0.08390
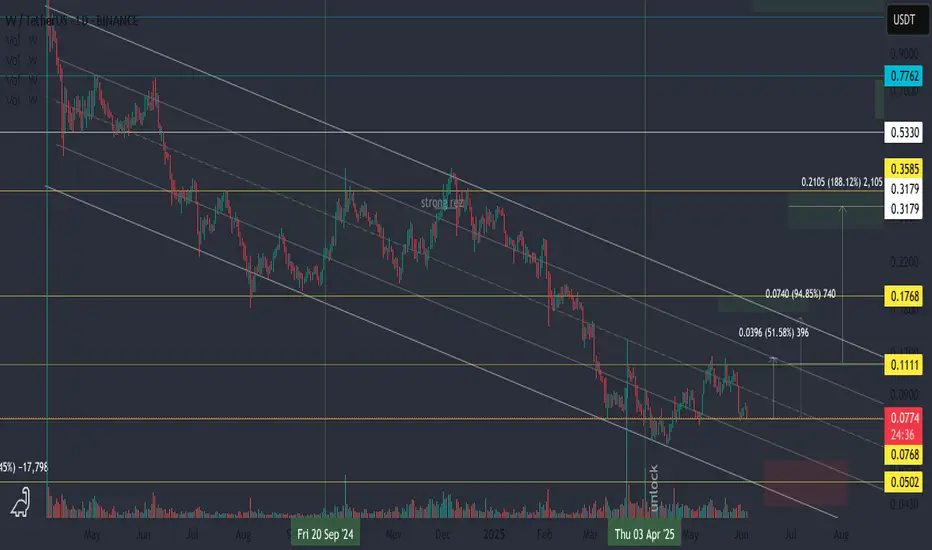
W/USDT continues to move within a well-defined descending chann🔻 The price has dropped around –96% from its all-time high.
That doesn’t guarantee a bottom — but further downside is no longer a given.
🚫 Opening shorts in this zone looks questionable,
especially considering the broader altcoin market structure.
📊 A more strategic approach would be to trade from
WUSDT.P Make a FALLING WEDGE pattren in 3D chart🛫 COIN : WUSDT.P
🕯 CHART : 3D
📊 PATTREN : FALLING WEDGE
🔼 POSITION : BULLISH📈
💵1 Target - $ 0.4156
💵2 Target - $ 0.6233
💵3 Target - $ 0.9740
💵4 Target - $ 1.2150
💵5 Target - $ 2.3550

See all ideas
Summarizing what the indicators are suggesting.
Oscillators
Neutral
SellBuy
Strong sellStrong buy
Strong sellSellNeutralBuyStrong buy
Oscillators
Neutral
SellBuy
Strong sellStrong buy
Strong sellSellNeutralBuyStrong buy
Summary
Neutral
SellBuy
Strong sellStrong buy
Strong sellSellNeutralBuyStrong buy
Summary
Neutral
SellBuy
Strong sellStrong buy
Strong sellSellNeutralBuyStrong buy
Summary
Neutral
SellBuy
Strong sellStrong buy
Strong sellSellNeutralBuyStrong buy
Moving Averages
Neutral
SellBuy
Strong sellStrong buy
Strong sellSellNeutralBuyStrong buy
Moving Averages
Neutral
SellBuy
Strong sellStrong buy
Strong sellSellNeutralBuyStrong buy
Displays a symbol's price movements over previous years to identify recurring trends.