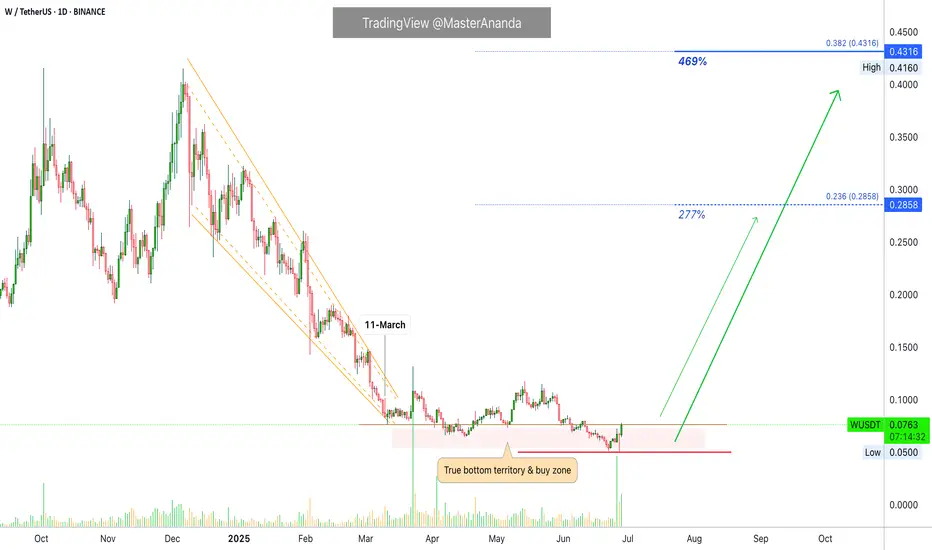
Wormhole Token Recovers From Bottom & Activates 2,400% PotentialTrue bottom and true recovery. We have a great situation here, this is a pair that has more than 2,400% potential for growth. The chart looks great right now, the signals are strong and confirmed.
Good afternoon my fellow Cryptocurrency trader, I hope you are having a nice Saturday. Let's consider this chart, a great opportunity for sure.
Wormhole Token (WUSDT) entered bottom zone 11-March, so already 111 days trading at bottom prices. The best time to buy.
After this initial low in March we have huge volume after a few days, and just two days ago another strong buyers day with a followup composed of two bullish signals. The DragonFly Doji yesterday and the full green candle today.
These are all strong bullish signals fully confirmed, which means higher prices next. I am showing only the daily chart but the potential for growth is extraordinary when focused on the long-term. This publication is time-based.
Right now we have great entry timing and prices...
The time is right, the time is ripe.
Another great altcoin for those looking to profit massively from the 2025 bull market.
Thank you for reading.
Namaste.
WUSDT trade ideas
w partners with Ripple XRP.. alt season gemwhen alt season comes Q4 i expect $W to scam pump..
today it pumped 24% on the news with the partnership with Ripple / CRYPTOCAP:XRP
im waiting for a bottom around 3-4c to DCA in..
sell zone around 55-70c Q4
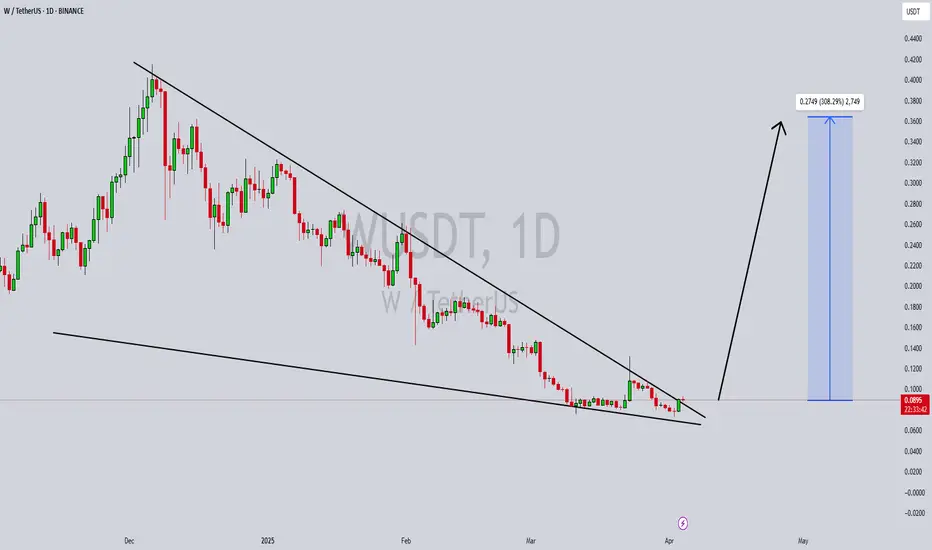
WUSDT Forming Falling WedgeWUSDT is beginning to show a powerful breakout signal from a well-defined falling wedge pattern, a classic technical setup often followed by strong bullish momentum. After weeks of steady downward pressure, the price has now pushed above the upper trendline, supported by growing volume, which further confirms the potential reversal in trend. This technical structure typically precedes large percentage moves, and in this case, an upside potential of 130% to 140%+ is projected.
This surge in price action is drawing significant attention from investors and traders alike, as WUSDT is currently trading at relatively undervalued levels with a visible shift in sentiment. The bullish wave forming on the chart shows not only strong technical demand but also a renewed sense of accumulation across the market. The broader altcoin market cycle also supports such aggressive moves as traders rotate into undervalued tokens with high reward potential.
Increased trading activity and volume on the breakout confirms that institutional and retail interest is gaining momentum in WUSDT. The aggressive price target zones indicate strong confidence among market participants. The coin’s technical setup aligns well with the crypto market’s current appetite for breakout plays, particularly those emerging from falling wedges and descending channels.
Given these factors, WUSDT presents an exciting opportunity for traders who are looking to capture sharp upward moves. With strong chart structure, breakout confirmation, and positive investor sentiment, the probability of a sustained bullish trend is high. A close watch on price continuation and support holding will be key as this move unfolds.
✅ Show your support by hitting the like button and
✅ Leaving a comment below! (What is You opinion about this Coin)
Your feedback and engagement keep me inspired to share more insightful market analysis with you!
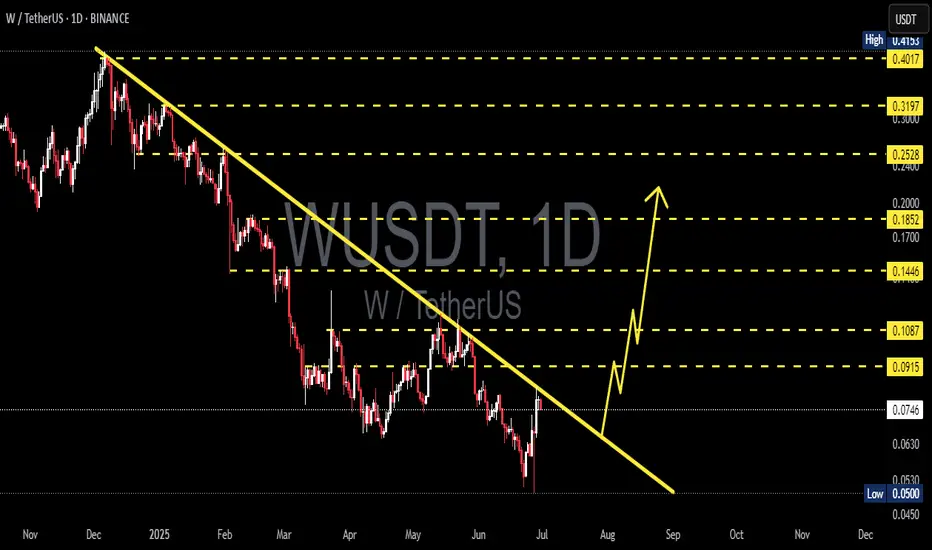
W/USDT Breaks Downtrend! Is This the Start of a Bullish Reversal🔍 Pattern and Chart Structure:
Timeframe: 1D (Daily)
Pattern: Breakout from a Descending Trendline that has been intact since late 2024.
Support and Resistance Levels:
Closest support: $0.0744
Key resistances: $0.0915 – $0.1087 – $0.1446 – $0.1852 – $0.2528 – $0.3197 – $0.4017
Volume & Momentum: The chart shows a price breakout above the descending trendline, likely accompanied by increased buying volume (volume confirmation is important).
🚀 Bullish Scenario:
If the price holds above the broken trendline:
A confirmed breakout occurs if the daily candle closes above $0.0744 and pushes toward $0.0915 and beyond.
Gradual target levels:
1. $0.0915 → $0.1087
2. $0.1087 → $0.1446
3. $0.1446 → $0.1852 (strong psychological resistance)
4. With strong bullish momentum, potential rally towards $0.25 – $0.40 range
📌 Note: If the price forms a higher low after the breakout, it further confirms a trend reversal.
🔻 Bearish Scenario:
If this breakout turns out to be a false breakout:
Price fails to hold above $0.0744
Drops back down to the support range around $0.0630 → $0.0500
If the price breaks below $0.0500, a further decline toward historical support at $0.0450 is possible
📌 A bearish confirmation would come from a daily candle closing back below the trendline with increased selling volume.
🧩 Conclusion:
Currently, W/USDT shows signs of a possible reversal after breaking the major long-term downtrend.
Breakout validation requires volume confirmation and strong follow-through.
The potential upside is attractive, but caution is advised in case of a false breakout.
#WUSDT #CryptoBreakout #AltcoinAnalysis #BullishReversal #TechnicalAnalysis #CryptoTrading #DescendingTrendline #BreakoutAlert #AltcoinSeason #SupportResistance
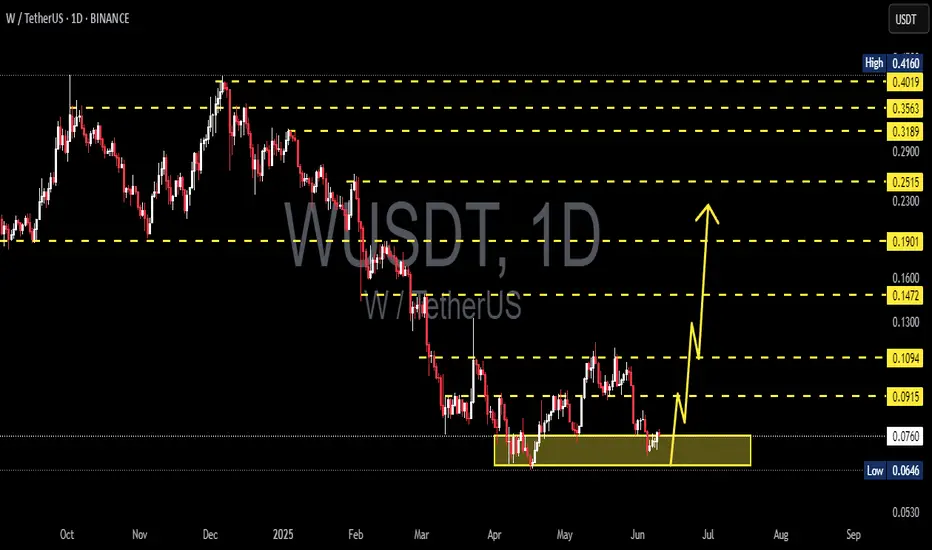
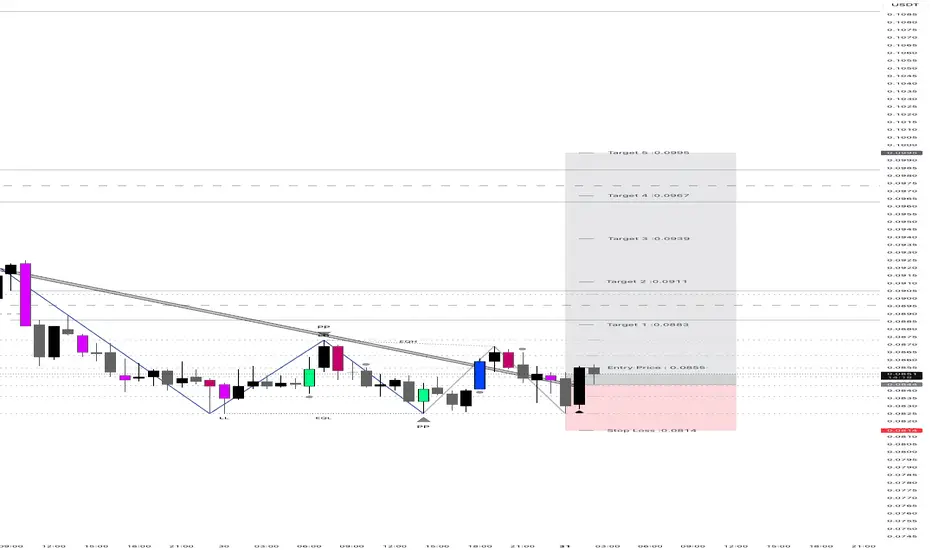
W/USDTKey Level Zone: 0.06700 - 0.07000
LMT v2.0 detected.
The setup looks promising—price previously trended upward with rising volume and momentum, then retested this zone cleanly. This presents an excellent reward-to-risk opportunity if momentum continues to align.
Introducing LMT (Levels & Momentum Trading)
- Over the past 3 years, I’ve refined my approach to focus more sharply on the single most important element in any trade: the KEY LEVEL.
- While HMT (High Momentum Trading) served me well—combining trend, momentum, volume, and structure across multiple timeframes—I realized that consistently identifying and respecting these critical price zones is what truly separates good trades from great ones.
- That insight led to the evolution of HMT into LMT – Levels & Momentum Trading.
Why the Change? (From HMT to LMT)
Switching from High Momentum Trading (HMT) to Levels & Momentum Trading (LMT) improves precision, risk control, and confidence by:
- Clearer Entries & Stops: Defined key levels make it easier to plan entries, stop-losses, and position sizing—no more guesswork.
- Better Signal Quality: Momentum is now always checked against a support or resistance zone—if it aligns, it's a stronger setup.
- Improved Reward-to-Risk: All trades are anchored to key levels, making it easier to calculate and manage risk effectively.
- Stronger Confidence: With clear invalidation points beyond key levels, it's easier to trust the plan and stay disciplined—even in tough markets.
Whenever I share a signal, it’s because:
- A high‐probability key level has been identified on a higher timeframe.
- Lower‐timeframe momentum, market structure and volume suggest continuation or reversal is imminent.
- The reward‐to‐risk (based on that key level) meets my criteria for a disciplined entry.
***Please note that conducting a comprehensive analysis on a single timeframe chart can be quite challenging and sometimes confusing. I appreciate your understanding of the effort involved.
Important Note: The Role of Key Levels
- Holding a key level zone: If price respects the key level zone, momentum often carries the trend in the expected direction. That’s when we look to enter, with stop-loss placed just beyond the zone with some buffer.
- Breaking a key level zone: A definitive break signals a potential stop‐out for trend traders. For reversal traders, it’s a cue to consider switching direction—price often retests broken zones as new support or resistance.
My Trading Rules (Unchanged)
Risk Management
- Maximum risk per trade: 2.5%
- Leverage: 5x
Exit Strategy / Profit Taking
- Sell at least 70% on the 3rd wave up (LTF Wave 5).
- Typically sell 50% during a high‐volume spike.
- Move stop‐loss to breakeven once the trade achieves a 1.5:1 R:R.
- Exit at breakeven if momentum fades or divergence appears.
The market is highly dynamic and constantly changing. LMT signals and target profit (TP) levels are based on the current price and movement, but market conditions can shift instantly, so it is crucial to remain adaptable and follow the market's movement.
If you find this signal/analysis meaningful, kindly like and share it.
Thank you for your support~
Sharing this with love!
From HMT to LMT: A Brief Version History
HM Signal :
Date: 17/08/2023
- Early concept identifying high momentum pullbacks within strong uptrends
- Triggered after a prior wave up with rising volume and momentum
- Focused on healthy retracements into support for optimal reward-to-risk setups
HMT v1.0:
Date: 18/10/2024
- Initial release of the High Momentum Trading framework
- Combined multi-timeframe trend, volume, and momentum analysis.
- Focused on identifying strong trending moves high momentum
HMT v2.0:
Date: 17/12/2024
- Major update to the Momentum indicator
- Reduced false signals from inaccurate momentum detection
- New screener with improved accuracy and fewer signals
HMT v3.0:
Date: 23/12/2024
- Added liquidity factor to enhance trend continuation
- Improved potential for momentum-based plays
- Increased winning probability by reducing entries during peaks
HMT v3.1:
Date: 31/12/2024
- Enhanced entry confirmation for improved reward-to-risk ratios
HMT v4.0:
Date: 05/01/2025
- Incorporated buying and selling pressure in lower timeframes to enhance the probability of trending moves while optimizing entry timing and scaling
HMT v4.1:
Date: 06/01/2025
- Enhanced take-profit (TP) target by incorporating market structure analysis
HMT v5 :
Date: 23/01/2025
- Refined wave analysis for trending conditions
- Incorporated lower timeframe (LTF) momentum to strengthen trend reliability
- Re-aligned and re-balanced entry conditions for improved accuracy
HMT v6 :
Date : 15/02/2025
- Integrated strong accumulation activity into in-depth wave analysis
HMT v7 :
Date : 20/03/2025
- Refined wave analysis along with accumulation and market sentiment
HMT v8 :
Date : 16/04/2025
- Fully restructured strategy logic
HMT v8.1 :
Date : 18/04/2025
- Refined Take Profit (TP) logic to be more conservative for improved win consistency
LMT v1.0 :
Date : 06/06/2025
- Rebranded to emphasize key levels + momentum as the core framework
LMT v2.0
Date: 11/06/2025

WUSDT 1D Analysis W ~ 1D Analysis
#W Buy back gradually from here if you still have confidence in this coin with a short term target of at least 15%+
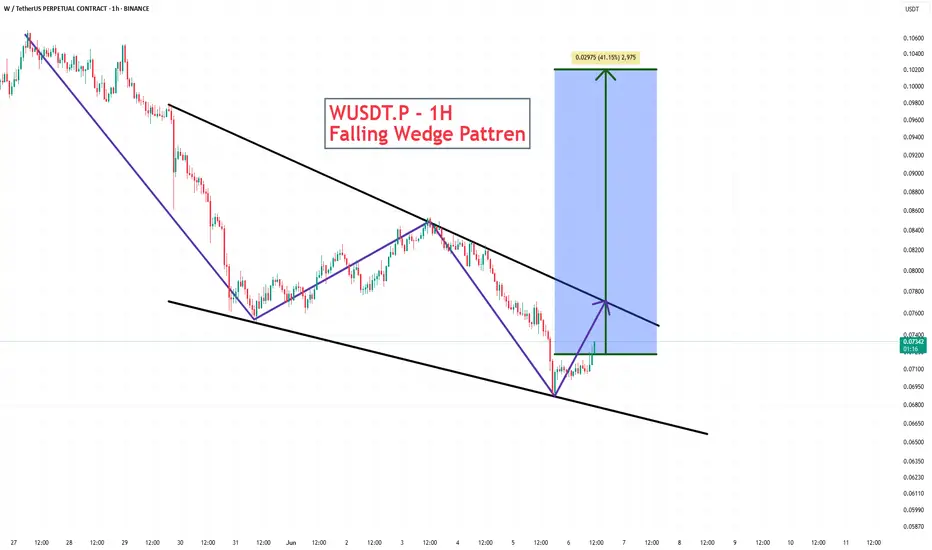
WUSDT.P - 1H Falling Wedge pattren🛫 COIN : WUSDT.P
🕯 CHART : 1H
📊 PATTREN : FALLING WEDGE
🔼 POSITION : BULLISH📈
💵1 Target - $ 0.07460
💵2 Target - $ 0.07675
💵3 Target - $ 0.07865
💵4 Target - $ 0.08140
💵5 Target - $ 0.08390
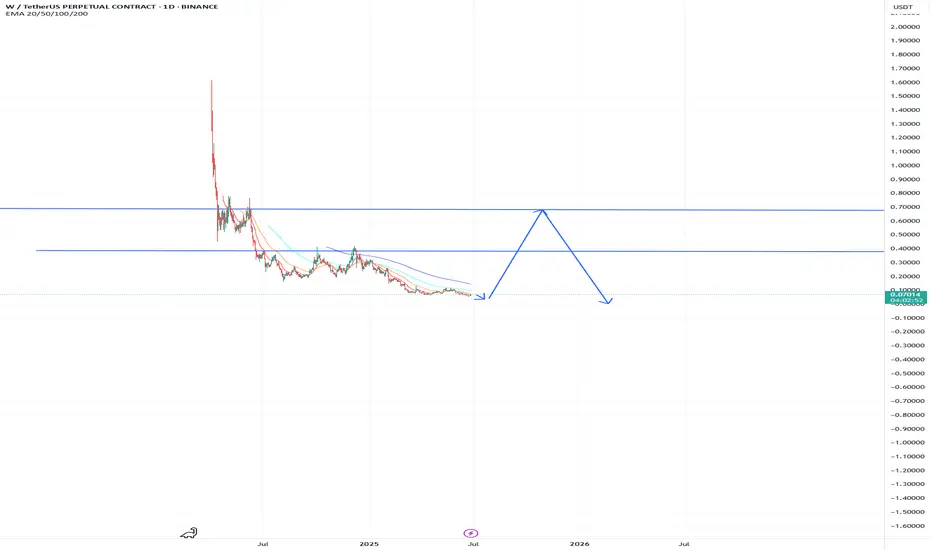
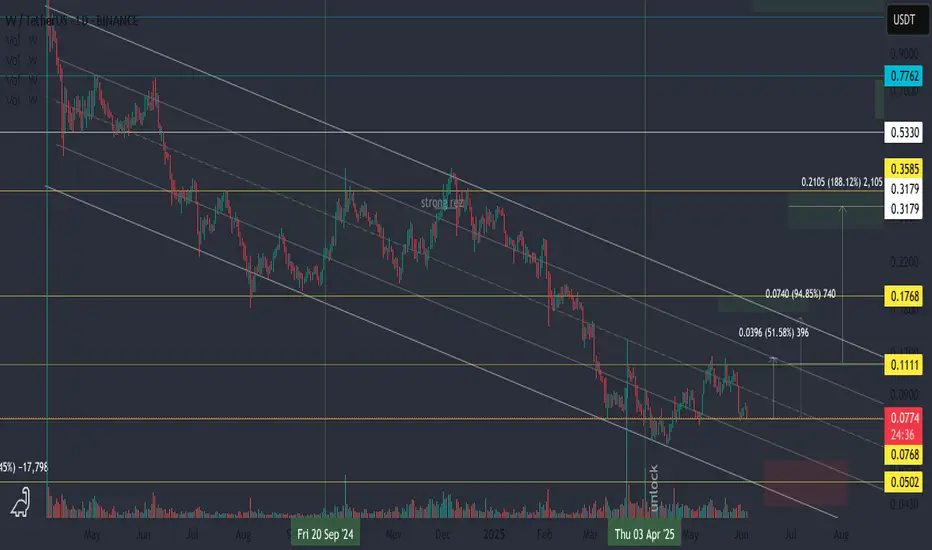
W/USDT continues to move within a well-defined descending chann🔻 The price has dropped around –96% from its all-time high.
That doesn’t guarantee a bottom — but further downside is no longer a given.
🚫 Opening shorts in this zone looks questionable,
especially considering the broader altcoin market structure.
📊 A more strategic approach would be to trade from the average price,
targeting a potential return to key resistance levels.
🎯 A bullish scenario points toward a move to the top of the channel,
with a potential +100% upside from current levels.
🪙 Worth noting: a major token unlock took place back in April —
those tokens are already in circulation, which reduces selling pressure.
📌 Still, a drop to the lower channel support can’t be ruled out —
this area should be considered in any risk-managed strategy.
WUSDT.P Make a FALLING WEDGE pattren in 3D chart🛫 COIN : WUSDT.P
🕯 CHART : 3D
📊 PATTREN : FALLING WEDGE
🔼 POSITION : BULLISH📈
💵1 Target - $ 0.4156
💵2 Target - $ 0.6233
💵3 Target - $ 0.9740
💵4 Target - $ 1.2150
💵5 Target - $ 2.3550

Buy Trade Strategy for WORM: Powering Cross-Chain InteroperabiliDescription:
This trading idea highlights WORM, the native token of the Wormhole protocol, a leading interoperability platform that enables seamless communication and asset transfers across multiple blockchain networks. As demand grows for scalable and interconnected ecosystems, WORM stands out by facilitating cross-chain functionality between major blockchains like Ethereum, Solana, BNB Chain, and others. This positions Wormhole as a foundational infrastructure in the multichain future of decentralized applications (dApps), DeFi, and NFTs. With backing from prominent investors and a rapidly expanding developer community, WORM offers long-term value based on its real-world utility and adoption momentum.
Still, it’s important to acknowledge that the crypto market is subject to extreme volatility, and factors such as regulatory updates, technological shifts, or security challenges can impact token performance. Investors should approach this opportunity with clear risk management and a long-term perspective.
Disclaimer:
This trading idea is for educational purposes only and should not be considered financial advice. Trading and investing in cryptocurrencies like WORM involves substantial risk, including the possibility of losing your entire investment. Always do your own research, evaluate your financial condition, and consult with a qualified financial advisor before making investment decisions. Past performance is not a guarantee of future outcomes.
WUSDT 1D AnalysisW ~ 1D✅ Analysis
#W Buy after successfully breaking through this resistance line with a short-term target of at least 10%+
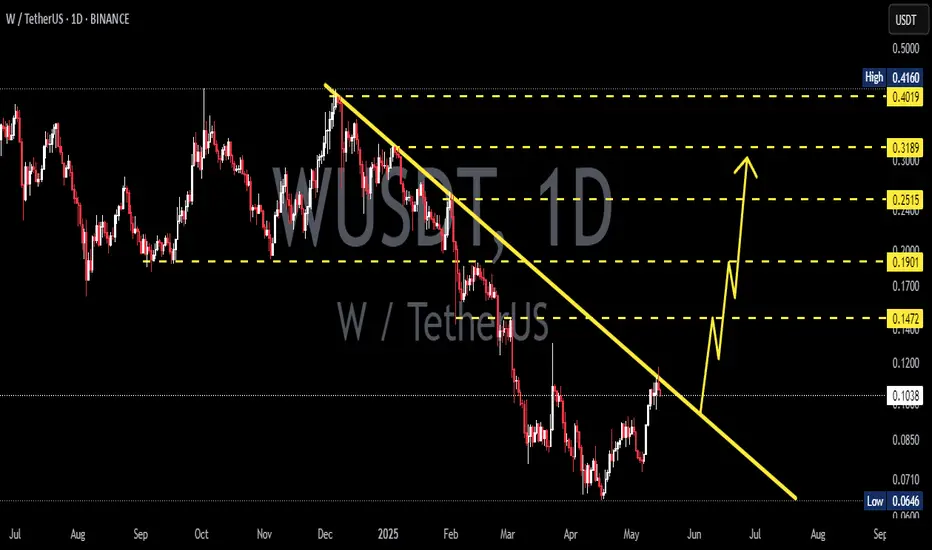
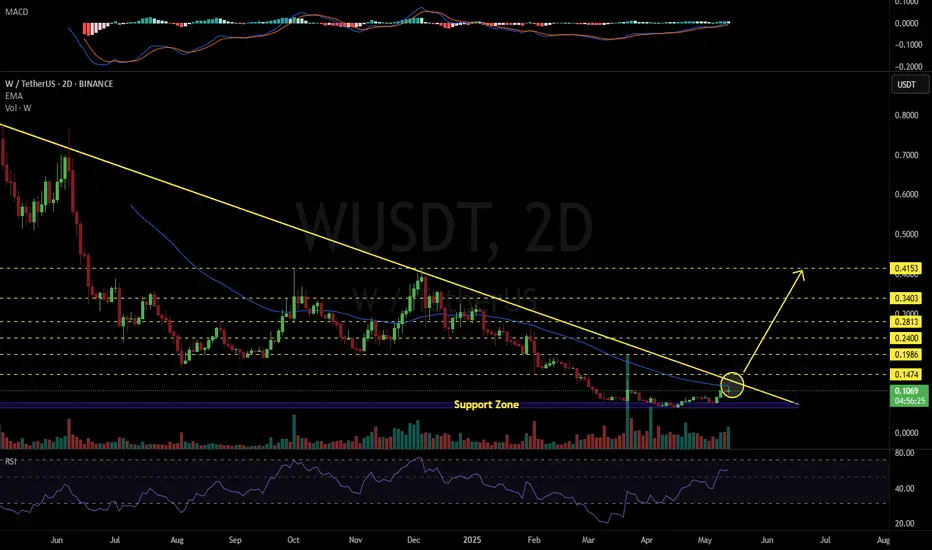
WUSDT 2D#W is approaching the descending resistance on the 2-day timeframe. A breakout above this trendline and the EMA50 could signal the start of a strong bullish wave. Watch for confirmation before entering.
Targets after breakout:
🎯 $0.1474
🎯 $0.1986
🎯 $0.2400
🎯 $0.2813
🎯 $0.3403
🎯 $0.4153
⚠️ Use a tight stop-loss.
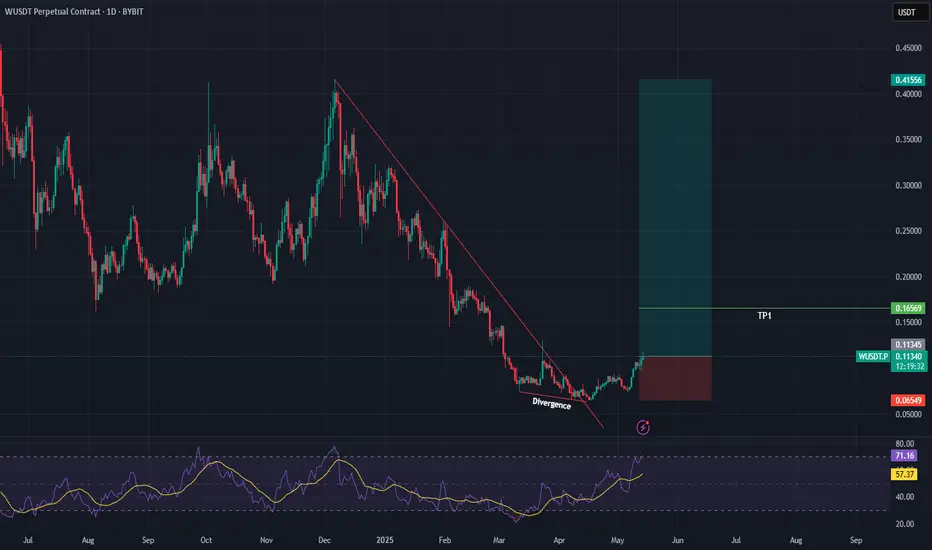
WUSDT – Daily Bullish Divergence WUSDT – Daily Bullish Divergence | Early Reversal Signals In Play 🔄📈
What’s up traders 👋
WUSDT is starting to show some life after a consistent downtrend — and the first real sign of a shift is now visible:
✅ Bullish divergence on the daily chart
This isn’t some noise on a 15-minute scalp — this is daily timeframe divergence, and that’s often the first clue that momentum is quietly turning.
🔍 Bullish Divergence Breakdown
Price: Making lower lows, continuing the downtrend
RSI (or MACD): Making higher lows, indicating loss of bearish momentum
This is the textbook setup where sellers are still pushing price down — but buyers are starting to step in beneath the surface. That’s usually followed by:
A range
A breakout
And often, a sharp bounce
⚡ What to Watch Next
Support zone: Is price bouncing off a previous base?
Volume: Any spike or subtle increase?
Candle strength: Bullish engulfing or long-wick rejections?
If any of those line up with the divergence — we’ve got a high-probability bounce/reversal scenario in motion.
🎯 Trade Strategy Idea
Aggressive Entry: Off the divergence zone + candle confirmation
Conservative Entry: Wait for a break above recent swing high
Stop Loss: Just below the recent low
Targets: Previous resistance levels or fib retracement zones (38.2% / 61.8%)
📌 WUSDT Showing Daily Bullish Divergence – Is Momentum About to Flip?
Time to position early or wait for confirmation? Drop your thoughts & setups 👇
#WUSDT #BullishDivergence #DailyChart #CryptoTrading #Altcoins #ReversalSetup #SmartMoney #TechnicalAnalysis #MomentumShift
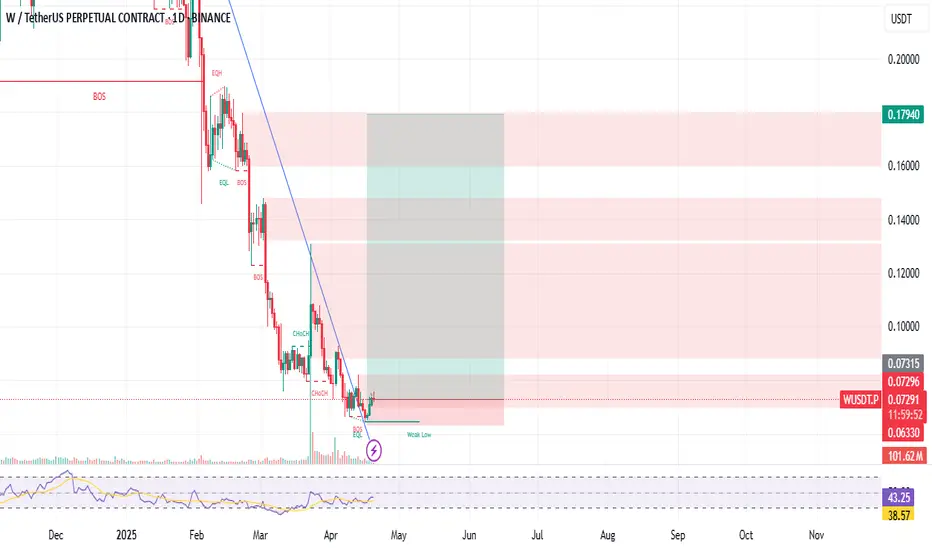
W to longW have broken out of its long term trend. one can open long position.
Entry: 0.07315
Tp1 : 0.13
Tp 2: 0.18
Stoploss: 0.06330
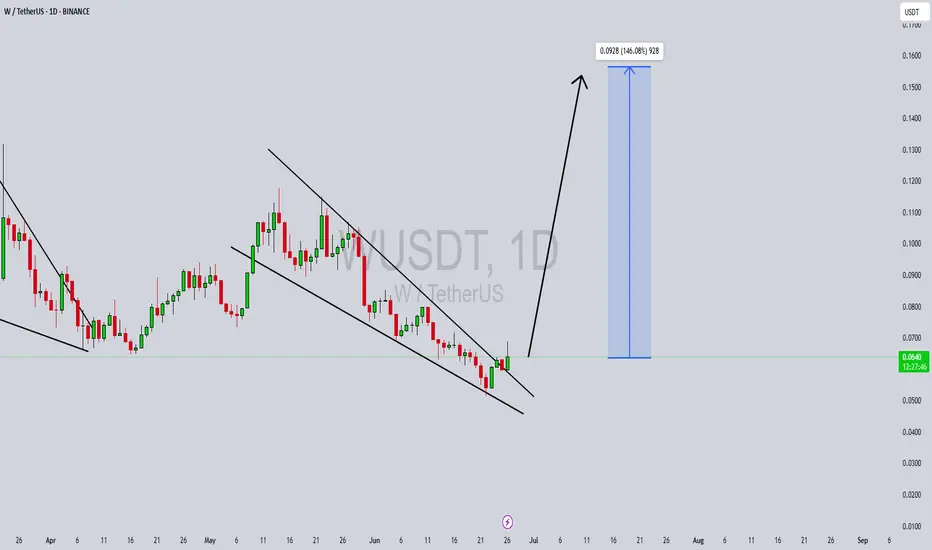
Bullish Setup Spotted on WUSDT Key Demand Zone in PlaySpotted potential falling wedge formation, a classic bullish reversal setup that has now completed its five-wave structure with a breakout from the lower trendline.
Focus remains on the Immediate Demand Zone as a critical area for re-accumulation. The projected path suggests steady bullish progression with price targeting 0.1278, then 0.2572, and ultimately 0.3887.
Main Supply Zone around the final target is the key level to watch for any major trend reversal or breakout continuation.

Looks positive for a move up.BINANCE:WUSDT
I think the current price is reasonable for an entry.
I’ve set my own targets — planning to sell about 30% at each one, and I’ll keep 10% just in case.
Not encouraging anyone to buy.
Always do your own technical analysis.
I personally only trade new coins that haven’t had a full pump yet.
After listing, I wait for a 65–95% pullback and then start averaging in with 3–4 spot buys.
I use Fibonacci and other tools to set my targets.
It’s a good sign if there’s a breakout of the downtrend and a structure shift.
I’m not looking for advice — my own experience is enough.

Strong Breakout on WUSDT: Potential for Major Bullish Move WUSDT has recently completed a strong breakout from a key resistance zone, signaling a potential shift in momentum and attracting significant attention from traders. The technical setup points to a confirmed breakout with increased trading volume, which typically precedes a powerful rally. This move is further supported by market participants showing renewed interest in the project fundamentals, positioning WUSDT for a potential bullish continuation.
With solid volume pouring in post-breakout, WUSDT looks ready to make a major move to the upside. Current market structure indicates a healthy retest of the breakout level, setting the stage for a possible rally of 250% to 300% in the coming sessions. Such gains are within reach, especially if broader market sentiment remains positive and volume continues to climb.
Investor confidence in WUSDT is growing, as many see it as an undervalued gem ready to reclaim higher levels. Its technical strength, combined with strong buying activity, presents an attractive opportunity for both swing traders and long-term holders. Watch for key psychological resistance levels to act as future targets while support holds firm below.
✅ Show your support by hitting the like button and
✅ Leaving a comment below! (What is You opinion about this Coin)
Your feedback and engagement keep me inspired to share more insightful market analysis with you!
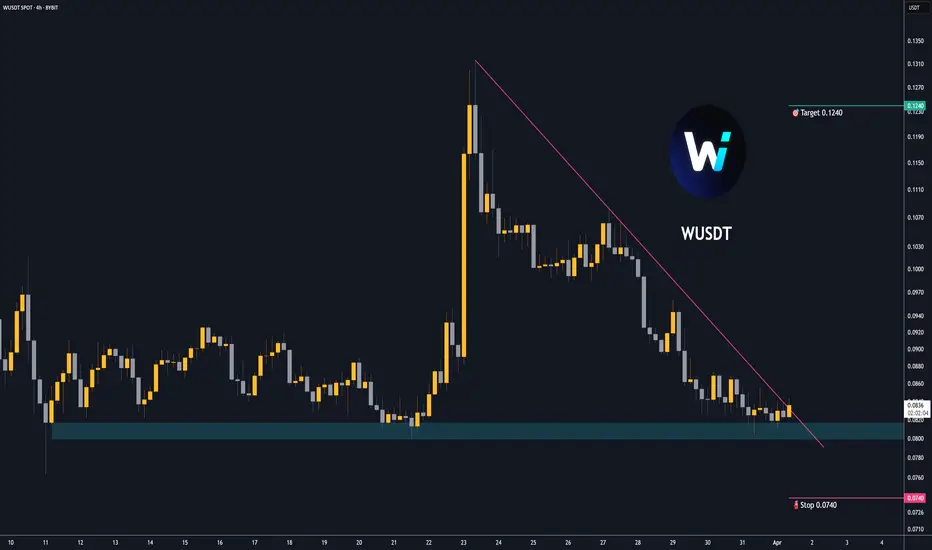
Trading opportunity for WUSDTBased on technical factors there is a Buy position in :
📊 WUSDT
🔵 Buy Now or Buy Stop by 0.89
🪫Stop loss 0.0740
🔋Target 0.1240
📏 R/R 4,2
💸RISK : 1%
We hope it is profitable for you ❤️
Please support our activity with your likes👍 and comments📝
#WUSDT LONG #WUSDT
Looking good for a quick reversal from here.
Reason:
1. Holding that support area very well. Did couple successful retests of same zone.
2.Retested bullish Trend line breakout.
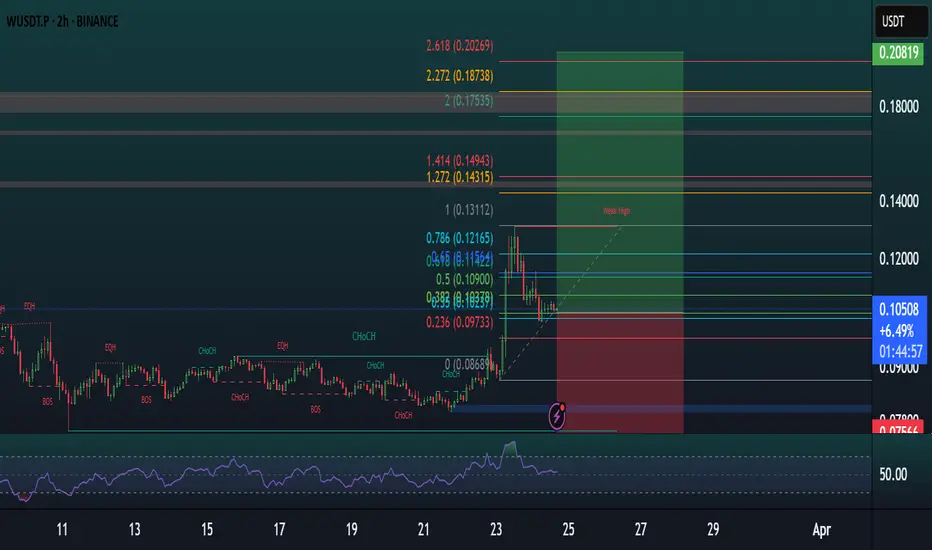
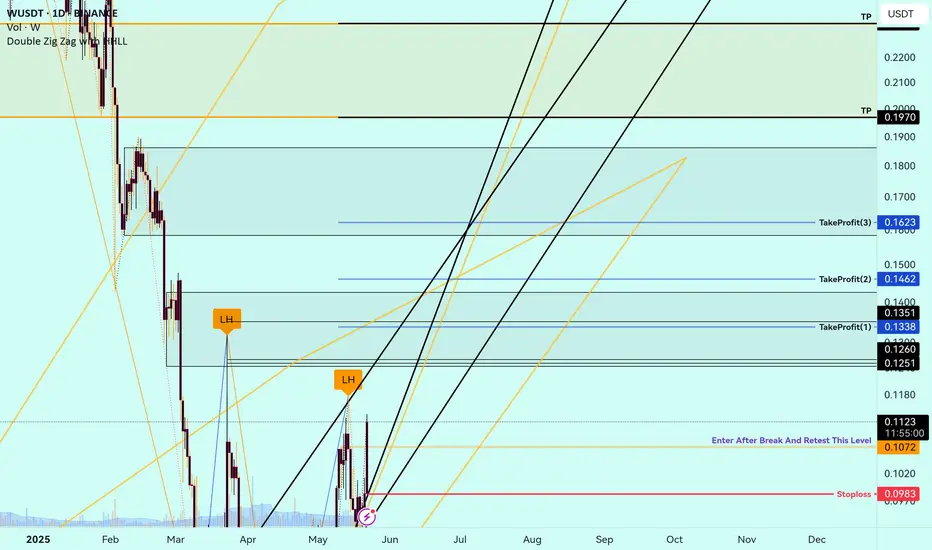
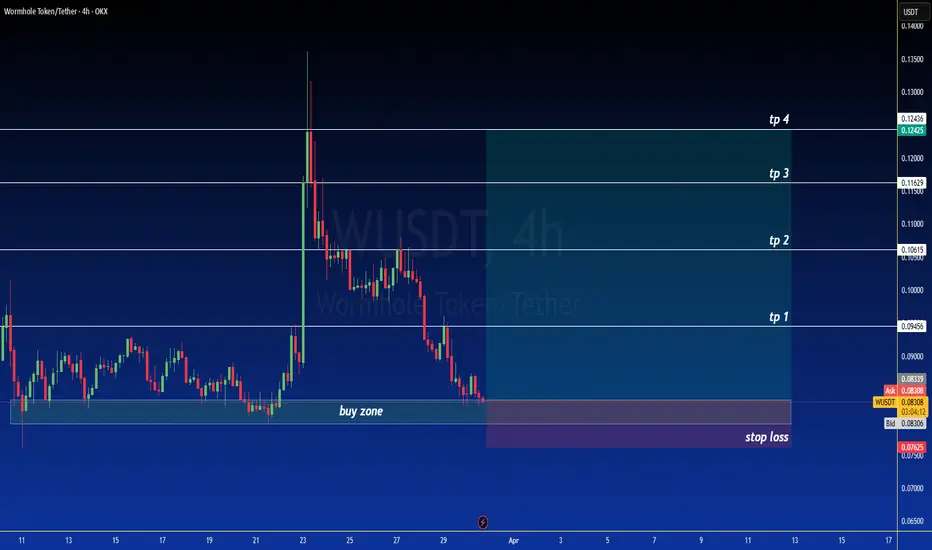
WUSD/T (Wormhole Token/Tether) - 4H Timeframe: Long itKey Observations:
Price at a Critical Support Zone:
The current price is at 0.08320, sitting squarely within a well-defined "Buy Zone" between 0.08320 and 0.09263 (blue shaded area). This zone has acted as a strong support in the past, as evidenced by the price bouncing off this level multiple times in mid-March.
The price has just touched the lower boundary of this buy zone, which historically has been a springboard for upward moves, making it an ideal entry point for a long position.
Potential Reversal Setup:
After a significant downtrend from late March (where the price dropped from 0.1400 to 0.08320), the price has consolidated in this buy zone, showing signs of stabilization.
The sharp decline appears to have exhausted selling pressure, and the lack of further breakdown below 0.08320 suggests buyers are stepping in to defend this level.
The chart shows a potential double-bottom pattern forming around 0.08320, a bullish reversal pattern that often signals the end of a downtrend.
Take-Profit Levels (TP) and Risk-Reward:
The chart marks several take-profit levels for a long trade:
TP1: 0.09546 (just above the buy zone, a 14.8% gain from 0.08320)
TP2: 0.1000 (20.2% gain)
TP3: 0.11629 (39.8% gain)
TP4: 0.12438 (49.5% gain)
The stop-loss level is marked at 0.07265 (purple shaded area), which is 12.7% below the current price. This provides an excellent risk-to-reward ratio, especially if targeting TP2 or higher (e.g., 20.2% gain vs. 12.7% risk for TP2, a 1.6:1 R:R).
Volume and Momentum:
While volume isn’t directly shown, the sharp drop in late March likely came with high selling volume, which has since tapered off as the price consolidates in the buy zone. This suggests selling pressure is diminishing.
The consolidation phase in the buy zone, with smaller candlestick ranges, indicates reduced volatility and a potential buildup for a breakout to the upside.
Broader Market Context:
Wormhole Token (W) is a cross-chain protocol token, often influenced by DeFi and interoperability trends in the crypto space. As of March 30, 2025, if the broader crypto market is showing signs of recovery (e.g., Bitcoin or Ethereum trending upward), this could provide a tailwind for smaller altcoins like Wormhole to rally.
The price being at a multi-month low (0.08320) suggests it may be undervalued, attracting value buyers or swing traders looking for a bounce.
Long Trade Recommendation:
Entry: Enter a long position at the current price of 0.08320, as the price is testing a historically strong support level with signs of a potential reversal.
Stop Loss: Place a stop loss just below the marked stop-loss level at 0.07265 to protect against a breakdown. This keeps the risk at 12.7%.
Take Profit:
Conservative Target: Take partial profits at TP1 (0.09546) for a 14.8% gain.
Primary Target: Aim for TP2 (0.1000) for a 20.2% gain, which is a realistic target given the price’s historical resistance at this level.
Stretch Target: If momentum picks up, hold a portion of the position for TP3 (0.11629) or TP4 (0.12438) for gains of 39.8% or 49.5%, respectively.
Risk Management: Risk 1-2% of your account on this trade. For example, with a $10,000 account, risking 1% ($100) means your position size should be adjusted so that a 12.7% drop (from 0.08320 to 0.07265) equals $100. This would allow a position size of approximately $787 (since $787 * 0.127 = $100).
Trade Management: If the price breaks above 0.09263 (upper boundary of the buy zone), this confirms the bullish setup. Consider trailing your stop loss to lock in profits as the price hits each TP level.
Why Long?:
The price is at a strong support level (0.08320–0.09263), with historical evidence of bounces from this zone.
A potential double-bottom reversal pattern is forming, signaling the end of the downtrend.
The risk-to-reward ratio is highly favorable, with a 12.7% risk for a potential 20.2%–49.5% reward.
The consolidation in the buy zone suggests selling pressure is fading, and buyers may step in to push the price higher.
If the broader crypto market is bullish or Wormhole announces positive developments, this could act as a catalyst for a rally.
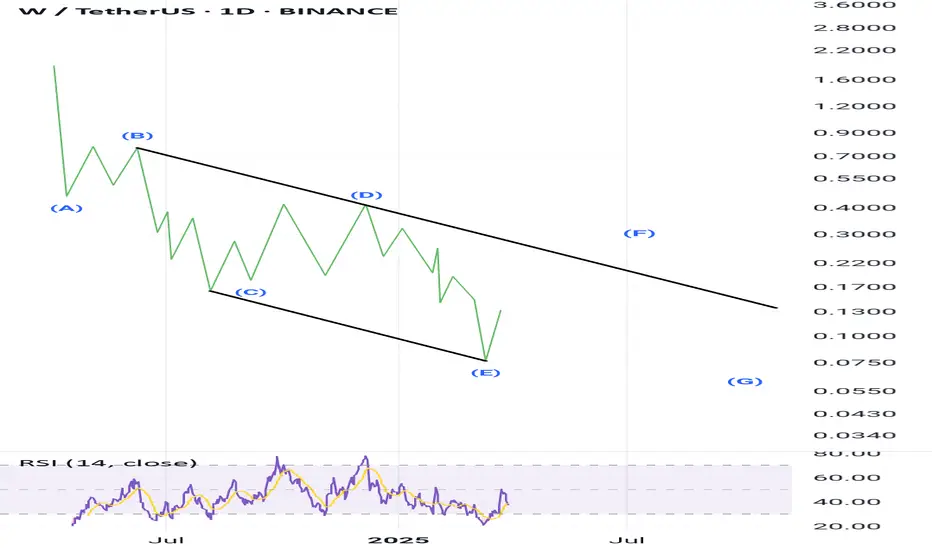
WusdtWusdt
Neowave
This analysis has been drawn using monthly cache data.
It will either form a Diametric or a Symmetric pattern.
In both cases, we can see that an upward move will occur, and a high trading volume over several days could be the trigger for this movement.
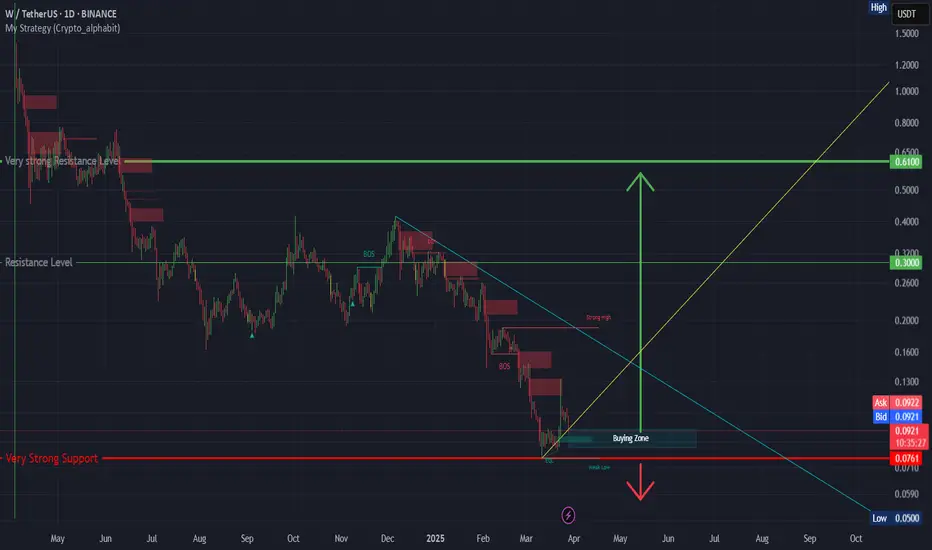
W ( SPOT -INVEST)BINANCE:WUSDT
WLD / USDT
(4H + 1D) time frames
analysis tools
____________
SMC
FVG
Trend lines
Fibonacci
Support & resistance
MACD Cross
EMA Cross
______________________________________________________________
Golden Advices.
********************
* Please calculate your losses before any entry.
* Do not enter any trade you find it not suitable for you.
* No FOMO - No Rush , it is a long journey.
Useful Tags.
****************
My total posts
tradingview.sweetlogin.com
w coin another pump loadingW coin has done CHoCH on major structure with a bullish and big candle. According fib levels, its in buy zone and will pump again. Buy some in spot.