XAGUSD trade ideas
SILVER: The Market Is Looking Down! Short!
My dear friends,
Today we will analyse SILVER together☺️
The market is at an inflection zone and price has now reached an area around 38.455where previous reversals or breakouts have occurred.And a price reaction that we are seeing on multiple timeframes here could signal the next move down so we can enter on confirmation, and target the next key level of 38.279.Stop-loss is recommended beyond the inflection zone.
❤️Sending you lots of Love and Hugs❤️
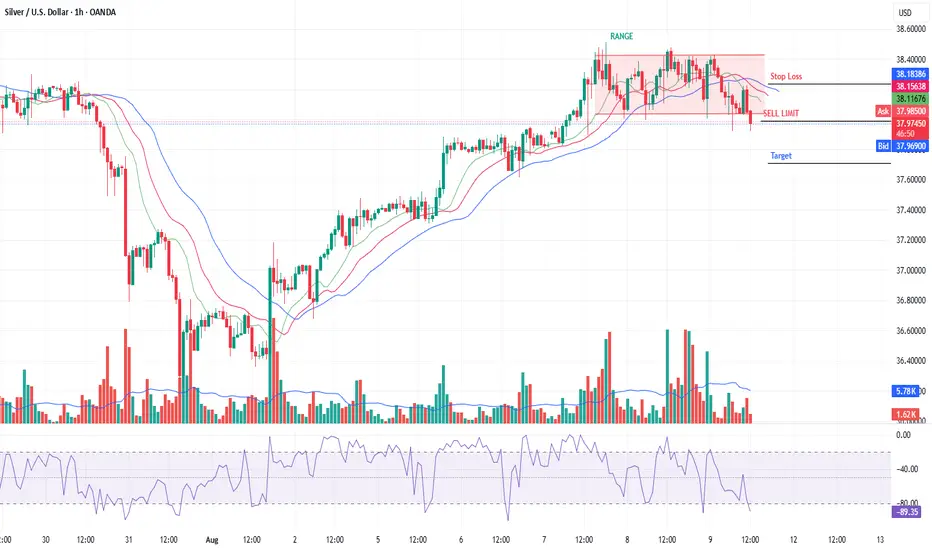
SILVER A Fall Expected! SELL!
My dear friends,
SILVER looks like it will make a good move, and here are the details:
The market is trading on 38.352 pivot level.
Bias - Bearish
Technical Indicators: Supper Trend generates a clear short signal while Pivot Point HL is currently determining the overall Bearish trend of the market.
Goal - 37.909
About Used Indicators:
Pivot points are a great way to identify areas of support and resistance, but they work best when combined with other kinds of technical analysis
Disclosure: I am part of Trade Nation's Influencer program and receive a monthly fee for using their TradingView charts in my analysis.
———————————
WISH YOU ALL LUCK
SILVER: Next Move Is Up! Long!
My dear friends,
Today we will analyse SILVER together☺️
The in-trend continuation seems likely as the current long-term trend appears to be strong, and price is holding above a key level of 38.079 So a bullish continuation seems plausible, targeting the next high. We should enter on confirmation, and place a stop-loss beyond the recent swing level.
❤️Sending you lots of Love and Hugs❤️

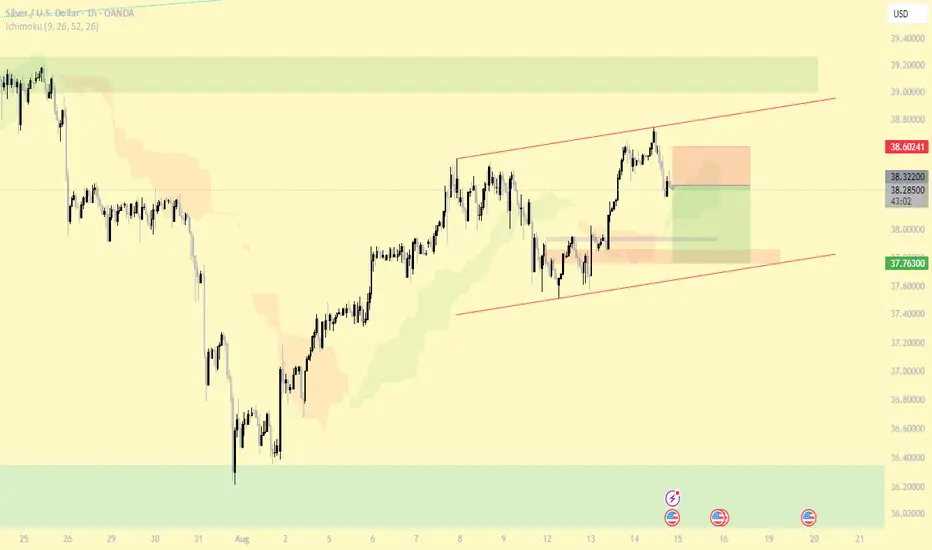
XAGUSDReasons for entering the trade:
1- MACD and RSI divergence (4H)
2- Break of the latest low/high (1H)
3- Price action (weak upward movement and strong downward movement) (1H)
4- Bermuda Kumo (15M)
Entry: 38.32200
TP: 37.76300
SL: 38.60241
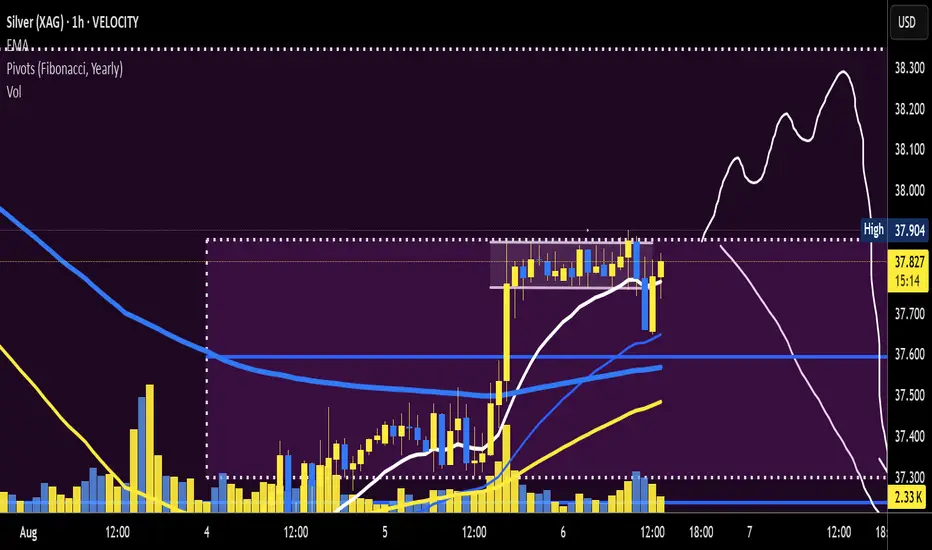
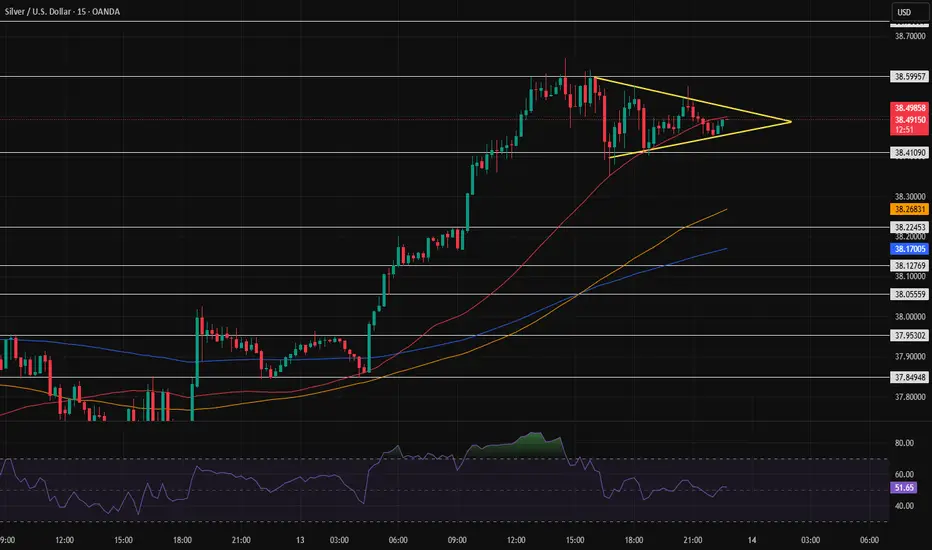
Silver candlestick squeezeWe can see that silver’s candlesticks have compressed like a spring, and at any moment, they might make a big move in either direction. Don’t get caught in FOMO — wait for solid triggers.
SILVER - ANALYSIS1. Current Structure – Elliott Wave Count
Wave A: A sharp decline from the recent high, establishing a strong corrective leg down.
Wave B: A retracement rally, but not breaking above the prior peak, indicating corrective behavior rather than a fresh uptrend.
Wave C (in progress): The chart is projecting a 5-wave decline inside Wave C.
Current breakdown of Wave C:
Wave ①: First leg down from the Wave B peak.
Wave ②: A small corrective bounce is expected before further downside.
Wave ③, ④, ⑤: Projected to take price lower, with the most aggressive drop likely during Wave ③.
2. AO Divergence
Negative Divergence: Price made a higher high into Wave B, but the MACD histogram made a lower high — a classic bearish divergence, signaling weakening buying momentum.
Weakness Confirmed: Histogram has crossed below the zero line, confirming bearish momentum and supporting the Elliott Wave bearish scenario.
3. Volume Profile
Selling volume during the drop from Wave B is noticeably higher than the buying volume in the prior rally — indicating stronger participation on the downside.
This supports the continuation of the bearish structure.
4. Price Projections
Based on the wave count:
Short-term: Likely a small bounce (Wave ②) towards ~$37.70–$37.90 area.
Medium-term: A sharp decline towards the $35.80–$36.00 zone in Wave ③.
Final target for Wave C: Potentially $35.20–$35.50 range before any major reversal attempt.
5. Trading Bias
Bias: Bearish
Aggressive entry: After a small corrective bounce (Wave ②) fails and momentum turns down again.
Stop-loss: Above Wave B (~$38.40).
Downside target zone: $35.20–$35.4.
6. Risk Factors
If price breaks above $38.40, the current Elliott Wave bearish count will be invalidated.
Geopolitical or macroeconomic news affecting silver demand could cause abrupt reversals.
Conclusion:
The chart shows a completed ABC correction with Wave C in progress, backed by negative divergence on the MACD histogram and confirmed momentum weakness. Expect a short-term bounce followed by a sharp decline, with a probable target in the $35.20–$35.50 range.
Disclaimer:
This analysis is for educational and informational purposes only and does not constitute financial advice, investment recommendation, or an offer to buy or sell any financial instrument. Trading in commodities, forex, stocks, or derivatives involves substantial risk and may not be suitable for all investors. Past performance is not indicative of future results. You should conduct your own research and consult with a qualified financial advisor before making any trading or investment decisions. You are solely responsible for your trading and investment outcomes.

XAGUSD Sell
Sell based on Cot and Technical analysis
Technical indaticator : Below Alligator + Alligator Hungery'
Breakout of consilidation
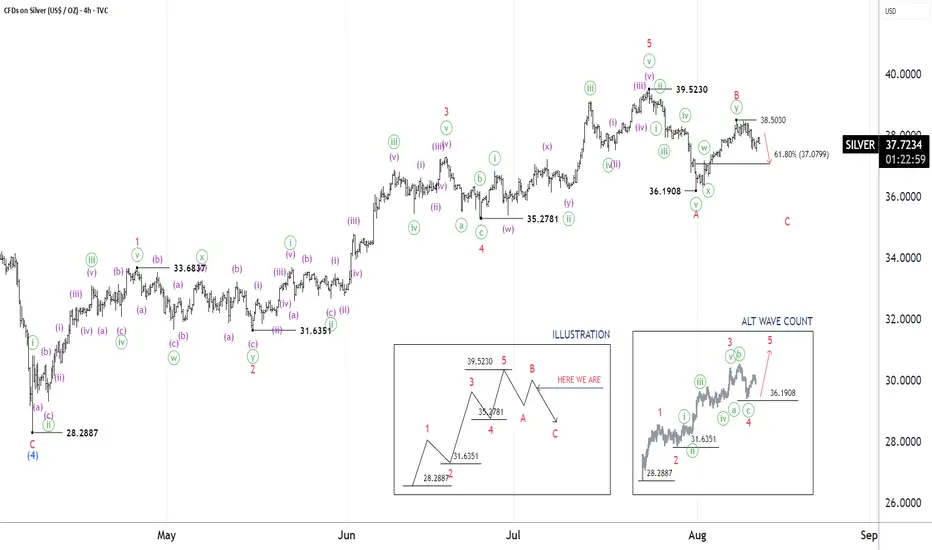
SILVER (XAG/USD): 12 AUG, 2025 | ELLIOTT WAVE ANALYSISConclusion: The C-red wave may be moving lower.
Bottom line: The C-red wave is pushing down to the nearest target at 37.07 or possibly lower, depending on the price action reaction at that level.
On the other hand, the ALT alternate wave count depicted on the chart is gaining weight. But in the short term, the ALT view is likely to also move to 37.07. Then, if it moves higher above 38.50, it will trigger the ALT scenario.
Invalidation Point: 39.52
©By Hua Chi Cuong (Shane), CEWA-M | Certified Elliott Wave Analysis - Master Level.
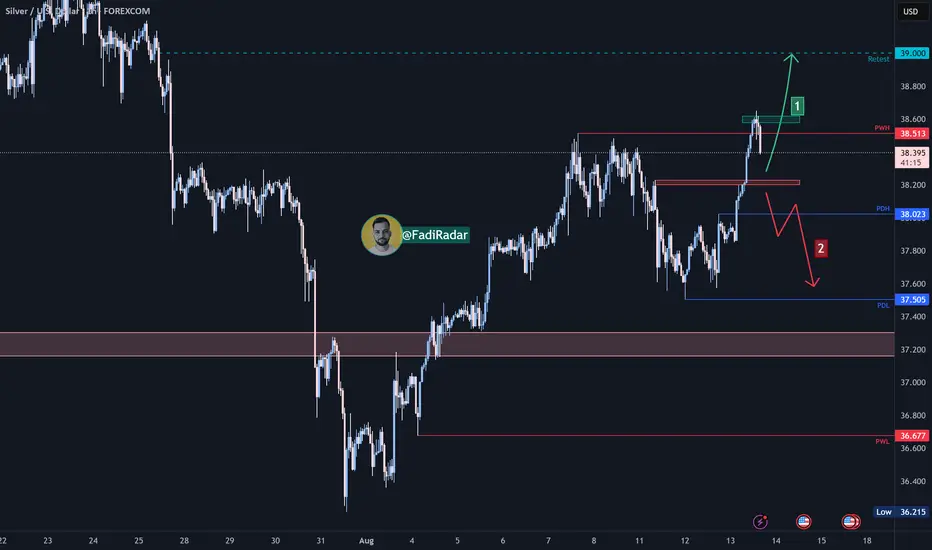
Silver Analysis (XAG/USD)Silver prices are moving in an upward trend, reaching $38.60. A corrective move towards the $38.20 support area is possible, with a potential rebound from there. However, if the price breaks below $38.20 and closes under it, this could support a decline towards $38.00 and then to test the $37.50 level.
If the price closes above $38.60, this would support further upside towards testing the $39.00 level.
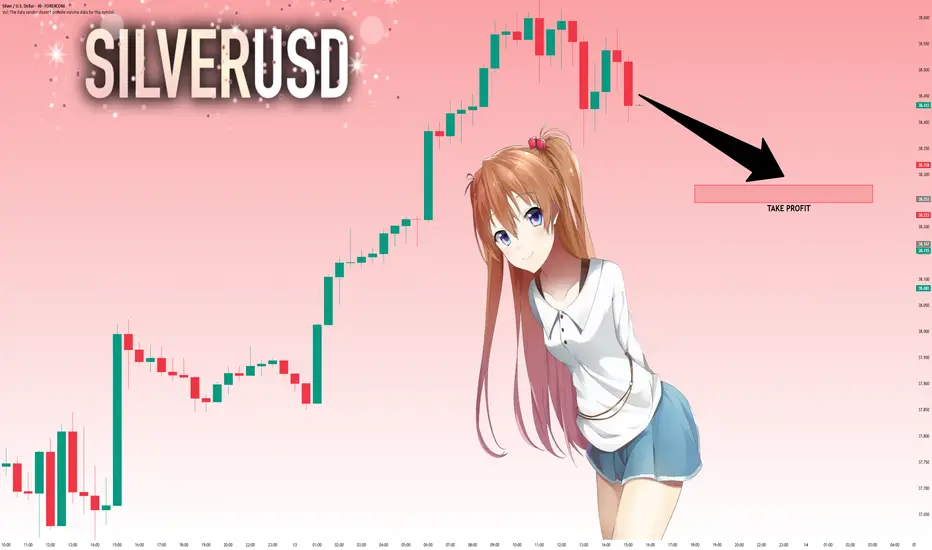
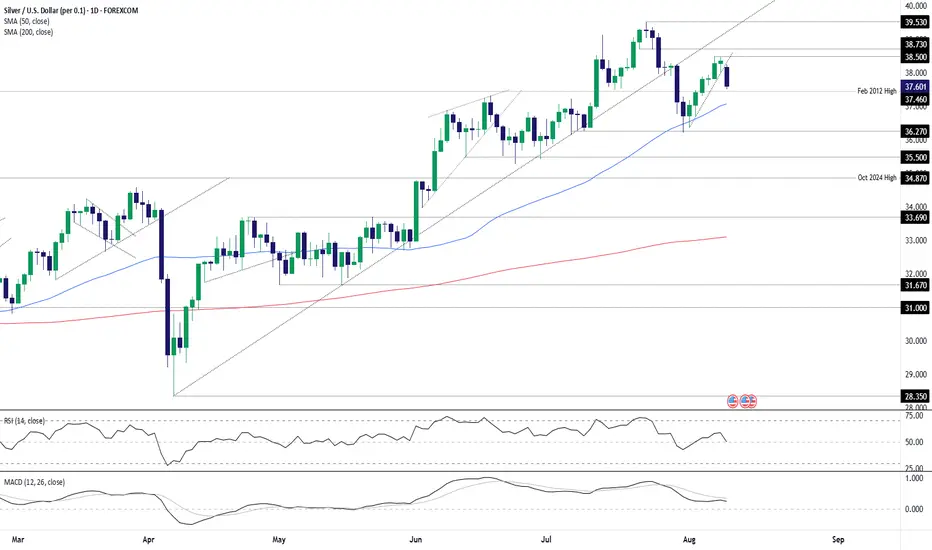
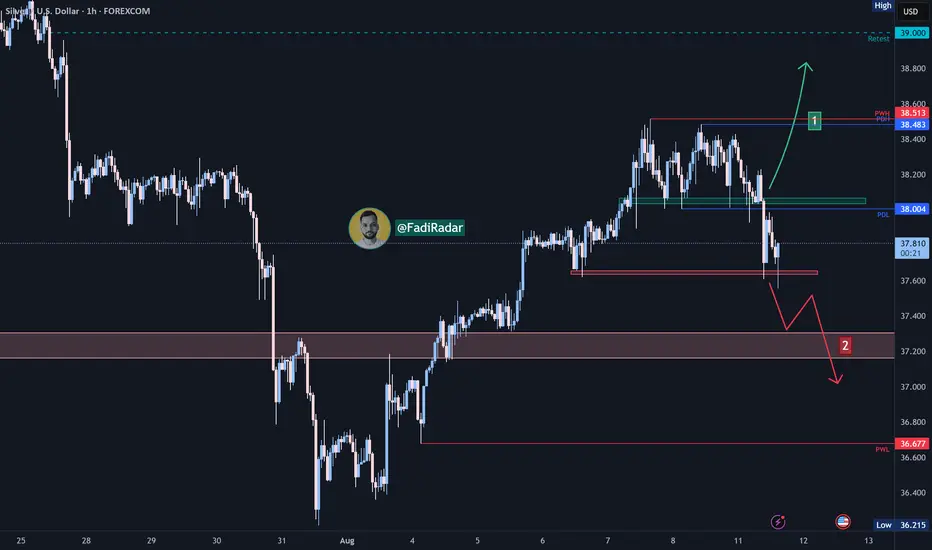
Silver’s uptrend cracks with U.S. inflation in focusSilver’s latest run ended abruptly on Monday, with the metal reversing hard, breaking its recent uptrend and forming a bearish evening star three-candle pattern. With RSI (14) and MACD momentum readings now neutral rather than bullish, the focus shifts to price action over holding a set bias.
If the signal from recent price action proves reliable—a big “if” with U.S. CPI looming—watch for a break beneath $37.46, the prior multi-decade high from February 2012. If that occurs, one option would be to establish shorts beneath the level with a stop above for protection, targeting either the 50-day moving average or support at $36.27 or $35.50.
If silver fails to follow through on Monday’s reversal, the setup could be flipped, with longs established above the level and a stop beneath for protection. $38.50 or $38.73 screen as potential targets, with a break above the latter opening the door for a retest of the July 23 swing high at $39.53.
From a fundamental standpoint, the U.S. inflation report looms as Tuesday’s main volatility event. A monthly core reading of 0.4% or higher would likely create headwinds for riskier assets such as silver, curtailing Fed rate-cut pricing over the next year and strengthening the U.S. dollar. A core print below 0.3% could have the opposite effect, acting as a catalyst for a possible silver surge.
Good luck!
DS
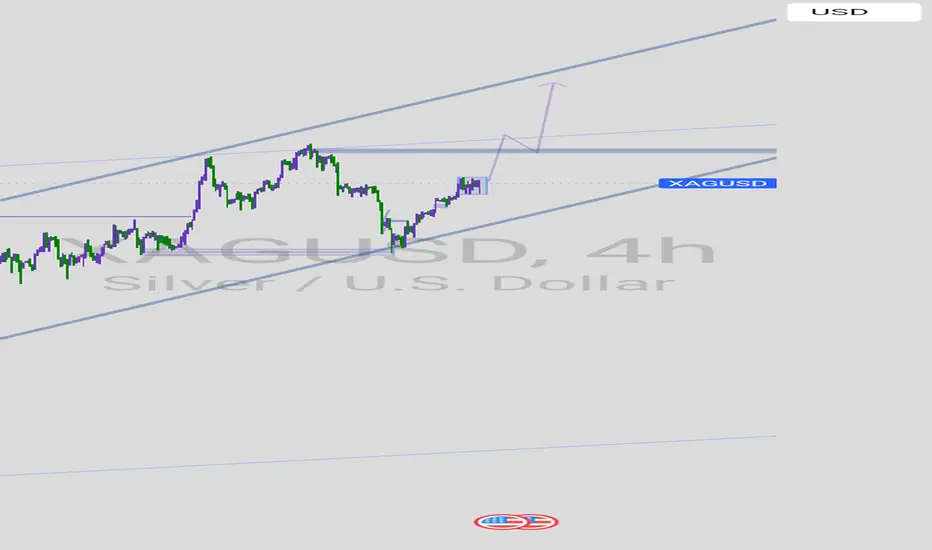
XAGUSD 4H**Analytical Trading Perspectives for the Upcoming Week**
In this series of analyses, we have reviewed short-term trading perspectives and market outlooks.
As can be seen, in each analysis there is a key support or resistance zone near the current price of the asset. The market’s reaction or breakout at these levels will determine the next price movement toward the specified targets.
**Important Note:** The purpose of these trading perspectives is to highlight the key levels ahead of price action and the market’s possible reactions to them. These analyses are by no means trading signals.
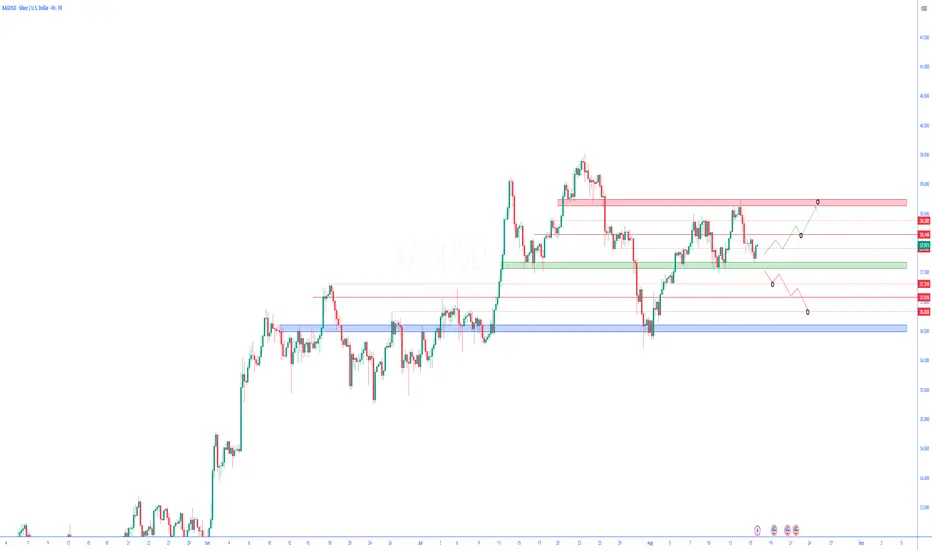
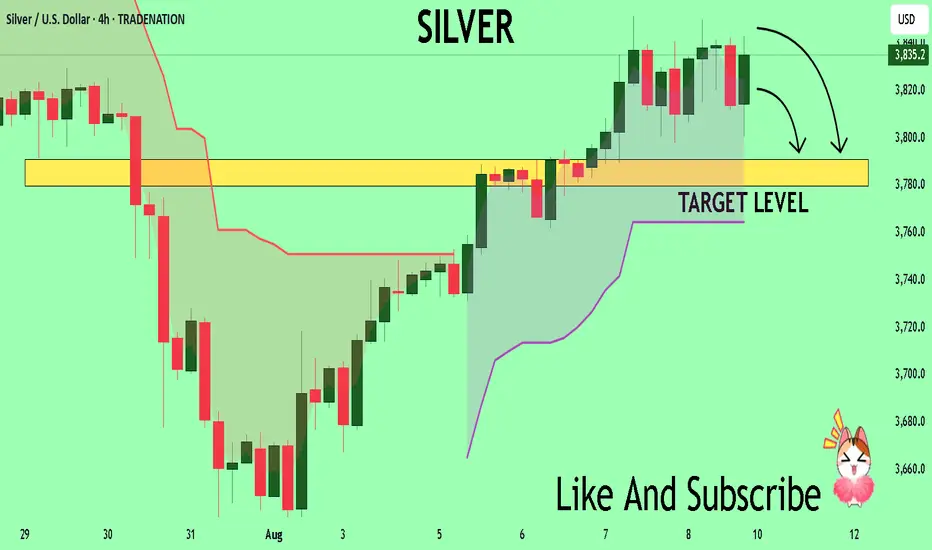
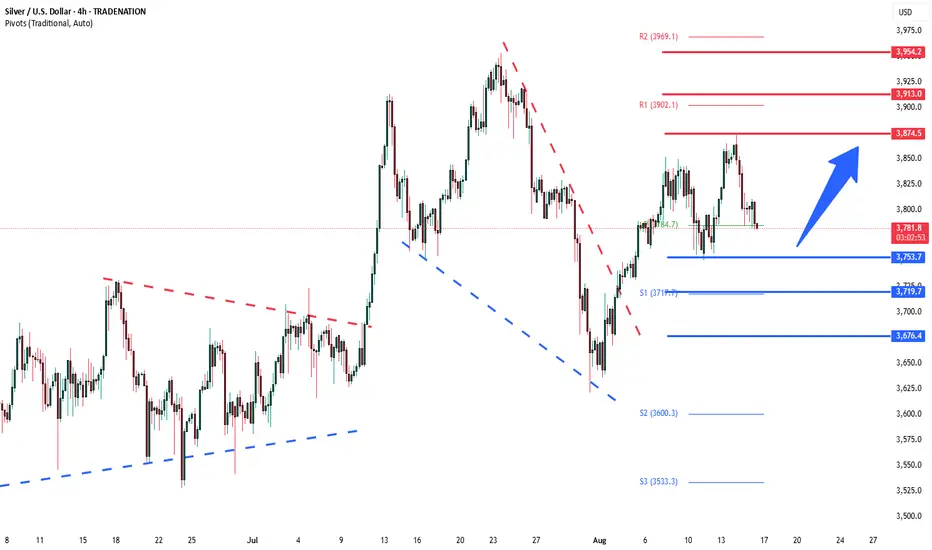
Silver sideways consolidation supported at 3753The Silver remains in a bullish trend, with recent price action showing signs of a continuation breakout within the broader uptrend.
Support Zone: 3753 – a key level from previous consolidation. Price is currently testing or approaching this level.
A bullish rebound from 3753 would confirm ongoing upside momentum, with potential targets at:
3875 – initial resistance
3913 – psychological and structural level
3954 – extended resistance on the longer-term chart
Bearish Scenario:
A confirmed break and daily close below 3753 would weaken the bullish outlook and suggest deeper downside risk toward:
3720 – minor support
3676 – stronger support and potential demand zone
Outlook:
Bullish bias remains intact while the silver holds above 3753. A sustained break below this level could shift momentum to the downside in the short term.
This communication is for informational purposes only and should not be viewed as any form of recommendation as to a particular course of action or as investment advice. It is not intended as an offer or solicitation for the purchase or sale of any financial instrument or as an official confirmation of any transaction. Opinions, estimates and assumptions expressed herein are made as of the date of this communication and are subject to change without notice. This communication has been prepared based upon information, including market prices, data and other information, believed to be reliable; however, Trade Nation does not warrant its completeness or accuracy. All market prices and market data contained in or attached to this communication are indicative and subject to change without notice.
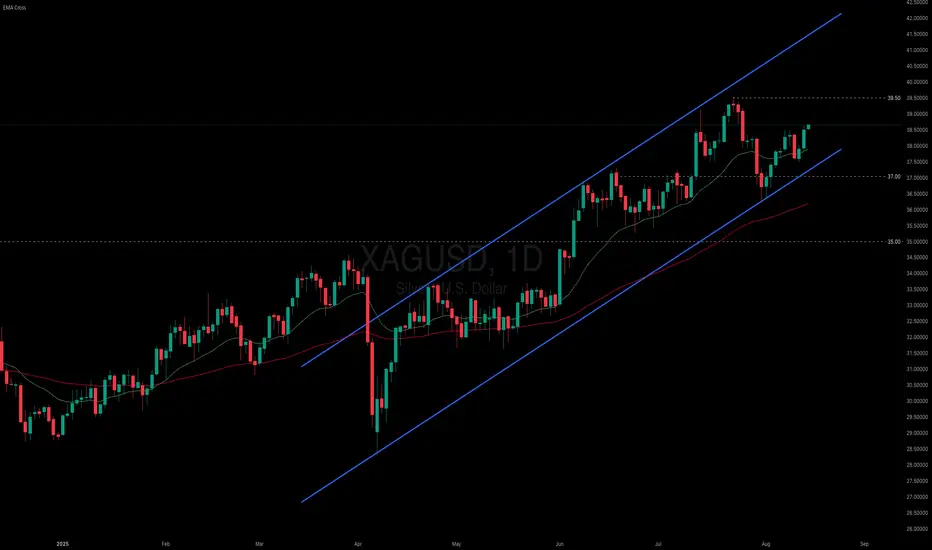
XAGUSD sustains its uptrend as the dollar weakened
Despite the risk-on mood, silver prices are holding their uptrend. Overall risk-appetite mood is widespread in the market as expectations for a September Fed rate cut surge. Reports that President Trump may appoint a dovish candidate as the next Fed chair have bolstered the risk-appetite sentiment, alongside Treasury Secretary Besant’s remarks that a 50bp cut at the September FOMC is highly likely. If today’s PPI comes in below market consensus, it could further strengthen the case for a Fed rate cut and add to the inflows to the risky assets.
XAGUSD continues to trend higher within its ascending channel, holding above EMA21 and signaling the potential extension of its bullish structure. If XAGUSD remains within the channel, the price may gain upside traction toward the 39.50 high. Conversely, if XAGUSD breaks below EMA21 and the channel’s lower bound, the price could retreat toward 37.00.
Silver (XAG/USD) Analysis:The price is currently retreating at the market open, correcting toward the support area near $37.65. If this level is broken and the price closes below it, it may support a further decline toward $37.30, followed by a test of the $37.00 area.
On the other hand, a close above $38.00 would support a rebound and a retest of $38.50.
⚠️ Disclaimer:
This analysis is not financial advice. Please monitor the markets carefully before making any investment decisions.

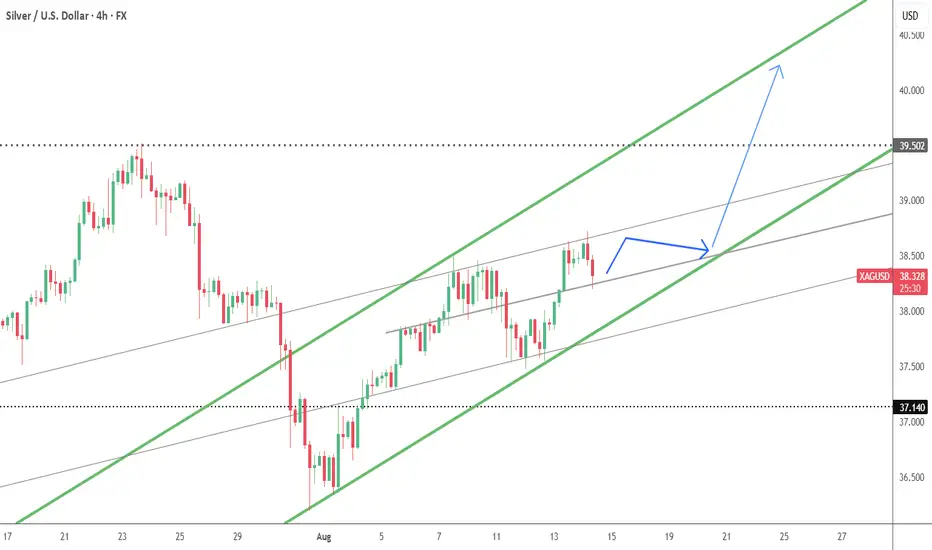
XAGUSD UPTRAND CHANNEL if you take a deep look at this chat you'll see a creal uptrand channel,
as you can see currentry price has rejected from channel's support.
by next week we are goin long, as long as price never make a shift in structure.
so now we should plan long trade whenever price make any retracemant.
if you agree with my bios just vote for long trade.
and follow for more.
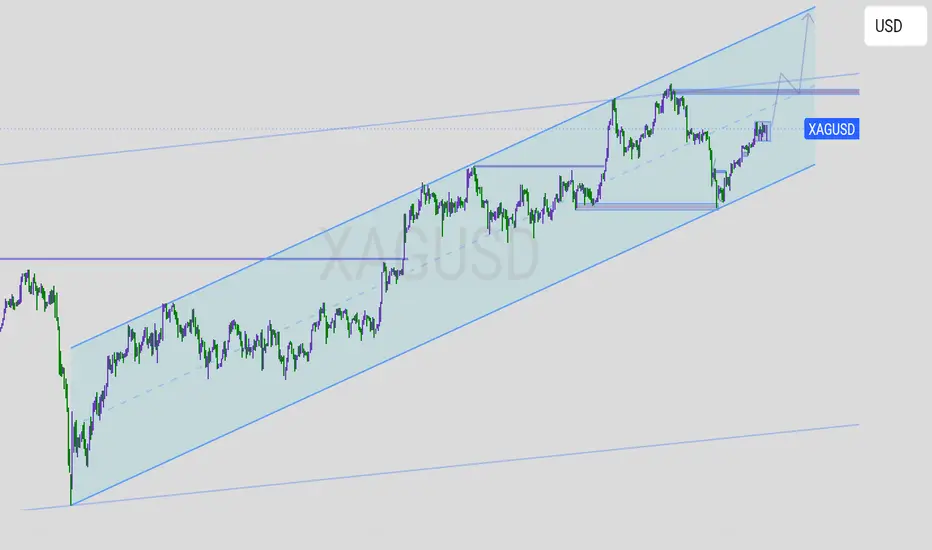
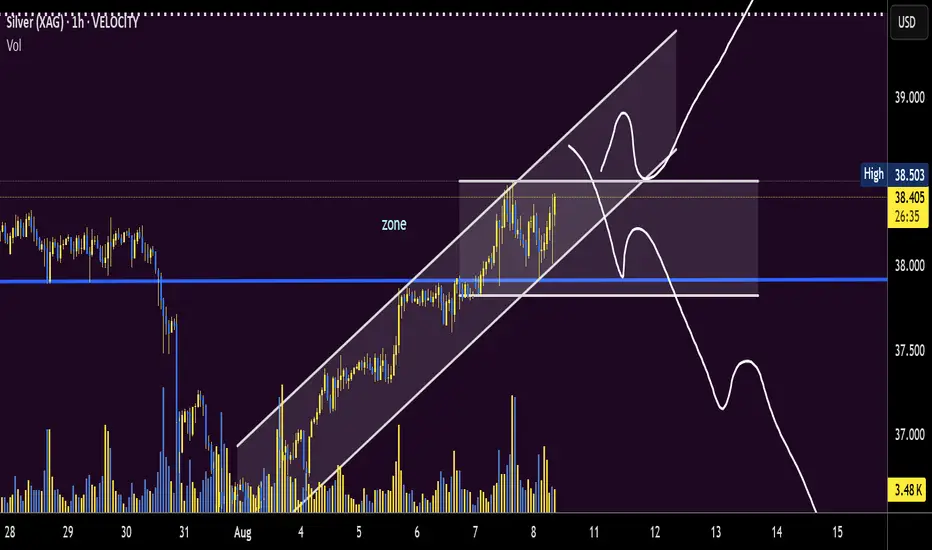
Silver (XAGUSD) on the **4-hour** chart is in a **clear rising Price has been making higher highs and higher lows and is currently in a small consolidation inside the channel. The annotated purple arrow forecasts a breakout continuation toward the channel’s upper boundary (next major resistance). Bullish bias while price stays inside the channel; a break below the lower channel or the horizontal support invalidates the bullish view.
---
# What the chart shows (observations)
1. **Timeframe:** 4-hour (swing/trend context).
2. **Trend structure:** Long-term uptrend — price moving inside a wide ascending channel drawn with two parallel trendlines (support = lower boundary, resistance = upper boundary).
3. **Horizontal levels:** Several purple horizontal zones mark prior support/resistance — notably a mid-channel support (around where price bounced recently) and a resistance area that price has used previously.
4. **Current price action:** A boxed consolidation (small range) near the mid-to-upper channel area — a classic continuation flag/pennant inside an uptrend.
5. **Projection:** The purple arrow drawn on the chart shows an expected breakout from the small consolidation, retest of the prior resistance (now support) and then a push up toward the upper channel resistance (the chart’s target area).
---
# Technical interpretation
* **Bullish overall:** Higher highs & higher lows inside an ascending channel — that’s bullish.
* **Continuation pattern:** The small boxed consolidation after a prior leg higher looks like a continuation pattern (flag/box). Break above the box → likely continuation to the upper channel.
* **Key supports:** The mid-channel horizontal zone and the rising lower trendline. These are the areas bulls want to hold.
* **Key resistance/target:** The upper channel boundary (and the horizontal resistance near the top) — this is the obvious profit target for longs.
---
# Possible trade ideas (examples, not financial advice)
1. **Aggressive long (momentum):**
* Entry: on clean breakout above the consolidation box with volume/candle confirmation.
* Stop: below the bottom of the box or below the nearby horizontal support.
* Target: first to the purple horizontal / mid-upper resistance, then to the channel top.
2. **Conservative long (pullback):**
* Wait for a breakout, then wait for a retest of the breakout level (or the rising mid-channel support). Enter on a bullish rejection/candle pattern.
* Stop: below retest low.
* Target: channel top.
3. **Invalidation / short idea:**
* If price breaks and closes **below the lower channel trendline** or the major horizontal support zone, that breaks the bullish structure. Consider shorting on confirmation toward the lower channel or a measured move down.
---
# Risk management & things to watch
* **Risk per trade:** size position so your stop loss equals a small % of equity (e.g., 1–2%).
* **Watch macro events:** USD strength, US CPI, Fed rate decisions, and real yields strongly affect silver — they can cause fast moves that blow through technical levels.
* **False breakouts:** Small timeframes can produce fake breakouts; prefer confirmation (close above resistance + follow-through candle).
* **Channel slope changes:** If price chops sideways and slope flattens, the trend may be losing momentum even before a break.
---
# Quick checklist before trading this setup
* Is breakout confirmed by a clean 4-hour close above the box or resistance? ✅
* Is volume / momentum supporting the move? ✅
* Is my stop placed below logical support (not just a random level)? ✅
* Do macro calendars (CPI/Fed/etc.) have events that could spike volatility? ✅
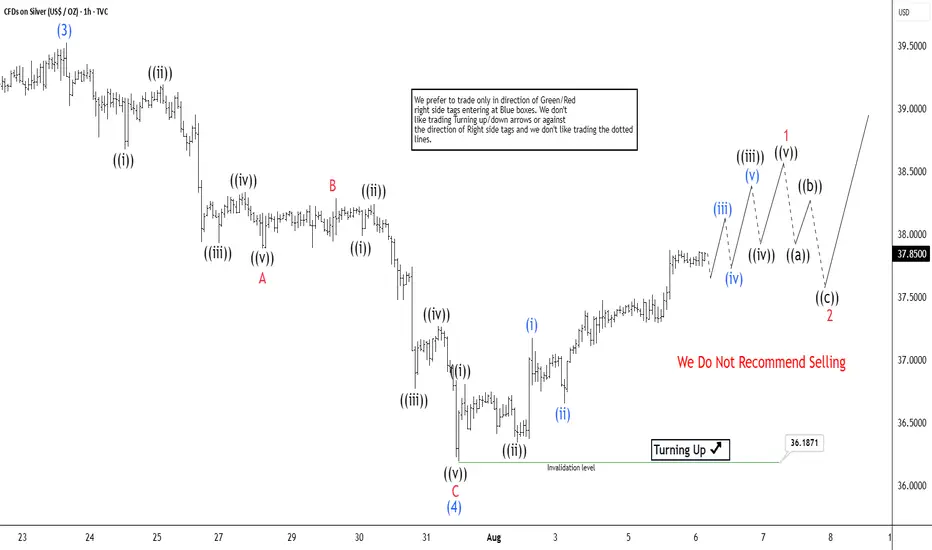
Elliott Wave Analysis: Silver (XAGUSD) Targets $40.3 in Wave 5 The ongoing cycle in Silver (XAGUSD), initiated from the April 7 low, continues to unfold as an impulsive Elliott Wave structure. Wave (3) of this impulse concluded at 39.52, as illustrated on the 1-hour chart. The subsequent pullback in wave (4) terminated at 36.17, exhibiting a zigzag internal structure. From the peak of wave (3), wave ((i)) declined to 38.67, followed by a rally in wave ((ii)) to 39.19. Wave ((iii)) then dropped to 37.93, with wave ((iv)) rebounding to 38.33. The final leg, wave ((v)), completed at 37.88, finalizing wave A in a higher degree. Wave B then rallied to 38.28.
Wave C descended in a five-wave impulse pattern. From wave B, wave ((i)) fell to 37.98, and wave ((ii)) climbed to 38.24. Wave ((iii)) dropped to 36.76, followed by wave ((iv)) rising to 37.268. The final wave ((v)) concluded at 36.17, completing wave C of (4). Silver has since begun advancing in wave (5). However, it must surpass the wave (3) high of 39.52 to eliminate the possibility of a double correction. As long as the 36.17 pivot holds, expect upward momentum. The potential target for wave (5) lies at the 123.6% inverse retracement of wave (4), projecting to 40.3. This analysis supports a bullish near-term outlook, provided the key support level remains intact.
Is silver roadmap at a crossroadssilver trend has been up for ages. perhaps pushing to attack the highs of "50.000" - the trend is your...
ZONE: offers 2 roadmaps:
1.going with the trend up favours bullish entry signals - ABC complete??
2. a unusaul significant entry signal suggesting abc correction within ABC not complete another nuance.
silver big picturedisclaimer: i got no idea what i am doing
but somehow silver got a 40 year cup and handle pattern in the chart, given the current sentiment and short squeeze potential in the markets, I think it is likely that silver will go back to the midline of the channel at around 100$.
After that I got less conviction what will happen next, it might depend a lot on inflation in fiat currencies and if commodities go into a decade long bull market.

Bearish reversal for the Silver?The price is rising towards the pivot and could reverse to the pullback support.
Pivot: 37.51
1st Support: 36.20
1st Resistance: 39.33
Risk Warning:
Trading Forex and CFDs carries a high level of risk to your capital and you should only trade with money you can afford to lose. Trading Forex and CFDs may not be suitable for all investors, so please ensure that you fully understand the risks involved and seek independent advice if necessary.
Disclaimer:
The above opinions given constitute general market commentary, and do not constitute the opinion or advice of IC Markets or any form of personal or investment advice.
Any opinions, news, research, analyses, prices, other information, or links to third-party sites contained on this website are provided on an "as-is" basis, are intended only to be informative, is not an advice nor a recommendation, nor research, or a record of our trading prices, or an offer of, or solicitation for a transaction in any financial instrument and thus should not be treated as such. The information provided does not involve any specific investment objectives, financial situation and needs of any specific person who may receive it. Please be aware, that past performance is not a reliable indicator of future performance and/or results. Past Performance or Forward-looking scenarios based upon the reasonable beliefs of the third-party provider are not a guarantee of future performance. Actual results may differ materially from those anticipated in forward-looking or past performance statements. IC Markets makes no representation or warranty and assumes no liability as to the accuracy or completeness of the information provided, nor any loss arising from any investment based on a recommendation, forecast or any information supplied by any third-party.

Silver potentialSilver. previous trade SL kicked in. now their seems 3 possibilties for a downward leg. 1. high hold. 2 false break. 3. ABC - C last leg