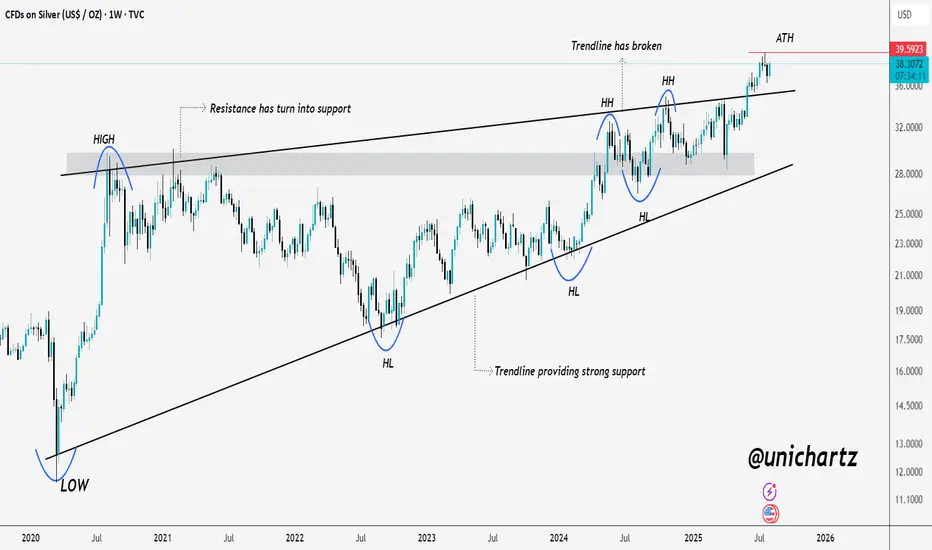
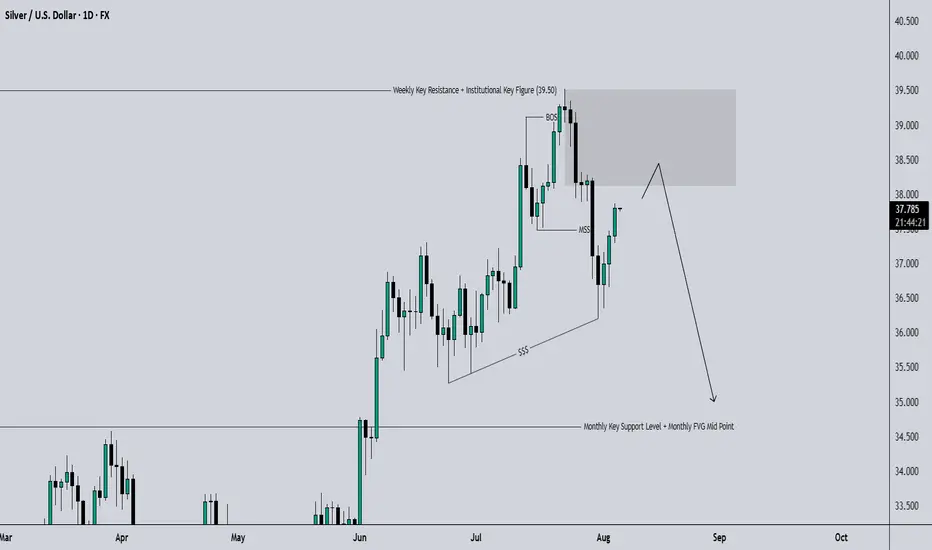
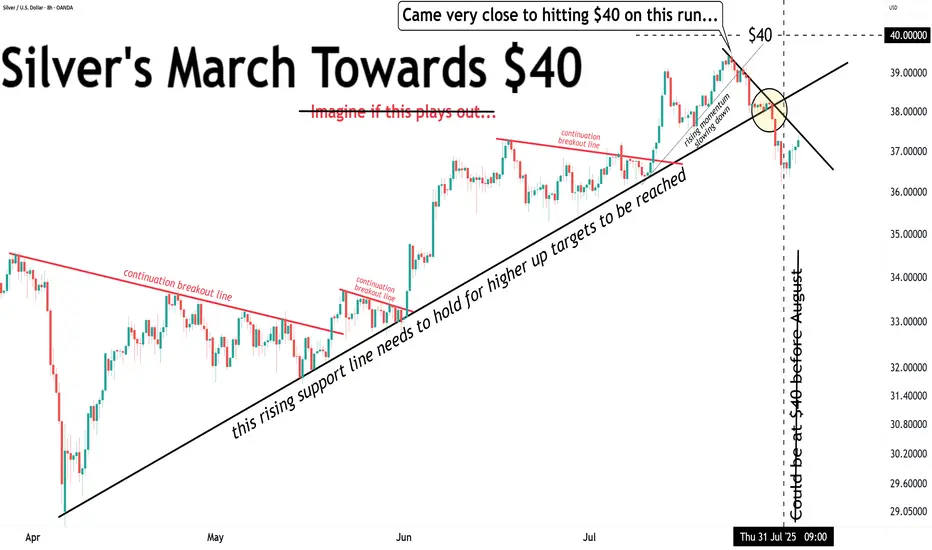
Silver Bulls Unstoppable – Price Discovery Next?Silver has been on a strong uptrend, consistently making higher lows (HL) and higher highs (HH) over the past few years.
The long-term trendline, which acted as strong support for multiple retests, was finally broken to the upside. The old resistance zone has now turned into a solid support area, showing clear bullish strength.
Currently, price is hovering just below its all-time high (ATH) around $39.59. If bulls manage to break and sustain above this level, we could see fresh highs and a strong continuation of the upward momentum.
DYOR, NFA
XAGUSD trade ideas
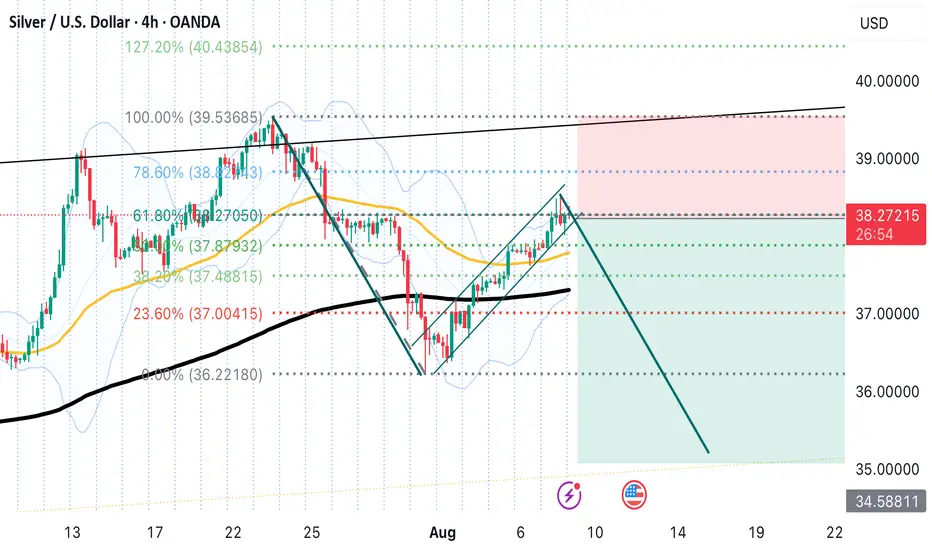
Silver' drop opportunity.Silver has rised last days very strongly in a narrow upward channel without any significant pullbeck. In my opinion it Is only pullbeck of downward trend from the last peak of 39,5 And the price Will Soon resume Its downward correction. I only don't know if the level for finishing this upward pullbeck finishihes ať 38,5 or around 39$. I'm bearish but be carefull and wait for the price break the Channel then shorting it Is very meaningful.
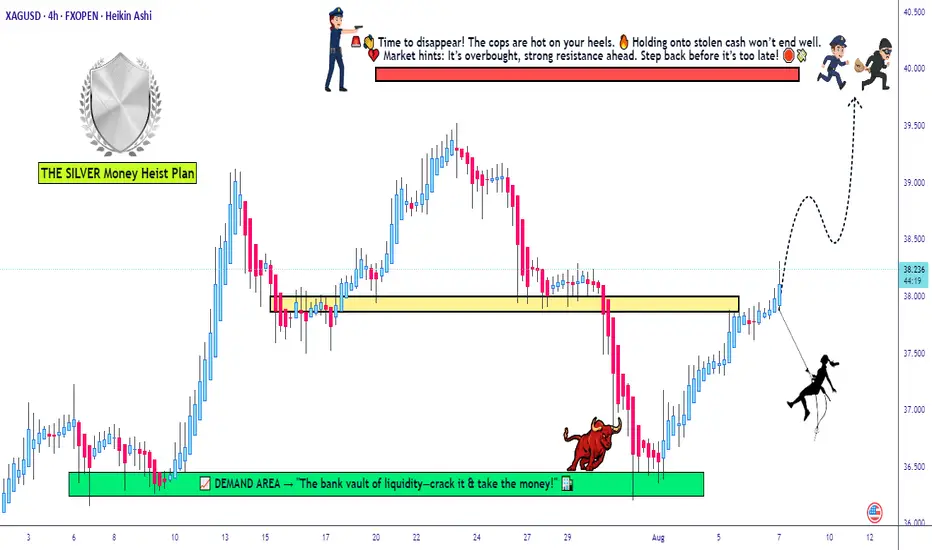
"THE SILVER JOB" // $XAG/USD ROBBERY PLAN UNLOCKED🚨SILVER HEIST LOADING... BULLS ON THE MOVE! 💥 XAG/USD THIEF PLAN 💰🐂
Asset: XAG/USD “The Silver”
📈 Plan: Bullish Thief Raid
🎯 Target Zone: 40.000 – “Police Barricade Resistance” + Overbought Hotspot
🛑 Stop Loss: 37.500 – Vault Alarm Level
💼 Entry: “Anywhere, Anytime” – The thief is layering his limit orders like a true market infiltrator!
💸💣THE THIEF'S MASTER ROBBERY PLAN👇
🧠 Mindset:
This isn’t just a trade — it’s a full-scale Silver Heist 🐱👤💰
The Thief has eyes on the big vault near 40.000, and we’re sneaking in using multiple limit orders. No fixed entry — just strategic placements near pullbacks or recent swings.
🔒 Stop Loss: Hidden beneath recent traps (37.500). If the alarm goes off — we vanish.
🚔 Target: 40.000 – Major resistance where the market police are camping! It's also an overbought zone, so get in, loot, and exit clean.
📉 SITUATION REPORT:
📊 Market Mood: Bullish
🔥 Momentum Shift: Strong breakout signs
⚠️ Danger Zone: High volatility approaching — stay alert!
💥 Macro + Technical Confluence: Bulls gathering force – volume rising, trend intact.
👇 TIPS FROM THE THIEF 👇
🧲 Scalpers & Swingers:
Stick to the Long side only!
Use a Trailing SL like a grappling hook — protect profits as you climb.
⚔️ If you’re undercapitalized, layer wisely and avoid overexposure!
📰 News Threat?
Don’t raid during sirens (major releases). Wait it out, then re-enter when it’s calm again.
🧠 Psych Game:
Avoid revenge trades. Set your plan, rob smart, rob clean 🧤🔍
🚀 Ready to Ride with the Robbery Crew?
💖 Boost this Idea to support the Thief Guild!
🎯 Stay tuned for more Heist Plans!
🤑 Join the raid. Rob the market. Run with profits. 🎒💨
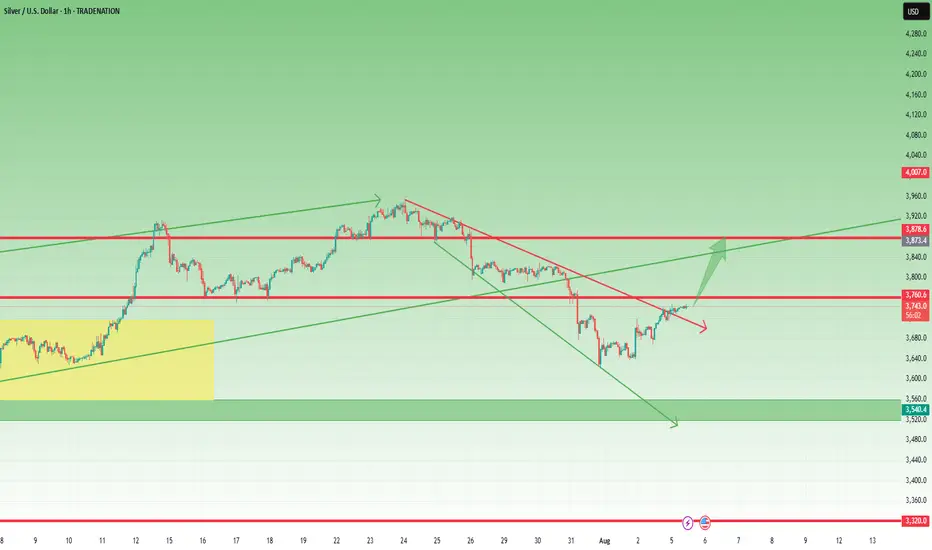
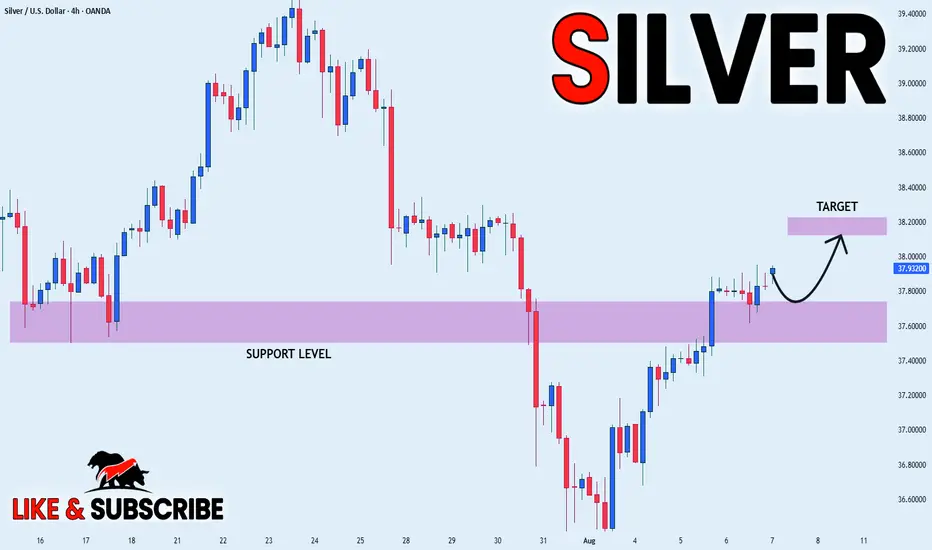
XAGUSD: Correction May Be Over – Watch $37.60 BreakoutAfter reaching a local top around the $39.50 zone on July 24, Silver entered a normal corrective phase, with price dropping over 3,000 pips from top to bottom — roughly an 8% retracement.
📉 Despite the strength of the drop, the structure was clearly corrective, not impulsive. Even more, the move formed a descending broadening wedge, a pattern that often hints at a potential reversal.
📈 Yesterday, we saw a clean breakout above the wedge’s upper boundary — which may signal the end of the correction.
At the time of writing, price is trading at $37.45, right under a key horizontal resistance zone between $37.50 and $37.60.
A breakout above this level would confirm the low and likely initiate a new move toward the $38.70 resistance.
________________________________________
🎯 Summary & Plan:
• A break above $37.60 = bullish confirmation
• Target: $38.70 (first resistance)
• Invalidation: If price drops below $37, bulls lose control
As long as price holds above the $37 zone, the technical outlook remains constructive, and traders could consider setups aligned with the upside scenario. 🚀
Disclosure: I am part of TradeNation's Influencer program and receive a monthly fee for using their TradingView charts in my analyses and educational articles.
SILVER: Strong Bearish Sentiment! Short!
My dear friends,
Today we will analyse SILVER together☺️
The recent price action suggests a shift in mid-term momentum. A break below the current local range around 38.167 will confirm the new direction downwards with the target being the next key level of 37.993.and a reconvened placement of a stop-loss beyond the range.
❤️Sending you lots of Love and Hugs❤️

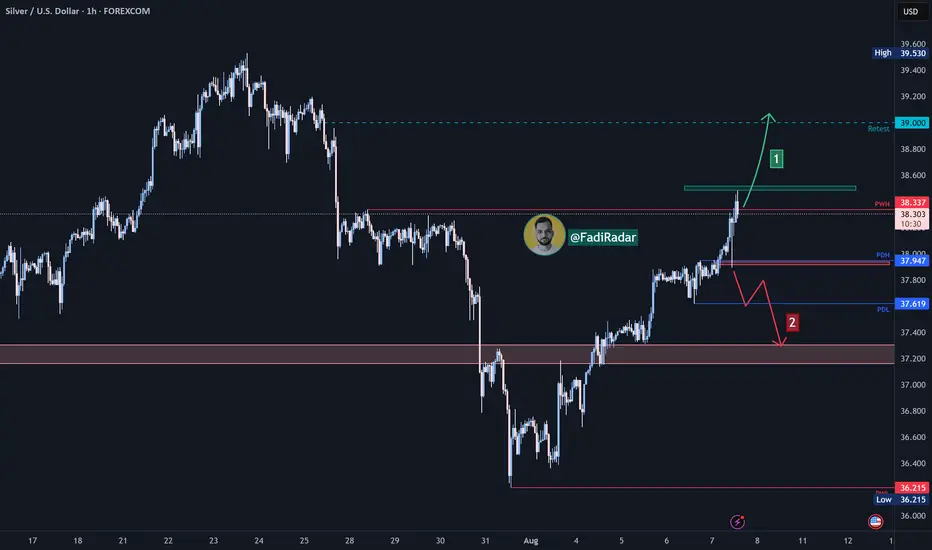
Silver (XAG/USD):Silver extended its bullish move, breaking above the $38.00 resistance zone, and is currently trading near $38.34.
🔹 Bullish Scenario (1):
If momentum continues and price holds above $38.30, the next potential targets are $38.80, followed by $39.00.
🔹 Bearish Scenario (2):
However, a rejection followed by a break below $37.95 and $37.62 may trigger a deeper pullback toward the demand zone $37.30 .
⚠️ Disclaimer:
This is not financial advice. Please monitor price action and market conditions before making any investment decisions.
SILVER My Opinion! SELL!
My dear friends,
Please, find my technical outlook for SILVER below:
The price is coiling around a solid key level - 37.026
Bias - Bearish
Technical Indicators: Pivot Points Low anticipates a potential price reversal.
Super trend shows a clear sell, giving a perfect indicators' convergence.
Goal - 36.725
Safe Stop Loss - 37.189
About Used Indicators:
The pivot point itself is simply the average of the high, low and closing prices from the previous trading day.
Disclosure: I am part of Trade Nation's Influencer program and receive a monthly fee for using their TradingView charts in my analysis.
———————————
WISH YOU ALL LUCK
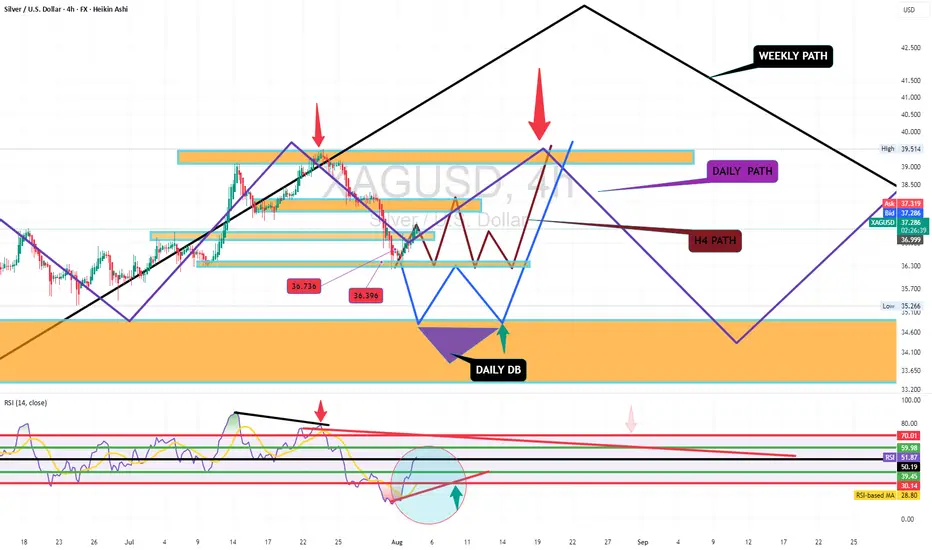
XAGUSD SWING: SHORT-TERM BEARISH OPPORTUNITY Hi there,
For Silver, I am long term bullish but we have a set up for some short opportunity.
As annotated, we are primed to see lower prices... between 34 - 34.5
If this happens, I'd resume looking for massive long opportunities.
You might want to keep this on your radar.
Cheers,
Jabari
HI GUYShere i have a sneak peak of how i think silver has to play out.
i expect sells now, as we form the daily double bottom.
what do u think
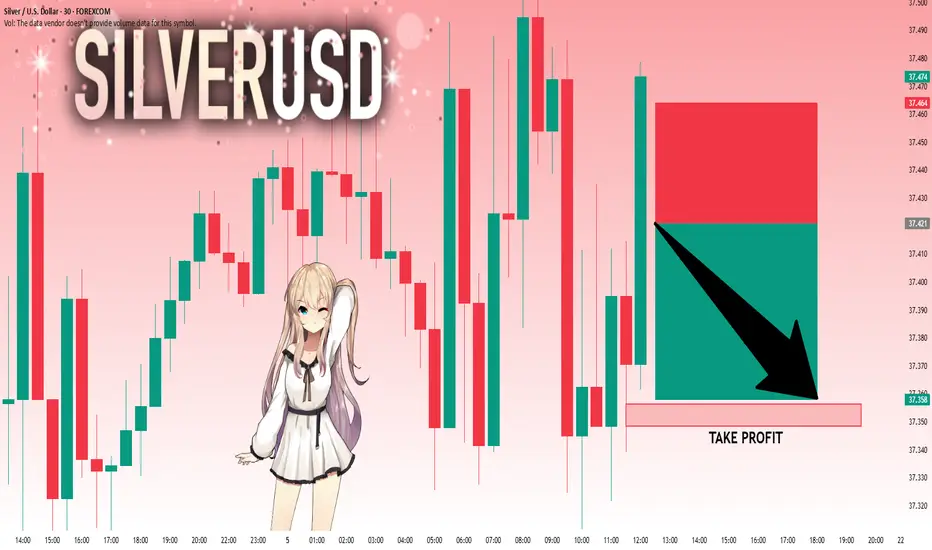
SILVER: The Market Is Looking Down! Short!
My dear friends,
Today we will analyse SILVER together☺️
The recent price action suggests a shift in mid-term momentum. A break below the current local range around 37.421 will confirm the new direction downwards with the target being the next key level of 37.356.and a reconvened placement of a stop-loss beyond the range.
❤️Sending you lots of Love and Hugs❤️
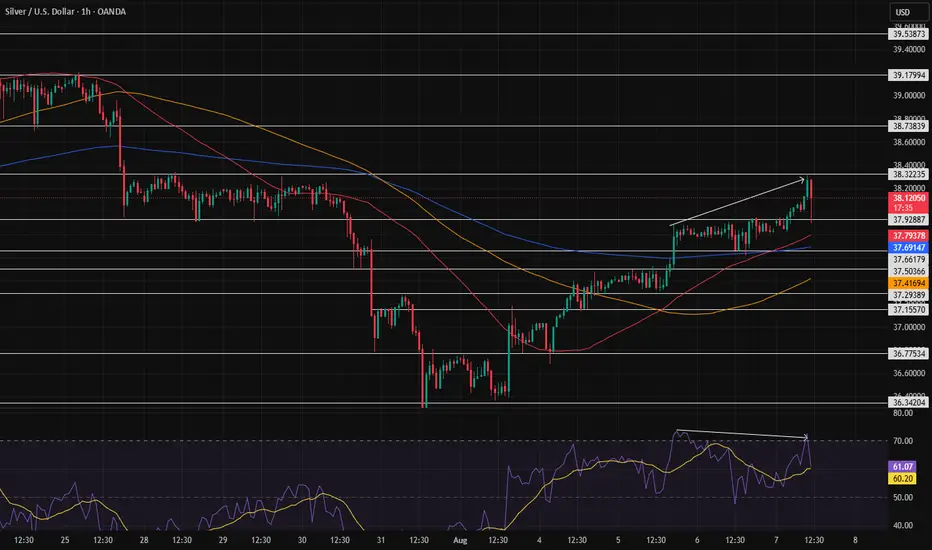
Resistance at 38.32235After the price reached the point we mentioned and got rejected, it's now trying to approach that area again. However, we're seeing a divergence, which could indicate weakness in the trend—though that's not always the case.
In any case, we have to wait and see; if it manages to break through that level, we can hope for the price to reach 39.17994.
Trading balanceTrading balance The price of the asset has rebounded from the balance zone. With the prospect of growth into the resistance zone.

SILVER SWING POSITIONTVC:SILVER I am still holding this swing position entered last friday on silver. looks like still has room to move higher. I am trailing this.
SILVER WILL GO UP|LONG|
✅SILVER is going up
Now and the pair made a bullish
Breakout of the key horizontal
Level of 37.73$ and the breakout
Is confirmed so we are bullish
Biased and we will be expecting
A further bullish move up
LONG🚀
✅Like and subscribe to never miss a new idea!✅
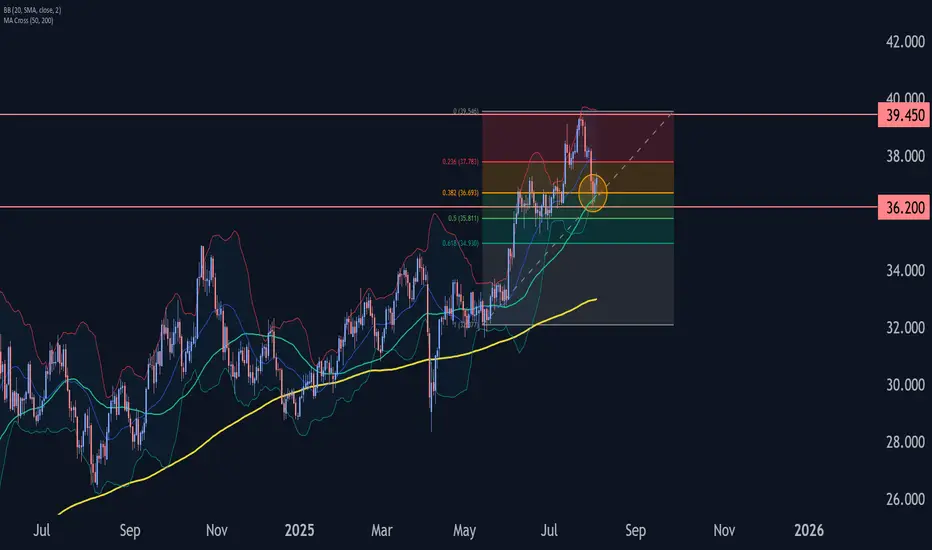
Silver Wave Analysis – 4 August 2025- Silver reversed from the support zone
- Likely to rise to the resistance level 39.45
Silver recently reversed from the support zone between the support level 36.20 (which also stopped wave ii at the start of July), lower daily Bollinger Band and the 38.2% Fibonacci correction of the upward impulse from May.
The upward reversal from this support zone created the daily Japanese candlesticks reversal pattern, Piercing Line – which marked the end of the earlier correction 2.
Given the clear daily uptrend, Silver can be expected to rise to the next resistance level at 39.45 (top of earlier impulse wave 1 from July).
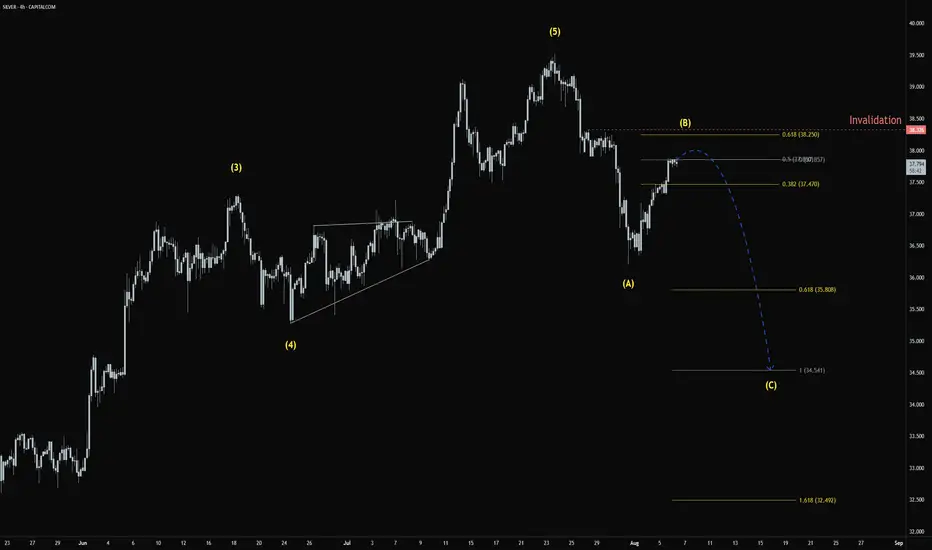
XAGUSDB wave looks cooked — rejection off the 0.618 zone. As long as 38.25 holds, C wave down to 35.80 → 34.50’s is in play. Break above = plan invalid.
#XAGUSD #Silver #WaveAnalysis
Silver Short IdeaBearish rising wedge breakout with PO of $28. Currently forming a rising wedge for the right shoulder of a head and shoulders top, not yet broken out… but we’re at the 50% retracement from the most recent multi year high.

(Updated) Silver Rebounds from Golden ZoneSilver dumped hard into the Golden Zone and reversed exactly where we marked it. Bulls stepping in? Now we watch for follow-through.
📌 Price respected the Golden Zone and reversed clean
📌 Bullish break and EMA shift underway
📌 Watching for continuation toward $38
⏱️ Timeframe: 1H
#silver #xagusd #fibonacci #reversalsetup #technicalanalysis #tradingview #quanttradingpro

Silver came very close to the $40 target ($39.52).Silver came very close to the $40 target ($39.52).
Currently in correction mode.
Nothing to see here... for now.
SILVER Going Upas you have might or might not seen i have posted this Buying opportunity of Silver few days ago, and now the market have creatd a new demand + Flip zone where we are looking for a new opportunity.
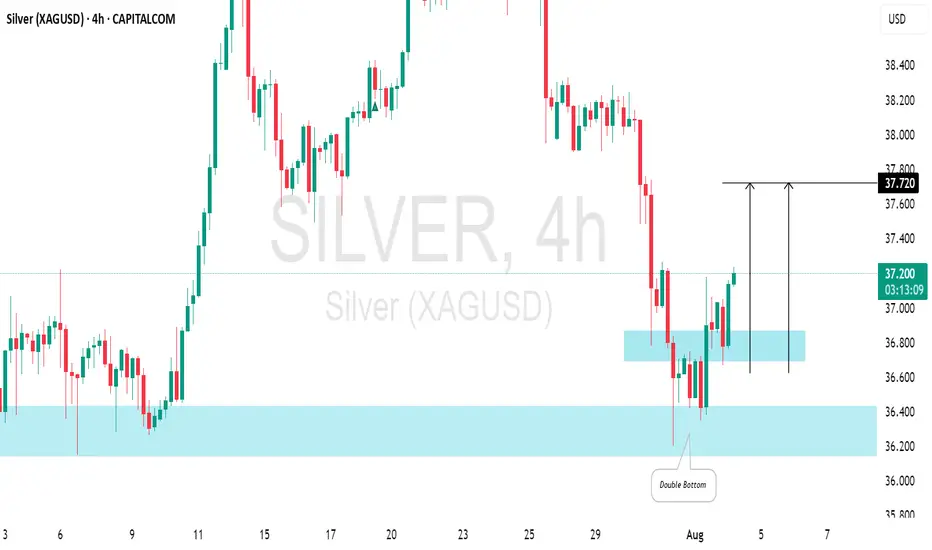
SILVER (XAGUSD): Bullish Reversal from Support Silver reacted significantly to the highlighted intraday resistance level during Friday's New York session.
I noticed a small double bottom pattern and the emergence of a bullish engulfing candle. I anticipate a pullback to the 37.72 level.
SILVER: Move Up Expected! Long!
My dear friends,
Today we will analyse SILVER together☺️
The in-trend continuation seems likely as the current long-term trend appears to be strong, and price is holding below a key level of 37.330 So a bearish continuation seems plausible, targeting the next low. We should enter on confirmation, and place a stop-loss beyond the recent swing level.
❤️Sending you lots of Love and Hugs❤️

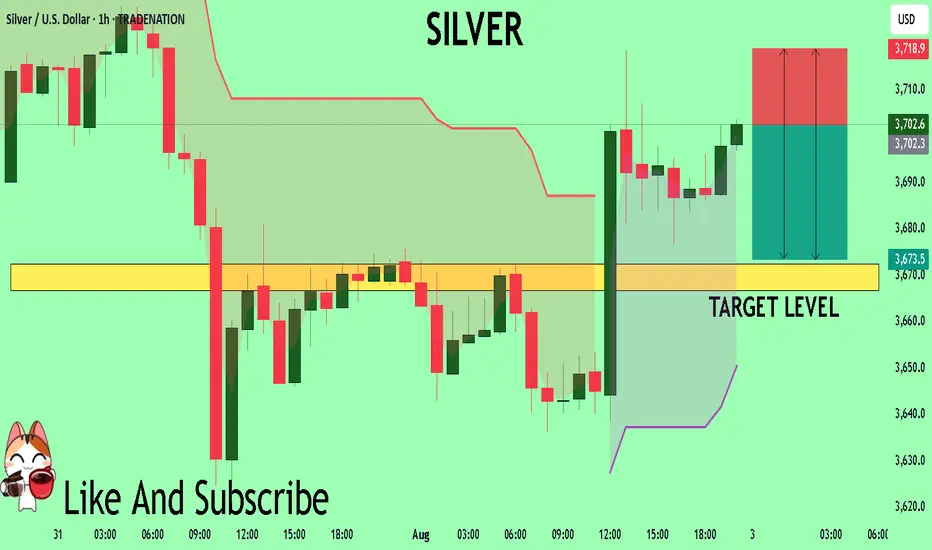
SILVER Is Going Down! Sell!
Please, check our technical outlook for SILVER.
Time Frame: 1h
Current Trend: Bearish
Sentiment: Overbought (based on 7-period RSI)
Forecast: Bearish
The market is trading around a solid horizontal structure 3,722.4.
The above observations make me that the market will inevitably achieve 3,685.7 level.
P.S
Please, note that an oversold/overbought condition can last for a long time, and therefore being oversold/overbought doesn't mean a price rally will come soon, or at all.
Disclosure: I am part of Trade Nation's Influencer program and receive a monthly fee for using their TradingView charts in my analysis.
Like and subscribe and comment my ideas if you enjoy them!
