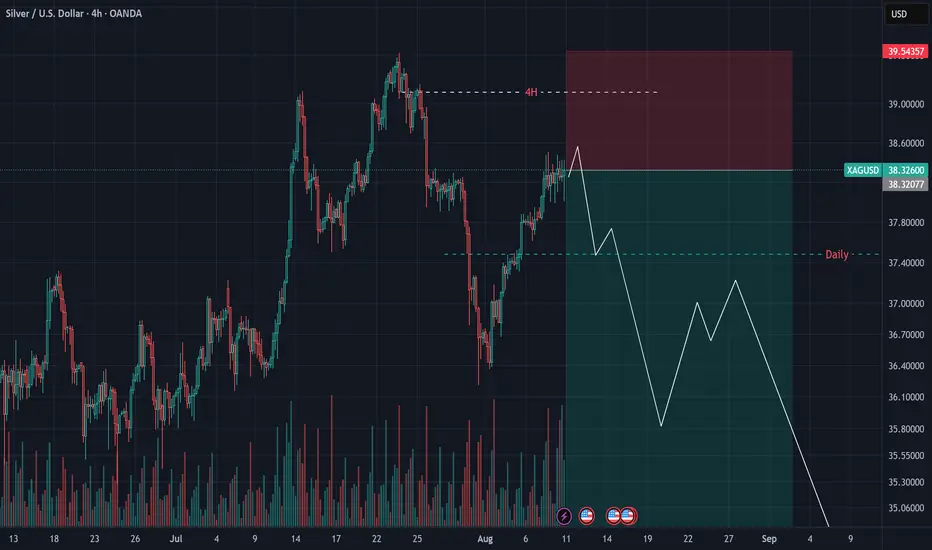
XAGUSD (SILVER): Sells For Now, Down To 35.80In this Weekly Market Forecast, we will analyze the XAGUSD (SILVER) for the week of Aug 4-8th.
Silver was strong, sweeping a 2012 high. Then sellers stepped in for the next couple of weeks, printing bearish candles. Friday say a late rally on weak job numbers, weakening the USD and allowing Silver and other asset pairs to outperform it in the short term.
Due to the bearish close of last week's candle, the indication is the rally was a market reaction, and that the slide will continue into this week.
Until there is a bullish break of market structure, buys are not a great idea. Stick with sells, down to the Monthly +FVG.
Enjoy!
May profits be upon you.
Leave any questions or comments in the comment section.
I appreciate any feedback from my viewers!
Like and/or subscribe if you want more accurate analysis.
Thank you so much!
Disclaimer:
I do not provide personal investment advice and I am not a qualified licensed investment advisor.
All information found here, including any ideas, opinions, views, predictions, forecasts, commentaries, suggestions, expressed or implied herein, are for informational, entertainment or educational purposes only and should not be construed as personal investment advice. While the information provided is believed to be accurate, it may include errors or inaccuracies.
I will not and cannot be held liable for any actions you take as a result of anything you read here.
Conduct your own due diligence, or consult a licensed financial advisor or broker before making any and all investment decisions. Any investments, trades, speculations, or decisions made on the basis of any information found on this channel, expressed or implied herein, are committed at your own risk, financial or otherwise.
XAGUSD trade ideas

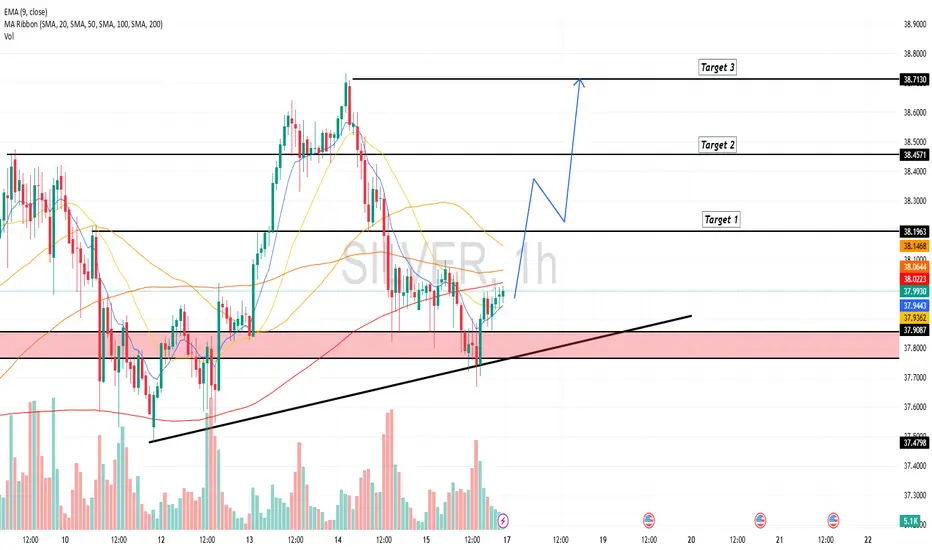
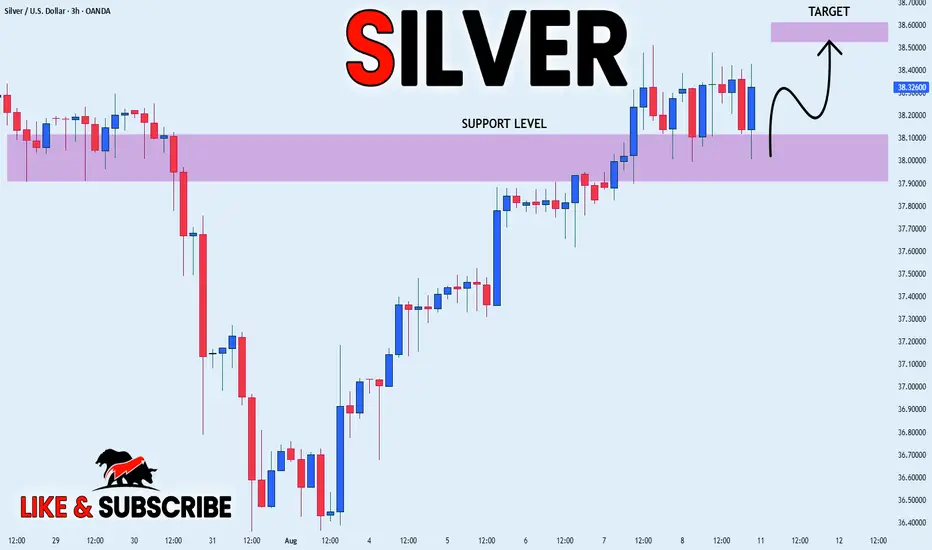
Trend reversal?If the support in the \$37–\$38 range is confirmed, a long position can be taken targeting a new all-time high (ATH).
SILVER: Short Trade with Entry/SL/TP
SILVER
- Classic bearish formation
- Our team expects pullback
SUGGESTED TRADE:
Swing Trade
Short SILVER
Entry - 37.026
Sl - 37.200
Tp - 36.721
Our Risk - 1%
Start protection of your profits from lower levels
Disclosure: I am part of Trade Nation's Influencer program and receive a monthly fee for using their TradingView charts in my analysis.
❤️ Please, support our work with like & comment! ❤️

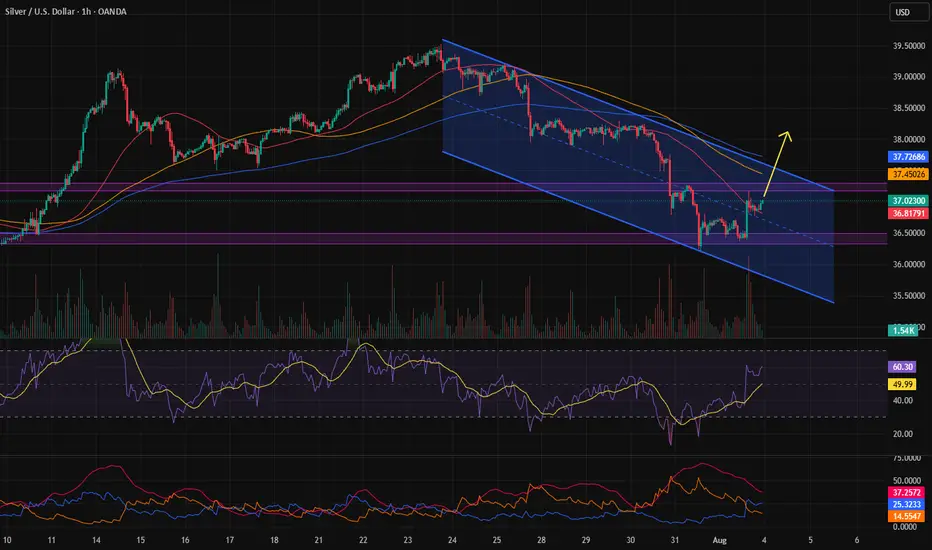
Silver is Again in the Bullish directionHello Traders
In This Chart XAGUSD HOURLY Forex Forecast By FOREX PLANET
today XAGUSD analysis 👆
🟢This Chart includes_ (XAGUSD market update)
🟢What is The Next Opportunity on XAGUSD Market
🟢how to Enter to the Valid Entry With Assurance Profit
This CHART is For Trader's that Want to Improve Their Technical Analysis Skills and Their Trading By Understanding How To Analyze The Market Using Multiple Timeframes and Understanding The Bigger Picture on the Charts
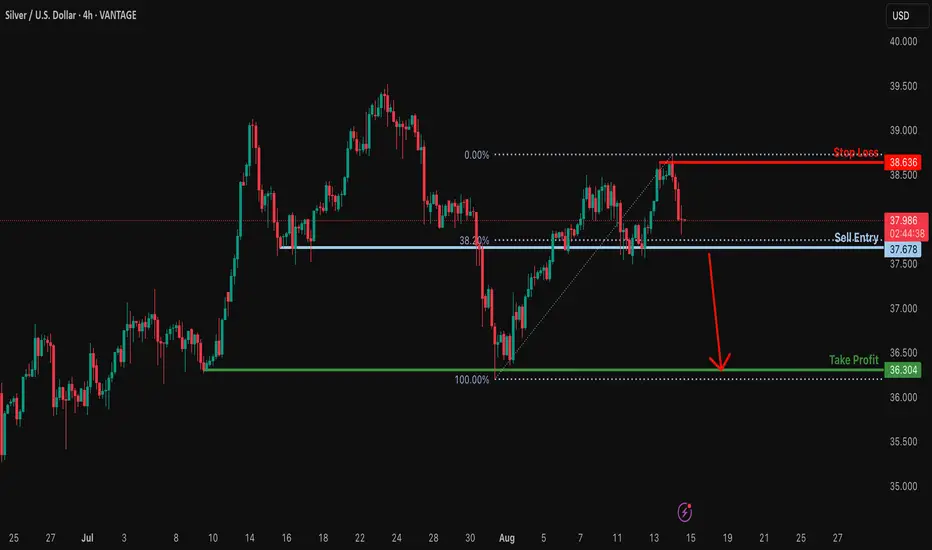
Could we see a breakout on the Silver?The price is falling towards the support level which is an overlap support that lines up with the 38.2% Fibonacci retracement, and a breakout off this level could lead the price to drop from this level to our take profit.
Entry: 37.67
Why we like it:
There is an overlap support that lines up with the 38.2% Fibonacci retracement.
Stop loss: 38.63
Why we like it:
There is a swing high resistance.
Take profit: 36.30
Why we like it:
There is a multi-swing low support.
Enjoying your TradingView experience? Review us!
Please be advised that the information presented on TradingView is provided to Vantage (‘Vantage Global Limited’, ‘we’) by a third-party provider (‘Everest Fortune Group’). Please be reminded that you are solely responsible for the trading decisions on your account. There is a very high degree of risk involved in trading. Any information and/or content is intended entirely for research, educational and informational purposes only and does not constitute investment or consultation advice or investment strategy. The information is not tailored to the investment needs of any specific person and therefore does not involve a consideration of any of the investment objectives, financial situation or needs of any viewer that may receive it. Kindly also note that past performance is not a reliable indicator of future results. Actual results may differ materially from those anticipated in forward-looking or past performance statements. We assume no liability as to the accuracy or completeness of any of the information and/or content provided herein and the Company cannot be held responsible for any omission, mistake nor for any loss or damage including without limitation to any loss of profit which may arise from reliance on any information supplied by Everest Fortune Group.
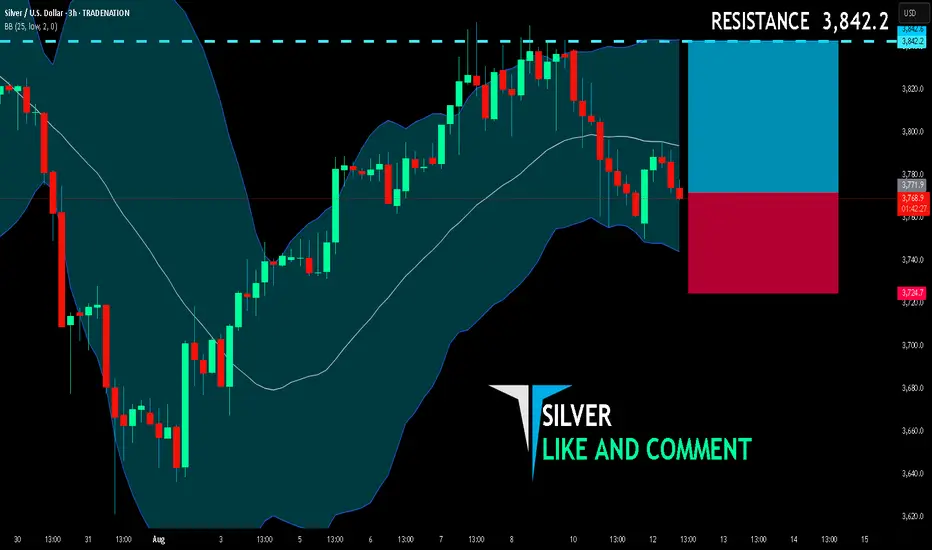
SILVER BUYERS WILL DOMINATE THE MARKET|LONG
SILVER SIGNAL
Trade Direction: long
Entry Level: 3,771.9
Target Level: 3,842.2
Stop Loss: 3,724.7
RISK PROFILE
Risk level: medium
Suggested risk: 1%
Timeframe: 3h
Disclosure: I am part of Trade Nation's Influencer program and receive a monthly fee for using their TradingView charts in my analysis.
✅LIKE AND COMMENT MY IDEAS✅
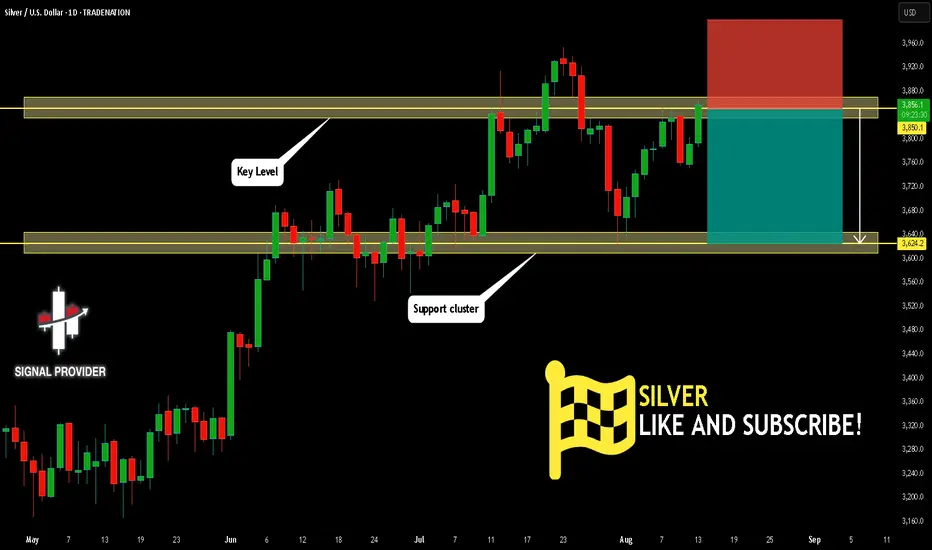
SILVER Is Going Down! Sell!
Please, check our technical outlook for SILVER.
Time Frame: 1D
Current Trend: Bearish
Sentiment: Overbought (based on 7-period RSI)
Forecast: Bearish
The market is approaching a significant resistance area 3,850.1.
Due to the fact that we see a positive bearish reaction from the underlined area, I strongly believe that sellers will manage to push the price all the way down to 3,624.2 level.
P.S
Overbought describes a period of time where there has been a significant and consistent upward move in price over a period of time without much pullback.
Disclosure: I am part of Trade Nation's Influencer program and receive a monthly fee for using their TradingView charts in my analysis.
Like and subscribe and comment my ideas if you enjoy them!
SHORT ON XAGUSD (SILVER)SILVER has completed its pullback to a major supply zone.
I will be selling silver to the next demand level.
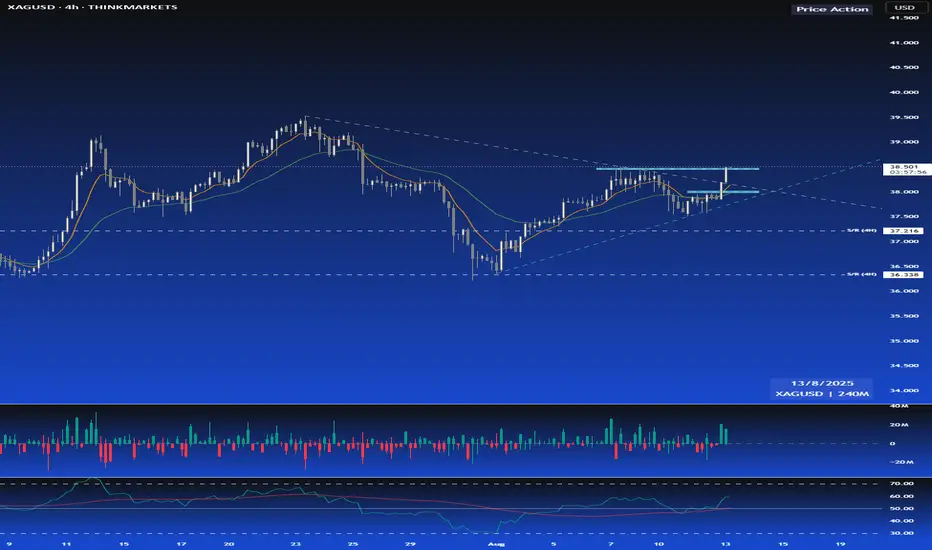
XAGUSD STRONG BULLISH MOVE#Silver is having a fest breaking short-term resistance with positive volume delta. This pair is performing better than #GOLD
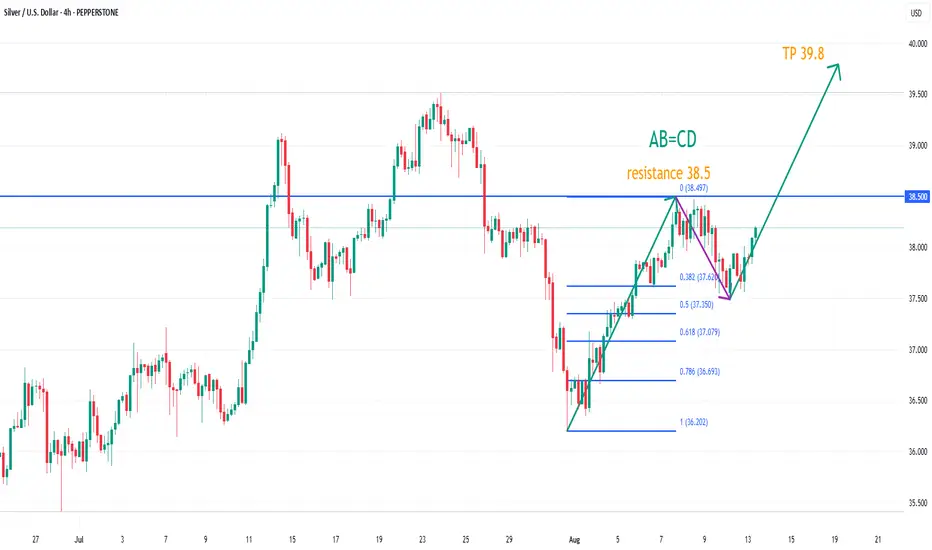
XAGUSD upside target 39.8On the 4-hour chart, XAGUSD has stabilized and is rising after a pullback, with short-term bulls taking advantage. Currently, the upper resistance is around 38.5. A break above this level will continue to push higher, with the upward target around 39.8. (AB=CD)
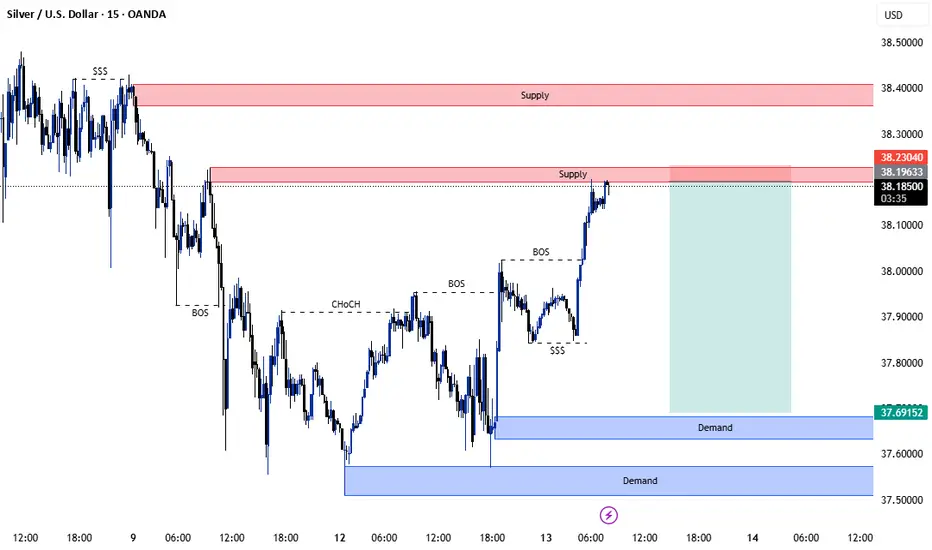
Silver Analysis – 15-Minute Timeframe (August 13, 2025)This is the structural outlook I currently have for silver. I'm watching the red-marked zones on the chart as potential areas for short setups. No entry yet—I'm waiting for a valid confirmation before executing any trades.
🔴 Risky Order Blocks Identified Both red zones are considered risky order blocks since they were not formed following Fair Value Gaps (FVG). That reduces their reliability somewhat. Still, there's no concern—waiting for confirmation helps avoid unnecessary stop-loss hits.
🎯 Entry Strategy Patience is key. I won’t enter until a proper setup forms. Jumping in without confirmation in these zones carries higher risk, but with the right trigger, they could offer solid opportunities.
📌 Disclaimer This is a personal analysis and not financial advice. Please manage your risk and capital responsibly before making any trading decisions.
Good luck and stay sharp! ⚡
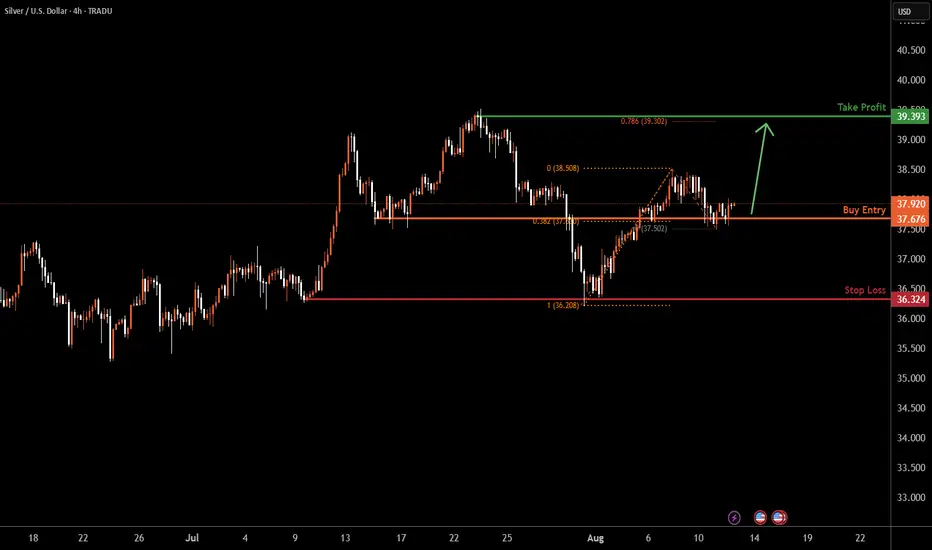
SILVER H4 | Bullish bounce offXAG/USD is reacting off the buy entry, which is a pullback support that aligns with the 38.2% Fibonacci retracement and could bounce from this level to the take profit.
Buy entry is at 37.67, which is a pullback support that lines up with the 38.2% Fibonacci retracement.
Stop loss is at 36.32, which is a multi-swing low support.
Take profit is at 39.39, which is a swing high resistance that lines up with the 78.6% Fibonacci projection.
High Risk Investment Warning
Trading Forex/CFDs on margin carries a high level of risk and may not be suitable for all investors. Leverage can work against you.
Stratos Markets Limited (tradu.com ):
CFDs are complex instruments and come with a high risk of losing money rapidly due to leverage. 65% of retail investor accounts lose money when trading CFDs with this provider. You should consider whether you understand how CFDs work and whether you can afford to take the high risk of losing your money.
Stratos Europe Ltd (tradu.com ):
CFDs are complex instruments and come with a high risk of losing money rapidly due to leverage. 66% of retail investor accounts lose money when trading CFDs with this provider. You should consider whether you understand how CFDs work and whether you can afford to take the high risk of losing your money.
Stratos Global LLC (tradu.com ):
Losses can exceed deposits.
Please be advised that the information presented on TradingView is provided to Tradu (‘Company’, ‘we’) by a third-party provider (‘TFA Global Pte Ltd’). Please be reminded that you are solely responsible for the trading decisions on your account. There is a very high degree of risk involved in trading. Any information and/or content is intended entirely for research, educational and informational purposes only and does not constitute investment or consultation advice or investment strategy. The information is not tailored to the investment needs of any specific person and therefore does not involve a consideration of any of the investment objectives, financial situation or needs of any viewer that may receive it. Kindly also note that past performance is not a reliable indicator of future results. Actual results may differ materially from those anticipated in forward-looking or past performance statements. We assume no liability as to the accuracy or completeness of any of the information and/or content provided herein and the Company cannot be held responsible for any omission, mistake nor for any loss or damage including without limitation to any loss of profit which may arise from reliance on any information supplied by TFA Global Pte Ltd.
The speaker(s) is neither an employee, agent nor representative of Tradu and is therefore acting independently. The opinions given are their own, constitute general market commentary, and do not constitute the opinion or advice of Tradu or any form of personal or investment advice. Tradu neither endorses nor guarantees offerings of third-party speakers, nor is Tradu responsible for the content, veracity or opinions of third-party speakers, presenters or participants.
SILVER Will Grow! Buy!
Hello,Traders!
SILVER made a retest
Of the horizontal support
Of 37.58$ and we are already
Seeing a bullish rebound
So we will be expecting
A further bullish continuation
Buy!
Comment and subscribe to help us grow!
Check out other forecasts below too!
Disclosure: I am part of Trade Nation's Influencer program and receive a monthly fee for using their TradingView charts in my analysis.

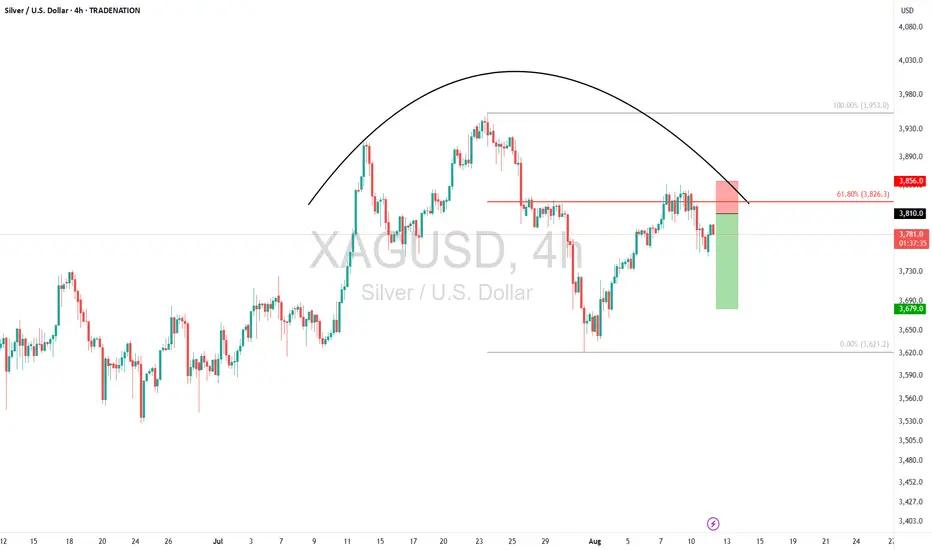
Silver – Selling into Resistance for Short-Term CorrectionTrade Idea
Type: Sell Limit
Entry: 3810
Target: 3679
Stop Loss: 3856
Duration: Intraday
Expires: 13/08/2025 06:00
Technical Overview
Price action is forming a top, suggesting a potential short-term reversal.
Sentiment has turned negative, creating scope for a further correction lower.
Hourly chart indicates room for limited upside before the downtrend resumes.
Strategy is to sell into rallies, using a tight stop to capture a downside move.
Key Technical Levels
Resistance: 3845 / 3950 / 4085
Support: 3720 / 3630 / 3460
Next Volatile Events
13:30 – Consumer Price Index (MoM) – US
13:30 – Consumer Price Index ex Food & Energy (YoY) – US
13:30 – Consumer Price Index ex Food & Energy (MoM) – US
13:30 – Consumer Price Index (YoY) – US
Disclosure: I am part of Trade Nation's Influencer program and receive a monthly fee for using their TradingView charts in my analysis.
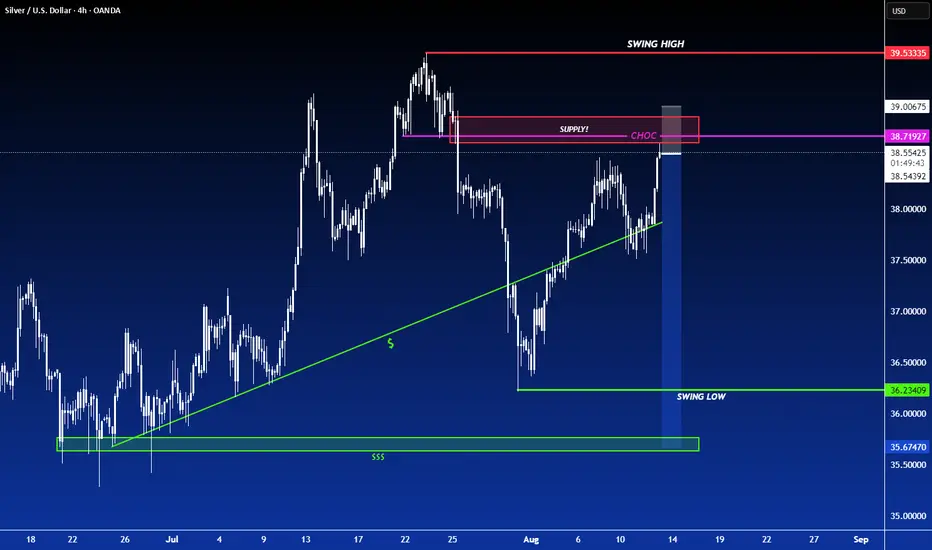
Silver’s uptrend cracks with U.S. inflation in focusSilver’s latest run ended abruptly on Monday, with the metal reversing hard, breaking its recent uptrend and forming a bearish evening star three-candle pattern. With RSI (14) and MACD momentum readings now neutral rather than bullish, the focus shifts to price action over holding a set bias.
If the signal from recent price action proves reliable—a big “if” with U.S. CPI looming—watch for a break beneath $37.46, the prior multi-decade high from February 2012. If that occurs, one option would be to establish shorts beneath the level with a stop above for protection, targeting support at either $36.27 or $35.50.
If silver fails to follow through on Monday’s reversal, the setup could be flipped, with longs established above the level and a stop beneath for protection. $38.50 or $38.73 screen as potential targets, with a break above the latter opening the door for a retest of the July 23 swing high at $39.53.
From a fundamental standpoint, the U.S. inflation report looms as Tuesday’s main volatility event. A monthly core reading of 0.4% or higher would likely create headwinds for riskier assets such as silver, curtailing Fed rate-cut pricing over the next year and strengthening the U.S. dollar. A core print below 0.3% could have the opposite effect, acting as a catalyst for a possible silver surge.
Good luck!
DS

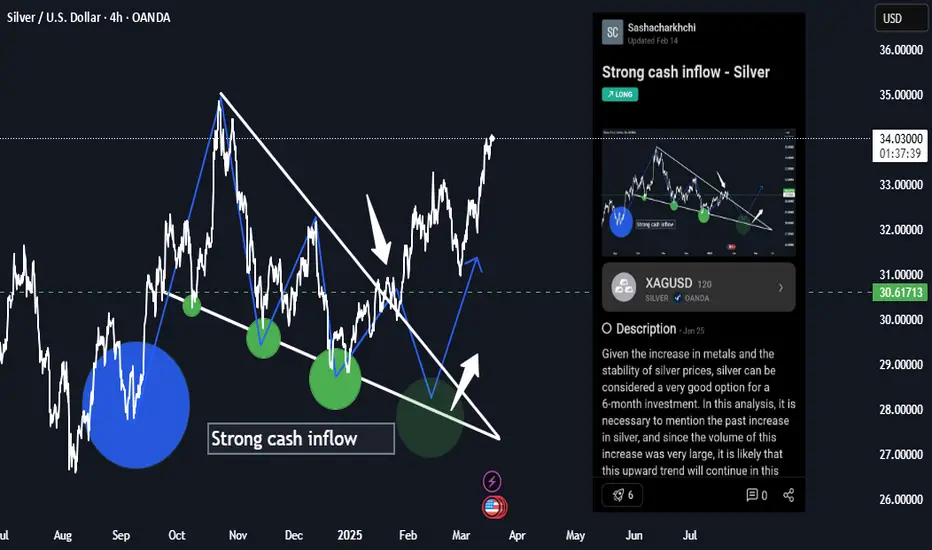
Silver - 6-month analysis and resultsThe strength of the price movement in silver has continued to increase since the 6-month analysis was sent for it, because this price analysis was done at the stop of the price movement, and with this increase in the price of silver and all metals in the financial markets, the price will increase.
Sasha Charkhchian
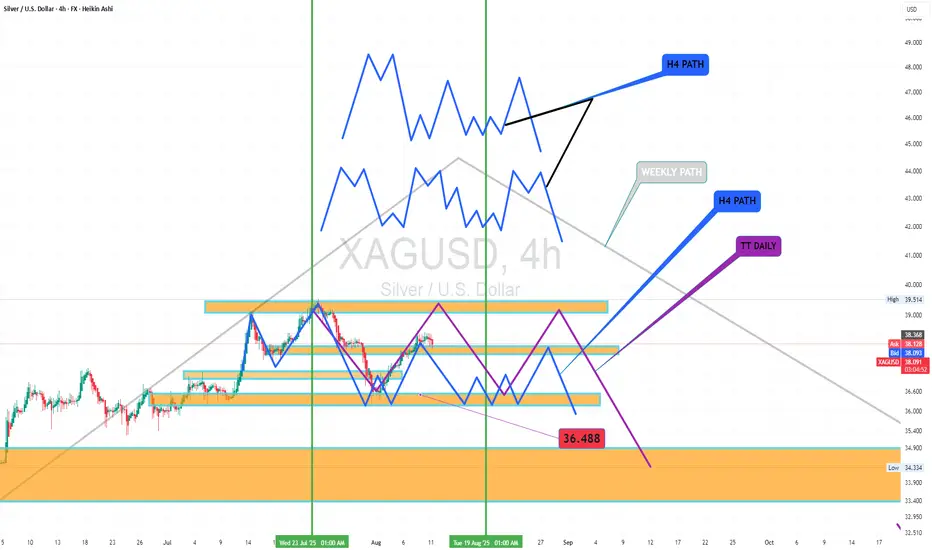
SILVER USDHI GUYS,
correction on silver trend.
we are selling through the H4 price pattern as we expect daily completion of tipple top for big time sells.
XAGIn my opinion, silver should break the previous ceiling of its hood and I am very confident in this breakthrough
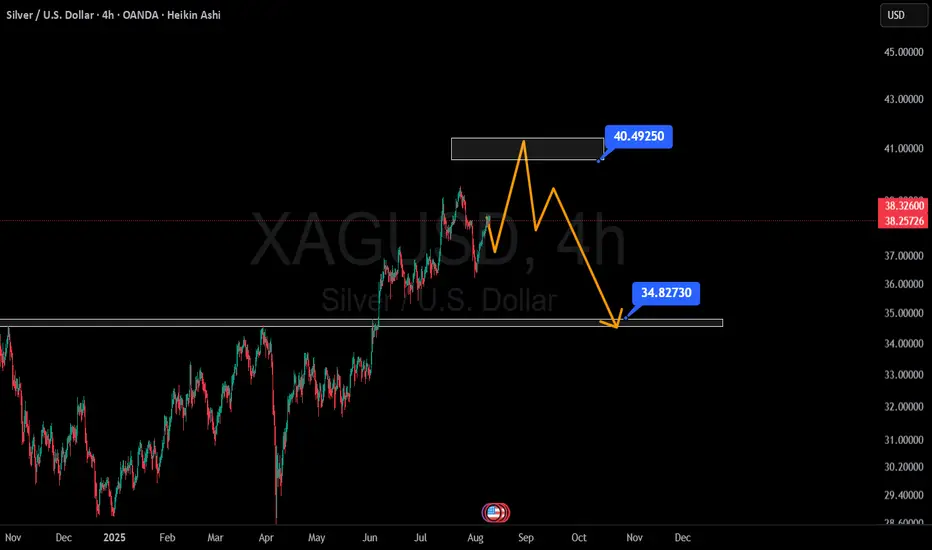
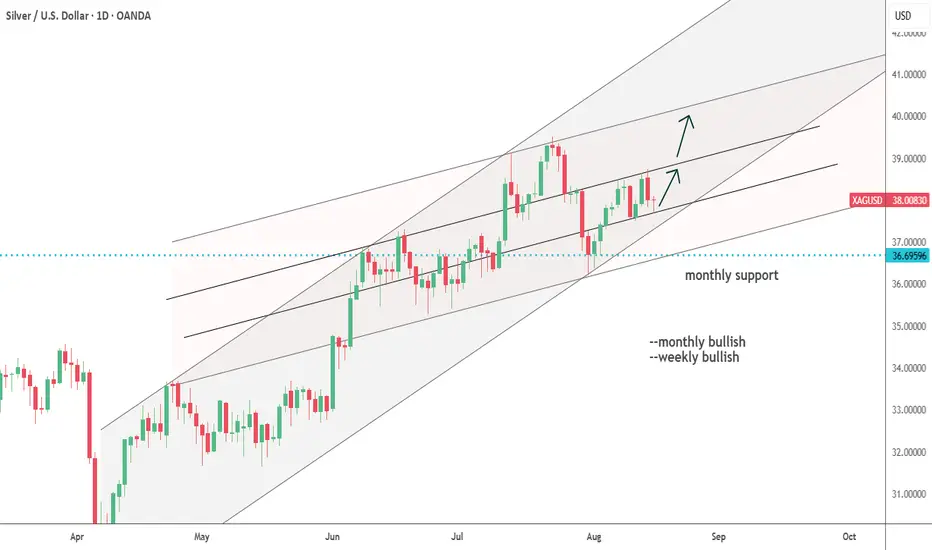
Silver Analysis – August 10, 2025Long-term outlook for Silver remains bullish,
but over the past few weeks, early signs of a correction have started to appear.
The break below $36 and inability to reclaim the previous high
suggest sellers are slowly stepping in.
My key liquidity zone sits between $33 – $34,
and I believe a revisit of this area is needed before Silver can make a meaningful push higher.
Summary:
If we don’t see a daily close above $38.5 this week,
I expect the correction to start from current levels and gradually target my main entry zone.
SILVER WILL GO UP|LONG|
✅SILVER is already making
A bullish rebound from the
Horizontal support of 38.10$
While trading in an uptrend
So we are bullish biased and
We will be expecting a
Further bullish move up
LONG🚀
✅Like and subscribe to never miss a new idea!✅
SILVER: Weak Market & Bearish Forecast
The charts are full of distraction, disturbance and are a graveyard of fear and greed which shall not cloud our judgement on the current state of affairs in the SILVER pair price action which suggests a high likelihood of a coming move down.
Disclosure: I am part of Trade Nation's Influencer program and receive a monthly fee for using their TradingView charts in my analysis.
❤️ Please, support our work with like & comment! ❤️

SILVER: Target Is Up! Long!
My dear friends,
Today we will analyse SILVER together☺️
The market is at an inflection zone and price has now reached an area around 38.330 where previous reversals or breakouts have occurred.And a price reaction that we are seeing on multiple timeframes here could signal the next move up so we can enter on confirmation, and target the next key level of 38.432.Stop-loss is recommended beyond the inflection zone.
❤️Sending you lots of Love and Hugs❤️