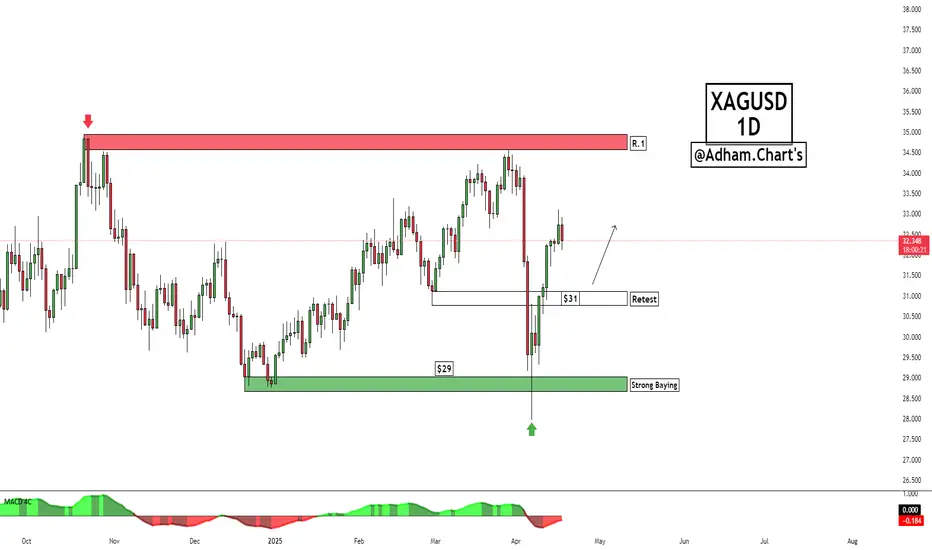
XAGUSD💡XAGUSD chart analysis (daily timeframe). After a positive reaction from the $29 area, the price rose strongly to surpass the $31 level, which had previously been broken. Retest – $31 level. After a strong rebound, the price returned to test the $31 area. This behavior is very positive, as it proves that buyers are defending this level once again.
If this test is successful, it will serve as confirmation of the start of a new uptrend. The MACD indicator shows an improvement in positive momentum. This supports a positive outlook in the near term.
⛔️Not investment advice for educational purposes only.
XAGUSD trade ideas
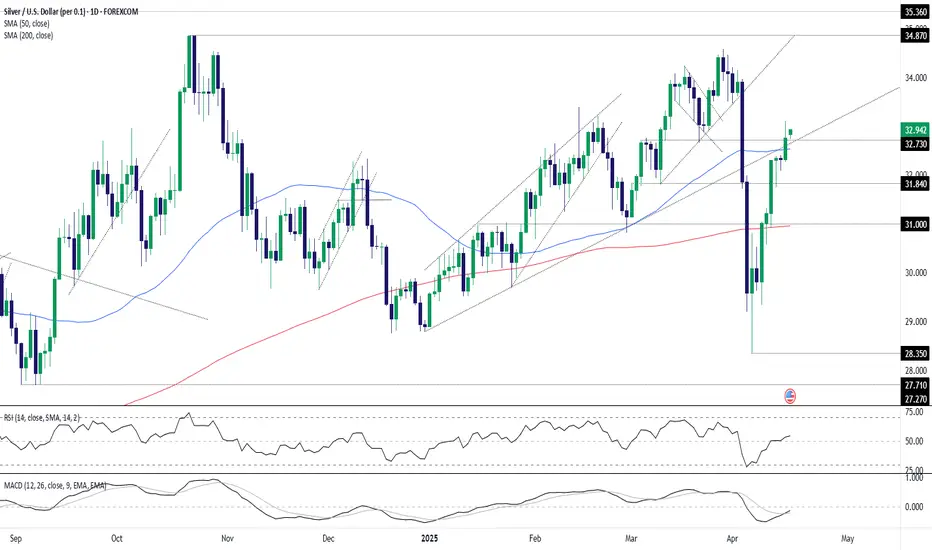
Silver Bulls Breaks Resistance, Eyes on $34.57 RetestThe upside risk we flagged earlier this week has now materialised for silver, with the spot price staging a bullish break above the 50-day moving average, resistance at $32.73, and the December 2024 uptrend on Wednesday.
Having closed above this former resistance zone, it may now provide a base for fresh longs targeting a retest of the March 28 swing high at $34.57. Levels to watch in between include Wednesday’s high at $32.16 and $33.50 which acted as support around the turn of the month. A stop loss beneath the uptrend would offer protection should the trade move against you.
While momentum indicators remain more neutral than outright bullish, the bias is to the upside following the breakout and ongoing trends in RSI (14) and MACD.
Good luck!
DS
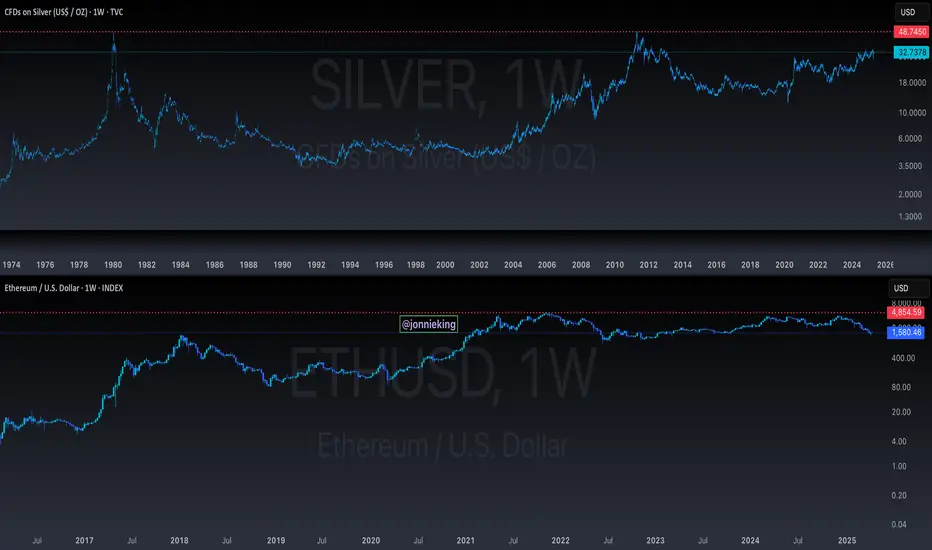
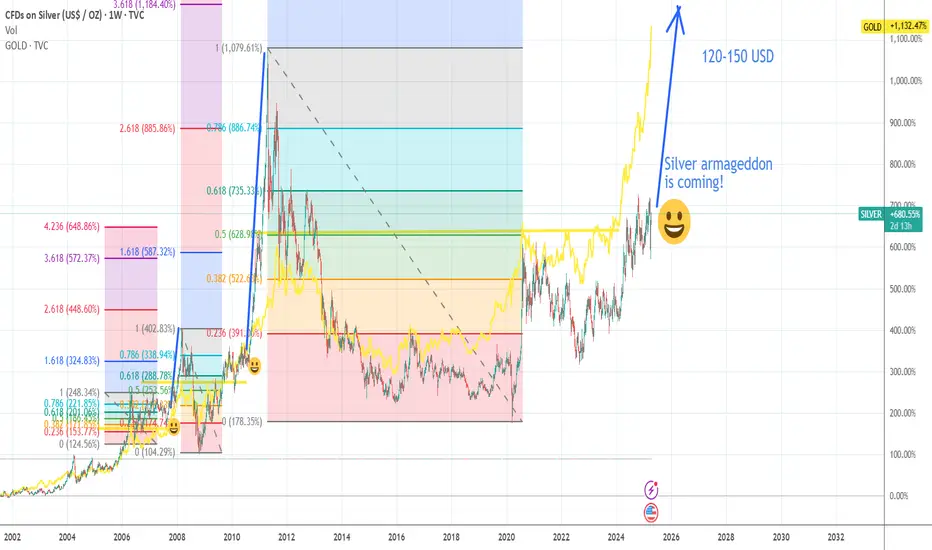
$ETH = Silver and $BTC = Gold Means WHAT!?They say Ethereum is the Silver to ₿itcoin being Gold.
If that's the case, does that mean that the ceiling for CRYPTOCAP:ETH will forever be stuck at $4,800
just like TVC:SILVER being capped at $48 for the past 45 years?
Does anyone really think ETH will be higher than $4,800 in 45 years???😆
A true store of value 💯
SILVER: Local Bullish Bias! Long!
My dear friends,
Today we will analyse SILVER together☺️
The recent price action suggests a shift in mid-term momentum. A break above the current local range around 32.833 will confirm the new direction upwards with the target being the next key level of 33.123 and a reconvened placement of a stop-loss beyond the range.
❤️Sending you lots of Love and Hugs❤️
XAG/USD For Bullishwait for pull-back near by entry point and then go long
general trend is up trend
have fun :)
XAG USD LONG SETUP Silver Price has been in Strong Bullsh trend after invalidating the double top pattern it formed previously.
Thereafter creating an ascending wedge and then spread out into an ascending triangle, from which I made and took the long position snd it's still moving in our target direction, so we'll see how it ends

Silver next move (wait for perfect entry & then ATH)(16-04-2025)Go through the analysis carefully, and do trade accordingly.
Anup 'BIAS for the day (16-04-2025)
Current price- 32.90
"if Price stays above 30.00, then next target is 34.00, 36.00 and 37.00 and below that 29.00 "
-POSSIBILITY-1
Wait (as geopolitical situation are worsening )
-POSSIBILITY-2
Wait (as geopolitical situation are worsening)
Best of luck
Never risk more than 1% of principal to follow any position.
Support us by liking and sharing the post.
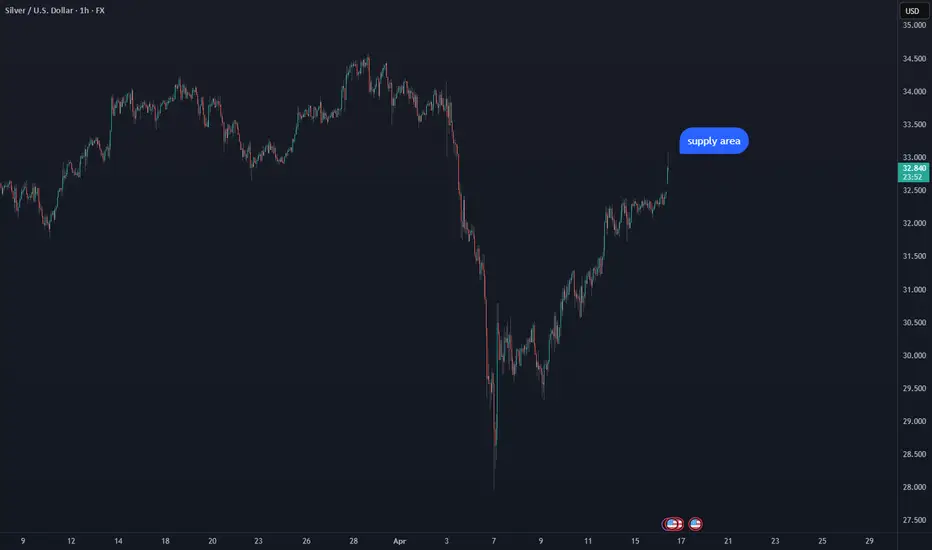
XAG USD possible swing shortWe are approaching some short term supply area and there could be some interesting setups around $33-34. We will see.
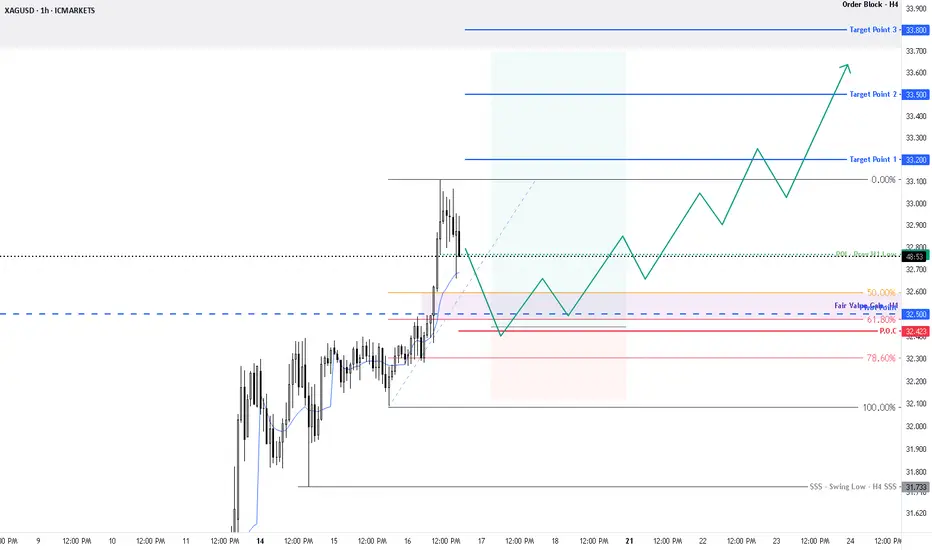
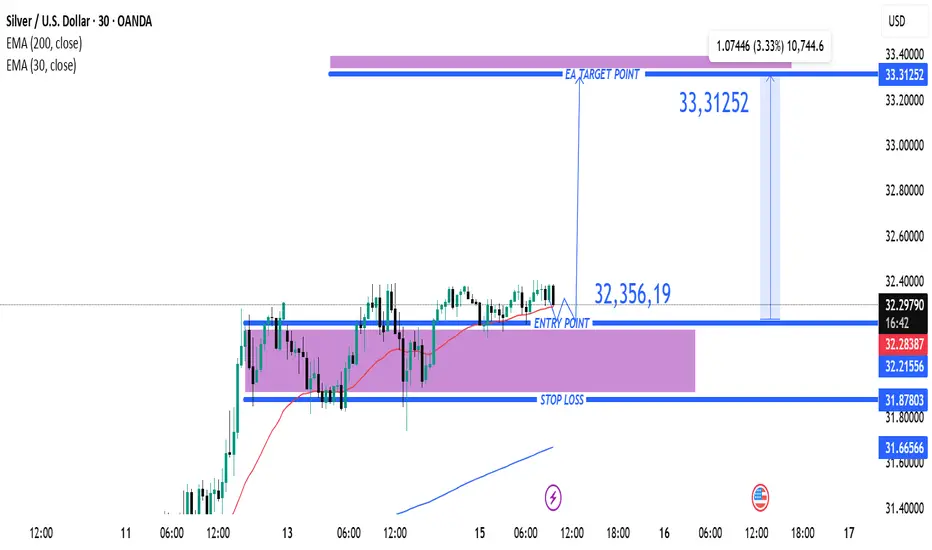
Silver (XAG/USD) Bullish Trade Setup: Entry, Target & Stop-Loss Entry Point: ~32.35619
Take Profit (Target Point): 33.31252
Stop Loss: 31.87803
EMA 200 (Blue): 31.65932 – indicating long-term trend support.
EMA 30 (Red): 32.28304 – indicating short-term trend.
Current Price: 32.38220
The price is above both EMAs, which is typically bullish.
---
Analysis
1. Bullish Bias:
Price has broken and is holding above the entry zone.
Both EMAs are aligned in a bullish configuration (short-term EMA above long-term EMA).
The market structure shows higher lows and sideways consolidation, suggesting potential for a breakout.
2. Risk-Reward Ratio:
Risk (Entry to Stop Loss)
SILVER at a CROSSROADS: Bounce or CRASH to $28?🔹 General Context
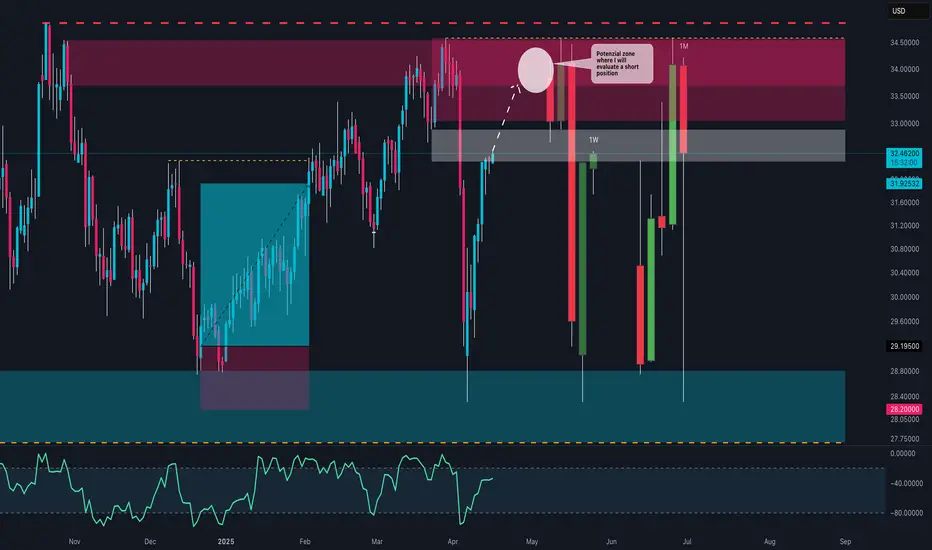
Silver has shown a strong bullish reaction from the lows around $28, later reaching a key monthly supply area between $34 and $35. However, this zone has once again been firmly rejected, leaving room for a potential deep retracement.
🟥 Key Zones
🔴 Monthly Supply Zone (34.00 - 35.00 USD): Strong resistance already tested multiple times. Candlesticks show strong rejections and long upper wicks.
🟥 Weekly Supply Zone (33.00 - 34.00 USD): Breaker block or mitigation area that triggered a strong bearish move.
⬛ Current Weekly Support Zone (32.00 - 31.90 USD): Price is currently testing this area. A new impulse could arise here — or we may witness a breakdown.
🟦 Monthly Demand Zone (28.20 - 29.20 USD): The last area defended by buyers in the mid-term. A realistic target in case of breakdown.
📊 Price Structure
The short- to medium-term trend remains bearish, with lower highs and strong rejection candles.
Current price action shows indecision, with lower wicks on recent weekly candles but smaller bullish bodies — a sign of potential accumulation... or just a pullback?
📉 RSI (Relative Strength Index)
RSI is in the neutral-high zone, not yet overbought, but in a downward phase → more room for downside if buyers don’t step in soon.
No clear divergences visible, but watch for signals on the daily timeframe.
🧭 Possible Scenarios
✅ BULLISH Scenario:
Condition: Support holds between 32.50 and 31.90 USD with a clear reversal candle.
Target: Move back toward the supply zone at 33.80 – 34.90 USD.
Confirmation: Break above 33.00 USD with increasing volume.
❌ BEARISH Scenario:
Condition: Weekly close below 31.90 USD → sign of weakness.
Target: Zone between 29.20 – 28.20 USD, a potential new institutional buy area.
Confirmation: Strong bearish break with follow-through and lack of buying reaction.
🧠 Operational Conclusion
Silver is at a critical decision point: bearish pressure from the monthly zones is evident, but as long as the 31.90/32.00 zone holds, buyers may still defend. A clean breakdown would open the door for a drop below $30.
SILVER: Bulls Are Winning! Long!
My dear friends,
Today we will analyse SILVER together☺️
The in-trend continuation seems likely as the current long-term trend appears to be strong, and price is holding above a key level of 32.235 So a bullish continuation seems plausible, targeting the next high. We should enter on confirmation, and place a stop-loss beyond the recent swing level.
❤️Sending you lots of Love and Hugs❤️
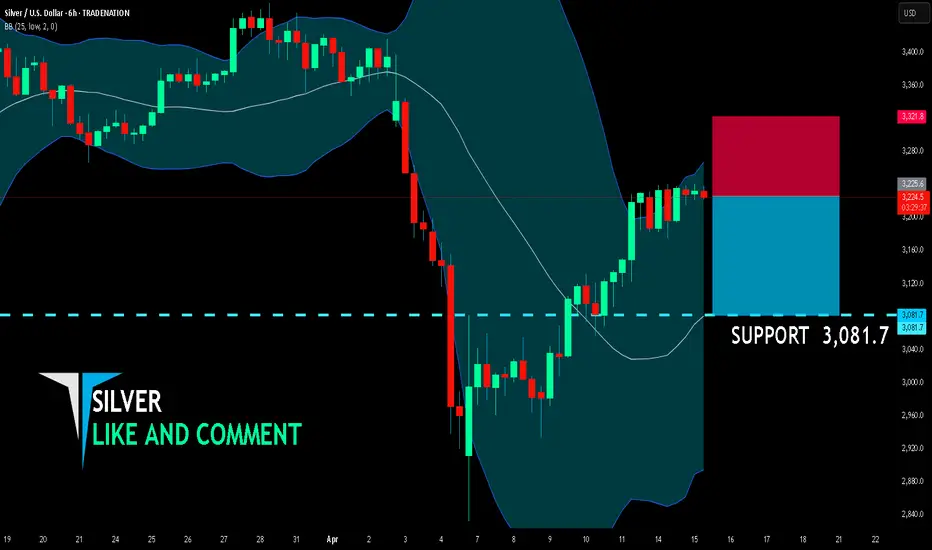
SILVER BEARISH BIAS RIGHT NOW| SHORT
SILVER SIGNAL
Trade Direction: short
Entry Level: 3,225.6
Target Level: 3,081.7
Stop Loss: 3,321.8
RISK PROFILE
Risk level: medium
Suggested risk: 1%
Timeframe: 6h
Disclosure: I am part of Trade Nation's Influencer program and receive a monthly fee for using their TradingView charts in my analysis.
✅LIKE AND COMMENT MY IDEAS✅
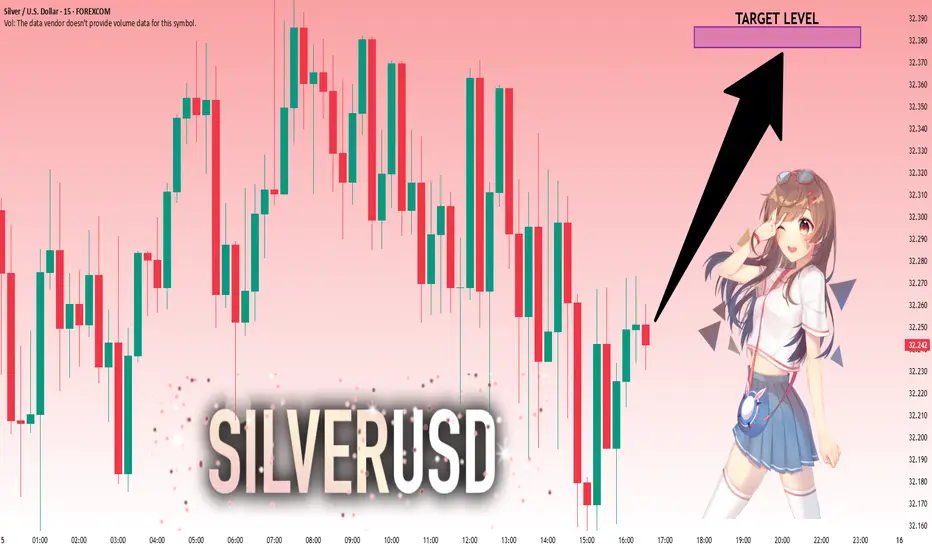
XAGUSD Silver: Navigating Transition from Rally to Correction.Technical Analysis: XAGUSD (Silver)
📈 Silver (XAGUSD) is displaying bullish momentum following a significant rally. The precious metal has pushed into higher territory, creating an overextended condition on the price chart.
💹 Currently trading at a premium level, Silver appears ripe for a potential retracement. This elevated positioning suggests buyers may be exhausting their momentum, creating favorable conditions for a corrective move.
🔄 From a Wyckoff perspective, we're observing a classic distribution pattern with price action ranging sideways after the strong upward move. This horizontal consolidation often precedes a change in direction, as smart money potentially distributes positions to retail traders at these premium levels.
⚠️ Particularly noteworthy is the potential for a spring formation. If price breaks below the current range only to reverse sharply higher, this false breakdown could trap shorts and fuel further upside momentum. Conversely, a decisive break below market structure could confirm distribution is complete.
🎯 Trade Idea: Monitor the 30-minute timeframe for a clear break of market structure to the downside. Such a breakdown following this sideways ranging behavior would align with Wyckoff distribution principles and could signal the beginning of a more substantial correction.
🔍 Entry on confirmation of the breakdown with targets at key support levels would provide a measured approach to capitalizing on the potential reversal from these premium prices.

XAG/USD "The Silver" Metals Market Heist Plan (Scalping/Day)🌟Hi! Hola! Ola! Bonjour! Hallo! Marhaba!🌟
Dear Money Makers & Robbers, 🤑 💰💸✈️
Based on 🔥Thief Trading style technical and fundamental analysis🔥, here is our master plan to heist the XAG/USD "The Silver" Metals Market. Please adhere to the strategy I've outlined in the chart, which emphasizes long entry. Our aim is to escape near the high-risk ATR Zone. Risky level, overbought market, consolidation, trend reversal, trap at the level where traders and bearish robbers are stronger. 🏆💸"Take profit and treat yourself, traders. You deserve it!💪🏆🎉
Entry 📈 : "The heist is on! Wait for the MA breakout (32.800) then make your move - Bullish profits await!"
however I advise to Place Buy stop orders above the Moving average (or) Place buy limit orders within a 15 or 30 minute timeframe most recent or swing, low or high level for Pullback entries.
📌I strongly advise you to set an "alert (Alarm)" on your chart so you can see when the breakout entry occurs.
Stop Loss 🛑: "🔊 Yo, listen up! 🗣️ If you're lookin' to get in on a buy stop order, don't even think about settin' that stop loss till after the breakout 🚀. You feel me? Now, if you're smart, you'll place that stop loss where I told you to 📍, but if you're a rebel, you can put it wherever you like 🤪 - just don't say I didn't warn you ⚠️. You're playin' with fire 🔥, and it's your risk, not mine 👊."
📍 Thief SL placed at the recent/swing low level Using the 2H timeframe (31.700) Day trade basis.
📍 SL is based on your risk of the trade, lot size and how many multiple orders you have to take.
🏴☠️Target 🎯: 33.900 (or) Escape Before the Target
🧲Scalpers, take note 👀 : only scalp on the Long side. If you have a lot of money, you can go straight away; if not, you can join swing traders and carry out the robbery plan. Use trailing SL to safeguard your money 💰.
💰💵💴💸XAG/USD "The Silver" Metals Market Heist Plan (Day / Scalping Trade) is currently experiencing a bullishness🐂.., driven by several key factors.👇👇👇
📰🗞️Get & Read the Fundamental, Macro, COT Report, Quantitative Analysis, Sentimental Outlook, Intermarket Analysis, Future trend targets... go ahead to check 👉👉👉🔗🔗
⚠️Trading Alert : News Releases and Position Management 📰 🗞️ 🚫🚏
As a reminder, news releases can have a significant impact on market prices and volatility. To minimize potential losses and protect your running positions,
we recommend the following:
Avoid taking new trades during news releases
Use trailing stop-loss orders to protect your running positions and lock in profits
💖Supporting our robbery plan 💥Hit the Boost Button💥 will enable us to effortlessly make and steal money 💰💵. Boost the strength of our robbery team. Every day in this market make money with ease by using the Thief Trading Style.🏆💪🤝❤️🎉🚀
I'll see you soon with another heist plan, so stay tuned 🤑🐱👤🤗🤩

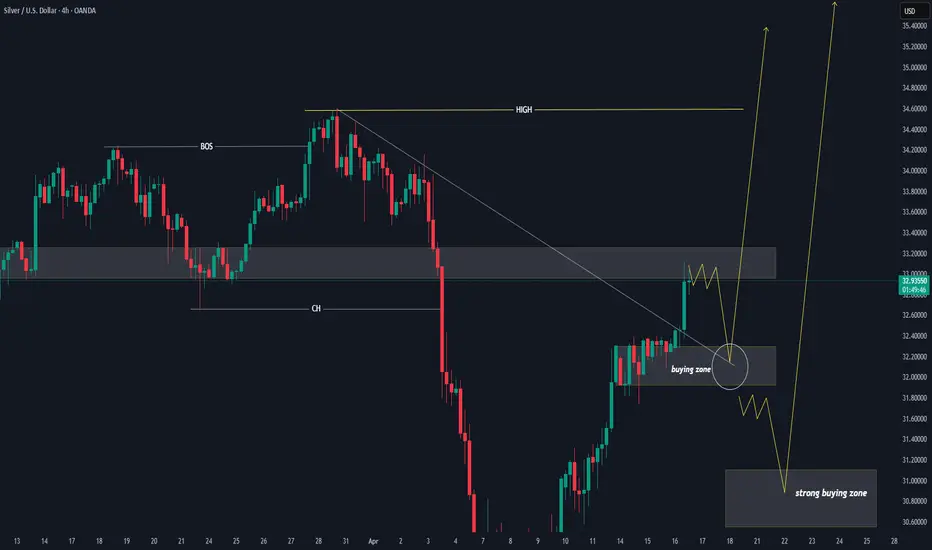
SELVER BUY SETUP 45minute chart analysisChart Observations:
Instrument: Silver (XAGUSD or CFDs on Silver in USD).
Timeframe: 45-minute.
Current price: Around 31.27.
Structure: There's a clear Change of Character (ChoCH) marked, suggesting a potential shift from bearish to bullish market structure.
Entry Zone: Price has returned to a demand zone (marked in blue) and is currently moving upward, which aligns with a bullish setup.
Projection: A bullish move is drawn with targets around 32.1389 and ultimately 33.5000.
Your Key Levels:
Entry Point: Around 31.27 (current market price aligning with structure and breakout).
Stop Loss (SL): Below the demand zone — looks like around 30.50 would be your SL (a bit under the low of the blue demand box).
Final Target (TP): Around 33.50 (as per your arrow projection and marked resistance zone).
Intermediate Target: 32.1389 (where horizontal line is drawn, previous supply zone).
Trade Summary:
Entry: 31.27
Stop Loss: 30.50
Target 1: 32.1389
Final Target: 33.50
Please hit the like button and
Leave a comment to support for My Post!
Your likes and comments are incredibly motivating and will encourage me to share more analysis with you.
Best Regards, JAMES_GOLD_MASTER_MQL5
Thank you.
RRR (Risk-Reward Ratio):
Risk: 31.27 - 30.50 = 0.77
Reward: 33.50 - 31.27 = 2.23
RRR: ≈ 1:2.9 — very solid setup.
