Silver’s short-term momentum is slowing down...Silver’s short-term momentum is slowing down...
Will it have enough juice to crack $40 before August?
🍿🍿🍿
XAGUSD trade ideas

Silver bullish sideways consolidation The Silver remains in a bullish trend, with recent price action showing signs of a continuation breakout within the broader uptrend.
Support Zone: 3686 – a key level from previous consolidation. Price is currently testing or approaching this level.
A bullish rebound from 3686 would confirm ongoing upside momentum, with potential targets at:
3814 – initial resistance
3865 – psychological and structural level
3920 – extended resistance on the longer-term chart
Bearish Scenario:
A confirmed break and daily close below 3686 would weaken the bullish outlook and suggest deeper downside risk toward:
3645 – minor support
3590 – stronger support and potential demand zone
Outlook:
Bullish bias remains intact while the Silver holds above 3686. A sustained break below this level could shift momentum to the downside in the short term.
This communication is for informational purposes only and should not be viewed as any form of recommendation as to a particular course of action or as investment advice. It is not intended as an offer or solicitation for the purchase or sale of any financial instrument or as an official confirmation of any transaction. Opinions, estimates and assumptions expressed herein are made as of the date of this communication and are subject to change without notice. This communication has been prepared based upon information, including market prices, data and other information, believed to be reliable; however, Trade Nation does not warrant its completeness or accuracy. All market prices and market data contained in or attached to this communication are indicative and subject to change without notice.

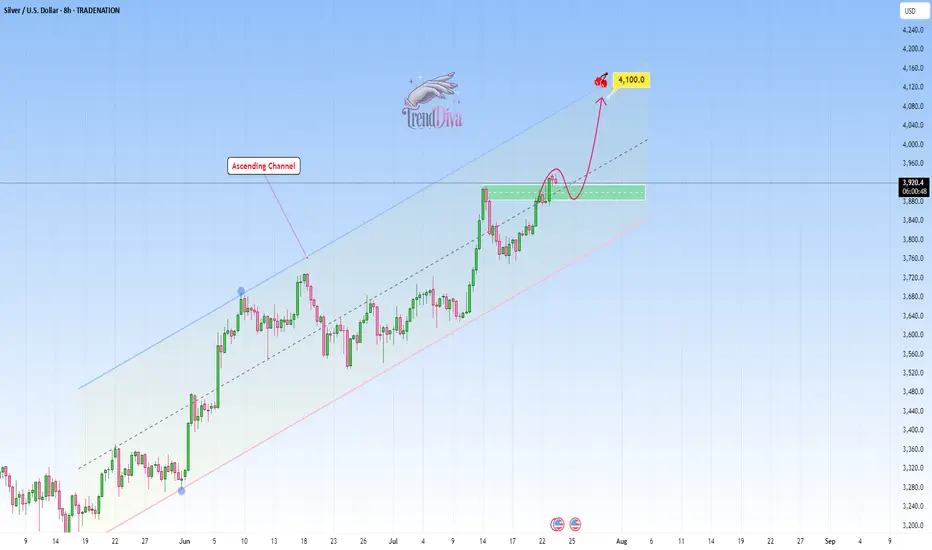
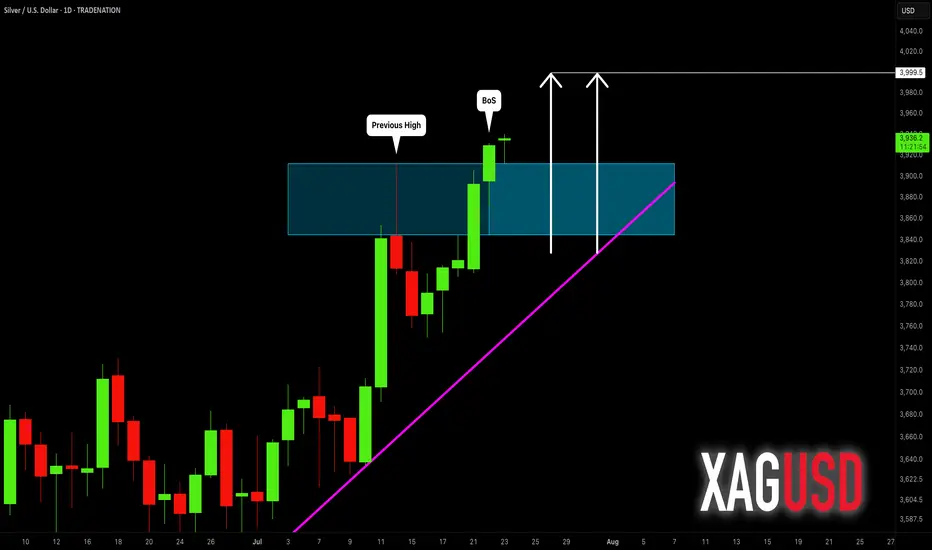
SILVER Analysis - Can buyers push toward 4,100$?TRADENATION:XAGUSD is trading within a clear ascending channel, with price action consistently respecting both the upper and lower boundaries. The recent bullish momentum indicates that buyers are in control, suggesting there's chances for potential continuation on the upside.
The price has recently broken above a key resistance zone and now came back for a retest. If this level holds as support, it would reinforce the bullish structure and increase the likelihood of a move toward the 4,100 target, which aligns with the channel’s upper boundary.
As long as the price remains above this support zone, the bullish outlook stays intact. However, a failure to hold above this level could invalidate the bullish scenario and increase the likelihood of a deeper pullback.
Remember, always confirm your setups and use proper risk management.
Disclosure: I am part of Trade Nation's Influencer program and receive a monthly fee for using their TradingView charts in my analysis.
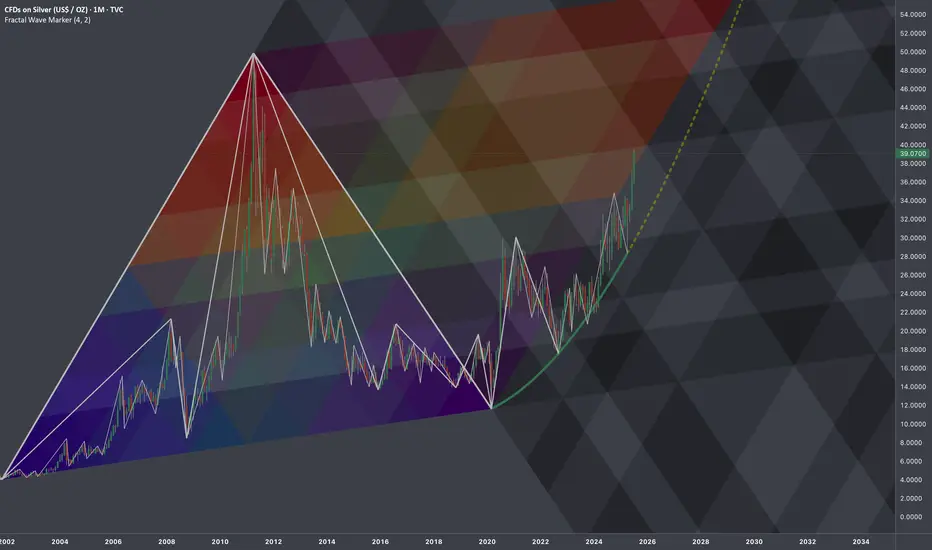
$SILVER: Fractal Geometry (Cycle 2001-2020)Research Notes
Working out probabilistic texture using multiple fibonacci channels on just 3 coordinates of fractal cycle (late 2001 - 2020) on linear scale (on log chart it would still be relevant, so you can switch to view with right click on price scale for selection).
To describe behavior of price and key levels on smaller scale starting from covid we'll use
L-H-L:
Using coordinates to express surface area of broken cycle with fibs mimicking rise, fall and side mapping cycle:
I'd look for patterns of bullish exhaustion only after price crosses the curve.
SILVER Retest of Cup and Handle Neckline📈 XAGUSD Trade Idea – July 25, 2025
Timeframe: 4H
Instrument: Silver / USD (XAGUSD)
Direction: Bullish continuation
Entry Zone: $39.00 - $39.10
Current Price: $39.103
🔍 Technical Analysis:
Cup & Handle Pattern: A clean cup formation is visible from July 15–21, followed by a bullish breakout and minor handle-like retracement.
Retest in Progress: Price is retesting the breakout zone around $39.00, showing consolidation above a strong support structure.
Dynamic Support Confluence: Multiple EMAs (green/orange/red cloud) are acting as support, with recent bullish candles bouncing off the mid-band area.
TD Sequential: A new "7" count signals potential continuation of the trend if support holds.
Volume Gap Below: Clean inefficiency (thin volume) below $38.40–$38.00 which may act as a magnet in case of invalidation, but is also untested demand.
📌 Trade Setup:
Entry: Around $39.00–$39.10 on confirmed support hold
Stop Loss: Below $38.50 (beneath EMA and recent higher low)
Take Profit Zones:
TP1: $39.80 (recent swing high)
TP2: $40.60 (measured move from cup breakout)
TP3: $41.00 psychological round number

XAGUSD--SHORT--rejecting from upper side of channel
--potential downward movement towards horiantal line labeled as TP on the chart

SILVER: Bulls Are Winning! Long!
My dear friends,
Today we will analyse SILVER together☺️
The market is at an inflection zone and price has now reached an area around 39.025 where previous reversals or breakouts have occurred.And a price reaction that we are seeing on multiple timeframes here could signal the next move up so we can enter on confirmation, and target the next key level of 39.148.Stop-loss is recommended beyond the inflection zone.
❤️Sending you lots of Love and Hugs❤️
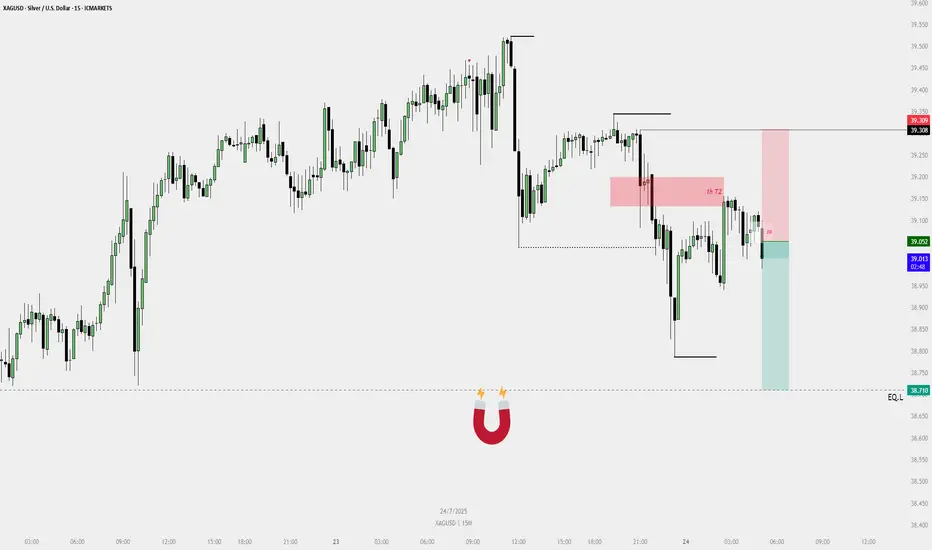
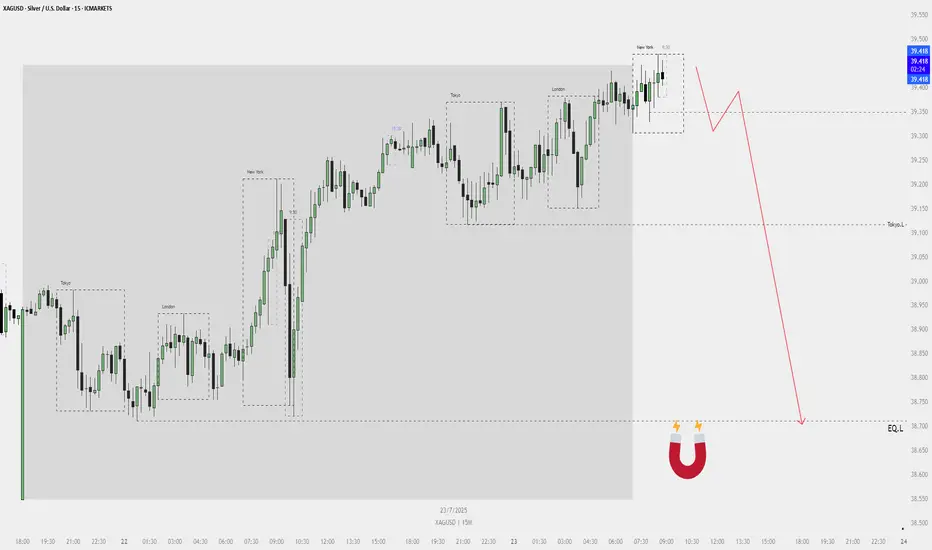
Sell Plan – XAGUSD (15M)🟥 Sell Plan – XAGUSD (15M)
Context:
Price swept liquidity from the previous swing high near the red FVG zone.
Reacted from H1 T2 bearish FVG.
Dealing Range (DR) confirmed in the 15M timeframe.
Bearish FVG formed, followed by a break of internal structure to the downside.
🔻 Trade Narrative:
After sweeping the short-term high, price tapped into the 1H T2 bearish FVG. A bearish fair value gap formed on the 15M chart, leading to the creation of a valid dealing range. Price respected this DR and showed rejection, signaling bearish intent.
⚙️ Confluences:
HTF Bearish FVG tapped (H1 T2).
Internal structure broken after the FVG.
DR formed within HTF POI.
Entry taken below DR after rejection candle.
Liquidity magnet (🧲 icon) marked below, aligning with bearish direction.
🎯 Target:
EQL (Equal Lows) marked at 38.710 – acting as liquidity target.
XAGUSD 23.07.25~+ Pressure on Powell, Waller is dovish
~+ Anticipation of the Trade deals deadline
~+ XAG didn't sell off immediately after the JP trade deal + XAUXAG downward breakout
+ Risk-on general sentiment after Japan trade deal

demand and supply strategiesprice has failed to hold demand, turning demand to supply
now, i plan to sell from supply to major demand, and hoping to goes to plan so for now we wait for confirmation.
if you have an ulterior analysis please drop...

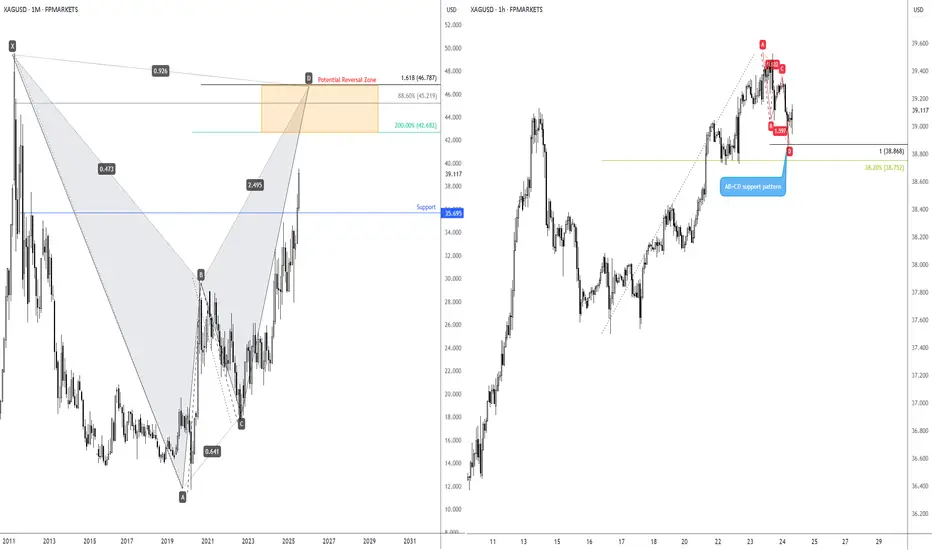
Long-term bullish action on Silver?I touched on the longer-term price action of Spot Silver (XAG/USD) last week, showing that the unit is on track to shake hands with a Potential Reversal Zone (PRZ) of a monthly harmonic bat pattern between US$46.79 and US$42.68.
Keeping things aligned with the harmonic landscape, you will note that H1 price action recently printed an AB=CD bullish pattern at US$38.87 (100% projection ratio), set just north of a 38.2% Fibonacci retracement ratio of US$38.75. While the H1 chart is generally considered short-term in nature, you may find that given we have longer-term flow suggesting scope for additional outperformance, short-term dip-buyers may consider holding a portion of their long positions open in an attempt to catch some of the possible longer-term upside.
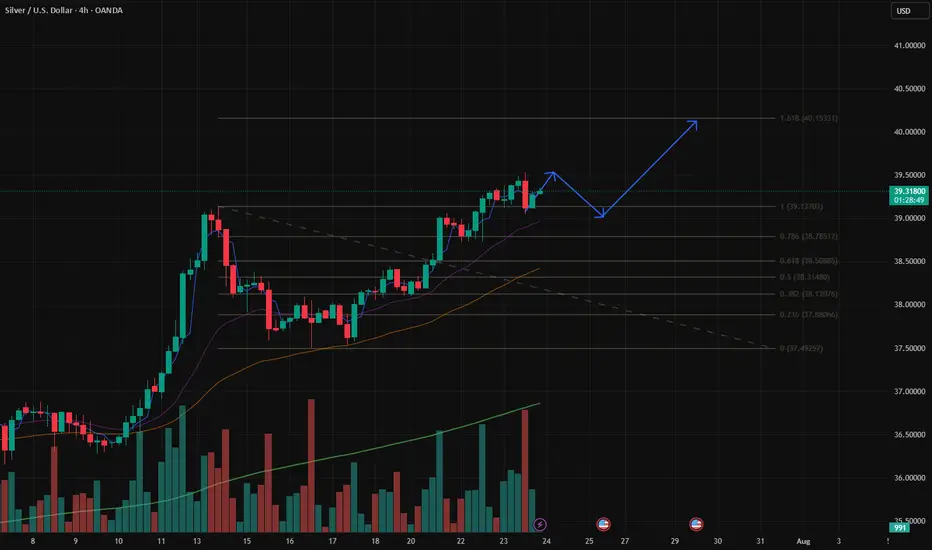
silver seems goes to $40.15 very soonDXY still down-treding.
silver position looks well-aligned with a bullish trend, thanks to technical strength and macro tailwinds. Keep an eye on the $39 support zone— Next upside target $40.15
tradingview.sweetlogin.com
SILVER WILL KEEP GROWING|LONG|
✅SILVER is trading in an
Uptrend and the price made
A retest of the horizontal support
Level of 39.10$ and we are already
Seeing a bullish reaction so we
Are bullish biased and we will be
Expecting a further bullish move up
LONG🚀
✅Like and subscribe to never miss a new idea!✅
Disclosure: I am part of Trade Nation's Influencer program and receive a monthly fee for using their TradingView charts in my analysis.
Bullish Continuation on Silver. 4 Areas To TargetWhen we last visited Silver we were looking at a Bullish Daily Chore opportunity. That opportunity played out nicely and now that we've officially violated the most recent structure high, it should be relatively smooth sailing to our next level of structure from back in 2011.
I say relatively, because the most conservative target area is right above current price, but don't worry, because in this video we'll discuss how there will still be plenty of trading opportunities, even if you choose to wait for a sign after that initial level.
If you have any questions or comments, please leave them below. Also, if you want to share your analysis that's always helpful for the community.
Akil


SILVER: Will Go Down! Short!
My dear friends,
Today we will analyse SILVER together☺️
The price is near a wide key level
and the pair is approaching a significant decision level of 39.520 Therefore, a strong bearish reaction here could determine the next move down.We will watch for a confirmation candle, and then target the next key level of 39.416..Recommend Stop-loss is beyond the current level.
❤️Sending you lots of Love and Hugs❤️
XAGUSD Sell Plan – 15M📉 XAGUSD Sell Plan – 15M
Bias: Bearish
Timeframe: 15-Minute
Date: July 23, 2025
🧠 Reasoning
Liquidity Grab: Price is sweeping short-term highs during New York open.
No More FVGs Above: Price seems to be exhausting upward momentum.
Magnet Below:
Equal lows (EQ_L) acting as a liquidity pool.
Tokyo low also lies below current price — another liquidity target.
High Probability Setup: Clean structure with a likely rejection from current premium zone.
🔴 Sell Strategy (Conceptual)
Wait for a minor liquidity grab or rejection wick to trap buyers.
Confirm a market structure shift or bearish order block.
Sell from that zone aiming for:
🎯 Target 1: Tokyo Low
🎯 Target 2: Equal Lows (Magnet zone)
⚠️ No SL/TP levels shown — trade based on structure and confirmation using your entry system (e.g., 5M DR, bearish FVG, etc.).
So how many times has silver touched or broken $40?So how many times has silver touched or broken $40?
ONLY TWICE !!!
• 1980 – short spike
• 2011 – brief sustained rally
Didn’t end well either time, both marked the end of bull markets.
But this time?
No mania. Just stealth. Silver’s quietly moving up.

SILVER (XAGUSD): Confirmed Break of Structure
Silver updated a year's high yesterday, breaking a strong daily resistance.
With a confirmed Break of Structure BoS, we can expect that
the market will rise even more.
The next strong resistance is 40.
It is a round number based psychological level.
It can be the next goal for the buyers.
❤️Please, support my work with like, thank you!❤️
I am part of Trade Nation's Influencer program and receive a monthly fee for using their TradingView charts in my analysis
Silver Stays Strong on China Growth HopesSilver remained firm around $38.90 per ounce, holding near its highest levels since 2010. A weaker dollar and lower U.S. yields underpinned the metal, while traders await Fed Chair Powell’s comments and trade updates ahead of the August 1 deadline. China’s pledge to boost industrial growth also added to silver’s positive outlook.
Resistance is at $39.50, with support at $37.40.
XAG USD SHORT RESULT Silver price was in a broadening falling wedge which is a bullish pattern, but still took a quick short scalp trade from the set supply zone to the next Order Block and it moved just as Predicted
_THE_KLASSIC_TRADER_.
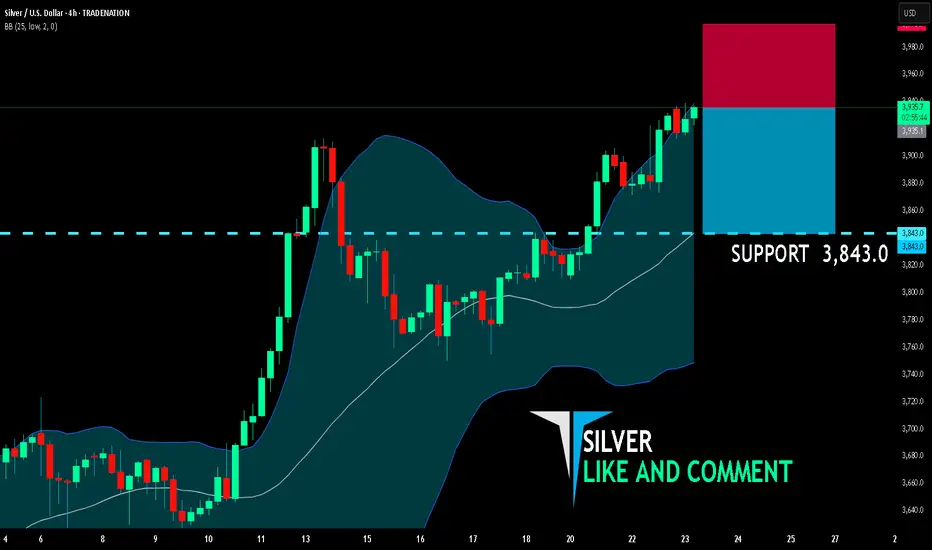
SILVER BEARS ARE GAINING STRENGTH|SHORT
SILVER SIGNAL
Trade Direction: short
Entry Level: 3,935.1
Target Level: 3,843.0
Stop Loss: 3,996.7
RISK PROFILE
Risk level: medium
Suggested risk: 1%
Timeframe: 4h
Disclosure: I am part of Trade Nation's Influencer program and receive a monthly fee for using their TradingView charts in my analysis.
✅LIKE AND COMMENT MY IDEAS✅
Silver H4 | Falling toward a pullback supportSilver (XAG/USD) is falling towards a pullback support and could potentially bounce off this level to climb higher.
Buy entry is at 38.37 which is a pullback support that aligns with the 50% Fibonacci retracement.
Stop loss is at 37.40 which is a level that lies underneath a multi-swing-low support.
Take profit is at 40.12 which is a resistance that aligns with the 161.8% Fibonacci extension.
High Risk Investment Warning
Trading Forex/CFDs on margin carries a high level of risk and may not be suitable for all investors. Leverage can work against you.
Stratos Markets Limited (tradu.com ):
CFDs are complex instruments and come with a high risk of losing money rapidly due to leverage. 66% of retail investor accounts lose money when trading CFDs with this provider. You should consider whether you understand how CFDs work and whether you can afford to take the high risk of losing your money.
Stratos Europe Ltd (tradu.com ):
CFDs are complex instruments and come with a high risk of losing money rapidly due to leverage. 66% of retail investor accounts lose money when trading CFDs with this provider. You should consider whether you understand how CFDs work and whether you can afford to take the high risk of losing your money.
Stratos Global LLC (tradu.com ):
Losses can exceed deposits.
Please be advised that the information presented on TradingView is provided to Tradu (‘Company’, ‘we’) by a third-party provider (‘TFA Global Pte Ltd’). Please be reminded that you are solely responsible for the trading decisions on your account. There is a very high degree of risk involved in trading. Any information and/or content is intended entirely for research, educational and informational purposes only and does not constitute investment or consultation advice or investment strategy. The information is not tailored to the investment needs of any specific person and therefore does not involve a consideration of any of the investment objectives, financial situation or needs of any viewer that may receive it. Kindly also note that past performance is not a reliable indicator of future results. Actual results may differ materially from those anticipated in forward-looking or past performance statements. We assume no liability as to the accuracy or completeness of any of the information and/or content provided herein and the Company cannot be held responsible for any omission, mistake nor for any loss or damage including without limitation to any loss of profit which may arise from reliance on any information supplied by TFA Global Pte Ltd.
The speaker(s) is neither an employee, agent nor representative of Tradu and is therefore acting independently. The opinions given are their own, constitute general market commentary, and do not constitute the opinion or advice of Tradu or any form of personal or investment advice. Tradu neither endorses nor guarantees offerings of third-party speakers, nor is Tradu responsible for the content, veracity or opinions of third-party speakers, presenters or participants.
