Silver updateVery long video but Educative.We are Expecting Gold to Shoot up(Bullish). You can follow us for more Analysis(Images and Videos) with Precise definition of the Financial Market.ENJOY!!!
XAGUSDG trade ideas

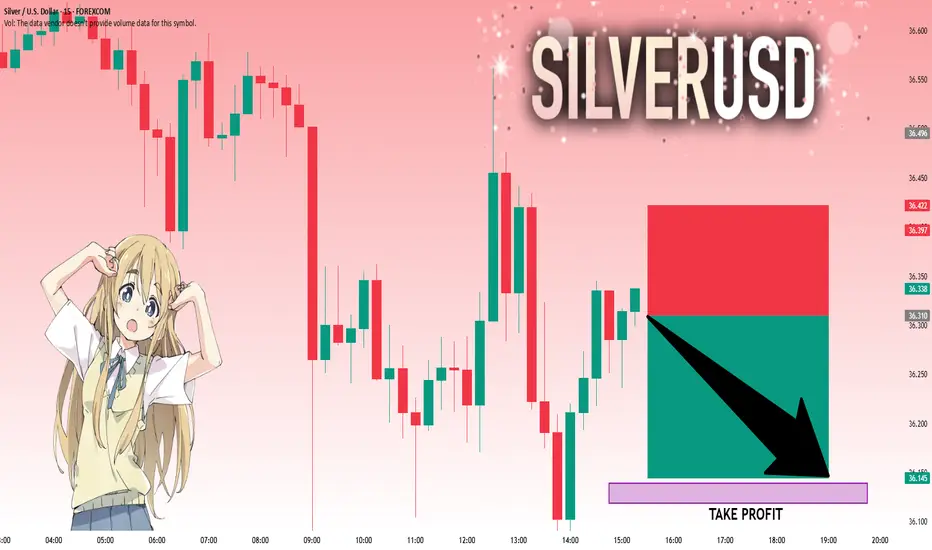
SILVER: Absolute Price Collapse Ahead! Short!
My dear friends,
Today we will analyse SILVER together☺️
The recent price action suggests a shift in mid-term momentum. A break below the current local range around 36.310 will confirm the new direction downwards with the target being the next key level of 36.139.and a reconvened placement of a stop-loss beyond the range.
❤️Sending you lots of Love and Hugs❤️
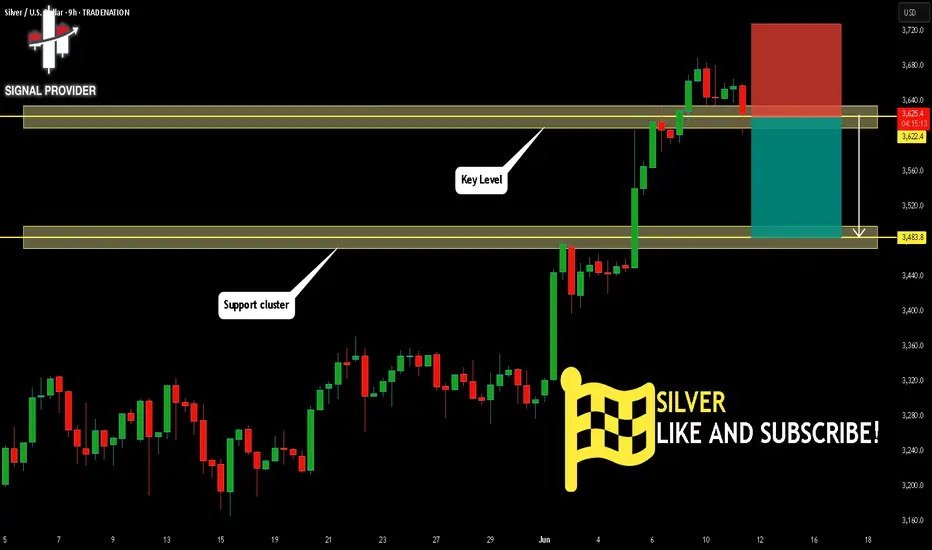
SILVER SENDS CLEAR BEARISH SIGNALS|SHORT
SILVER SIGNAL
Trade Direction: short
Entry Level: 3,640.9
Target Level: 3,428.8
Stop Loss: 3,781.9
RISK PROFILE
Risk level: medium
Suggested risk: 1%
Timeframe: 12h
Disclosure: I am part of Trade Nation's Influencer program and receive a monthly fee for using their TradingView charts in my analysis.
✅LIKE AND COMMENT MY IDEAS✅

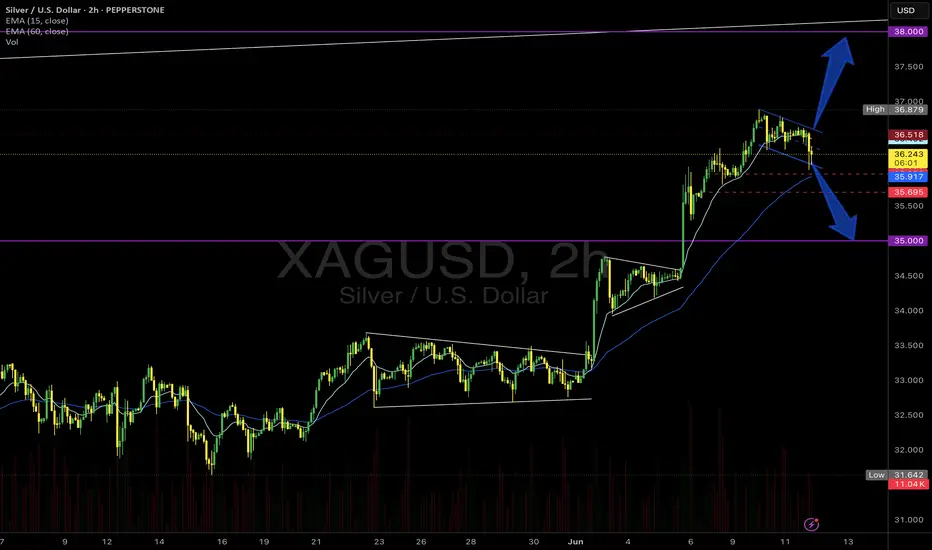
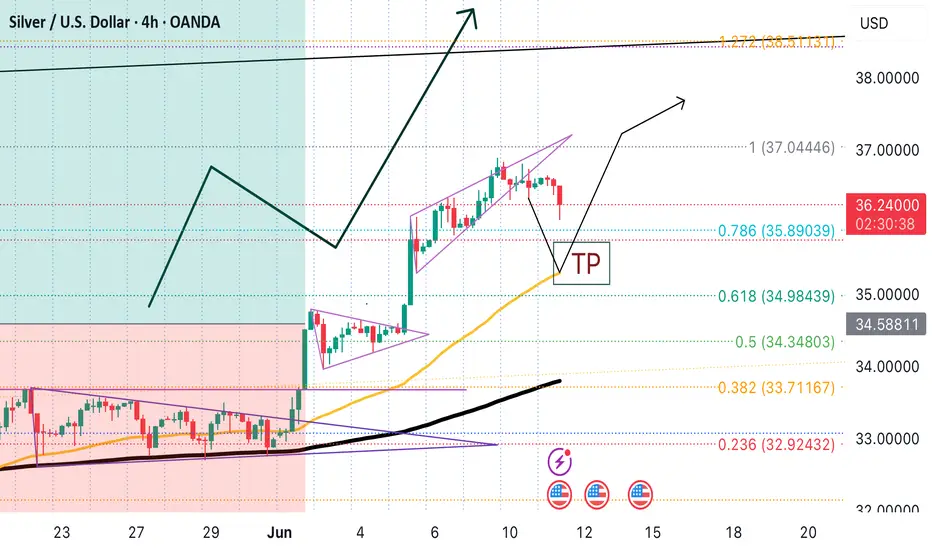
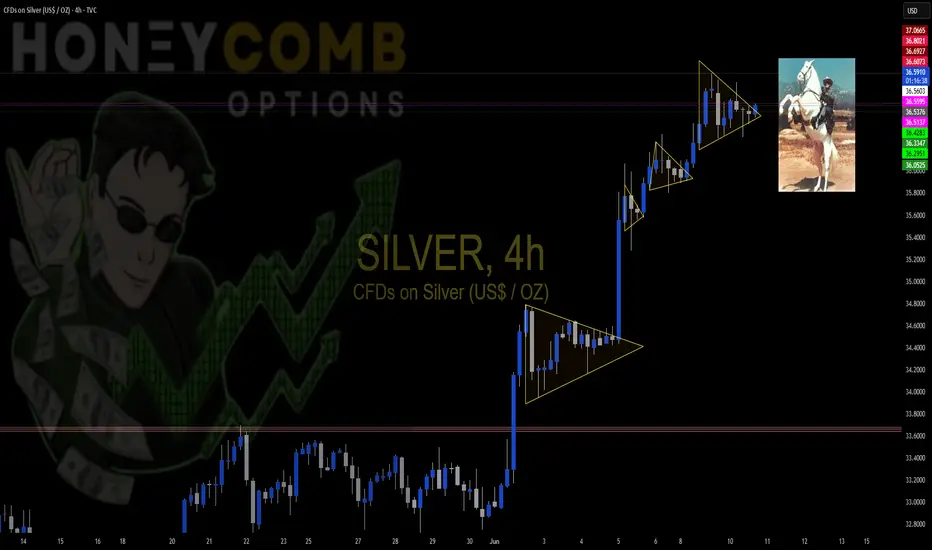
Another Breakout or Correction?📆 June 11, 2025 | ⏱ 2H Chart Analysis
Silver (XAGUSD) has been respecting its bullish momentum since early June, with a clean breakout above the previous wedge consolidation pattern (visible late May). But now, the market is at a critical decision point.
🔍 Key Observations:
Price is testing the 36.50–36.60 zone, which aligns with the 15 EMA and horizontal resistance turned support.
We’ve seen exhaustion signs at recent highs (~36.88), followed by lower highs — possibly forming a micro-descending channel.
Price currently hovers between two key levels:
🔺 Upside target: If bulls defend 36.50, next resistance sits around 38.00, matching the long-term upper channel.
🔻 Downside risk: If support breaks and price falls below 35.90/35.70, we may see a sharp move toward 35.00, where the larger structure would be retested.
📈 Momentum Outlook:
EMA(15) > EMA(60) still shows medium-term bullish structure.
⚖️ Trade Idea (Not Financial Advice)
🟢 Bullish Bias if 36.50 holds with confirmation → Target: 38.00
🔴 Bearish Trigger if 35.90 breaks → Target: 35.00
🎯 Risk Management Key: Wait for price action around the decision zone.
💬 What’s your bias? Do you see a continuation or pullback?
📌 Follow for more XAGUSD, Forex & Commodity insights — 2–3 fresh charts weekly.
#XAGUSD #Silver #Forex #TechnicalAnalysis #TradingSetup #Metals #EMA #BreakoutOrFakeout #PriceAction #tradingview
SILVER Will Go Down! Short!
Take a look at our analysis for SILVER.
Time Frame: 9h
Current Trend: Bearish
Sentiment: Overbought (based on 7-period RSI)
Forecast: Bearish
The market is on a crucial zone of supply 3,622.4.
The oversold market condition in a combination with key structure gives us a relatively strong bullish signal with goal 3,483.8 level.
P.S
Please, note that an oversold/overbought condition can last for a long time, and therefore being oversold/overbought doesn't mean a price rally will come soon, or at all.
Disclosure: I am part of Trade Nation's Influencer program and receive a monthly fee for using their TradingView charts in my analysis.
Like and subscribe and comment my ideas if you enjoy them!
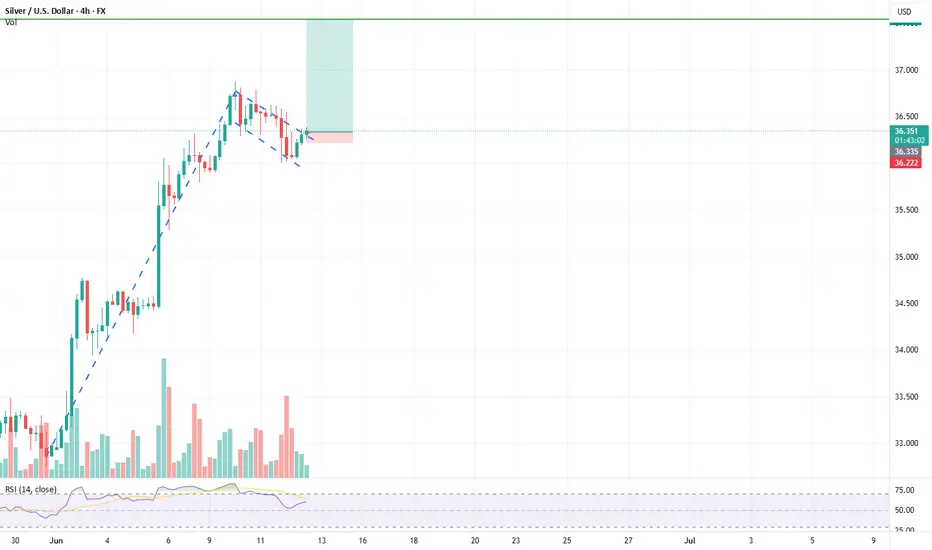
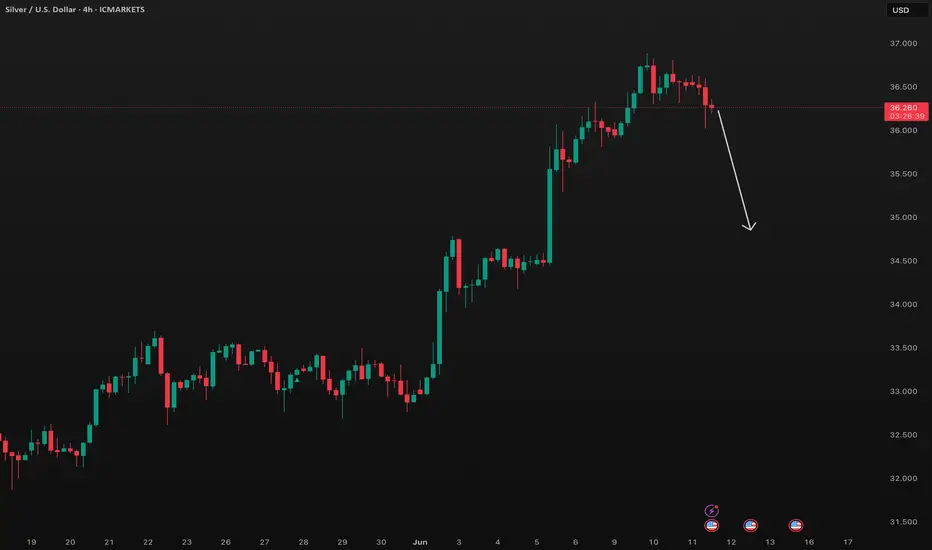
XAGUSD (SILVER) TRADE PLANTactical Plan – XAG/USD (as of $36.46)
🧠 Bias:
🔻 Short-Term Bearish due to:
Evening Star Doji on 4H
Parabolic rally exhaustion
Weakening momentum into resistance
📋 TRADE PLAN (SWING SETUP)
Parameter Entry / Target
Entry Sell on break below $36.30 (confirmation candle close below it)
Stop Loss (SL) Above high of the Evening Star: $36.88
TP1 (short-term) $35.85 (1:1 RR)
TP2 (core target) $34.95
TP3 (extended) $33.80 (if trend fully unwinds)
🧮 Position Sizing & Risk
Aim for 2R or more
Size down if volatility spikes or CPI/FOMC
events are near (June macro data may distort flows)
🔁 Alternative Scenario
Condition Action
Price closes above $37.00 Invalidate shorts, flip bias to bullish
Price holds $36.30–$36.00 No trade (chop zone), wait for clean break
🔄 TRADE MANAGEMENT
Trail stop once TP1 is hit
Add to position only if price breaks $35.50 with volume
🧠 RISK CONTEXT: What Would Trigger a Bigger Drop?
USD strength (watch DXY reclaim 105+)
Risk-off sentiment (bond yields up, equities fall)
Any signs of Fed hawkish surprise this week
🎯 Summary of the Play
“If $36.30 fails to hold, I'm short to $35.00. If $36.00 breaks, it's a deeper unwind to $34.00. But if bulls push through $37, I’m out immediately — trend resumes upward.”
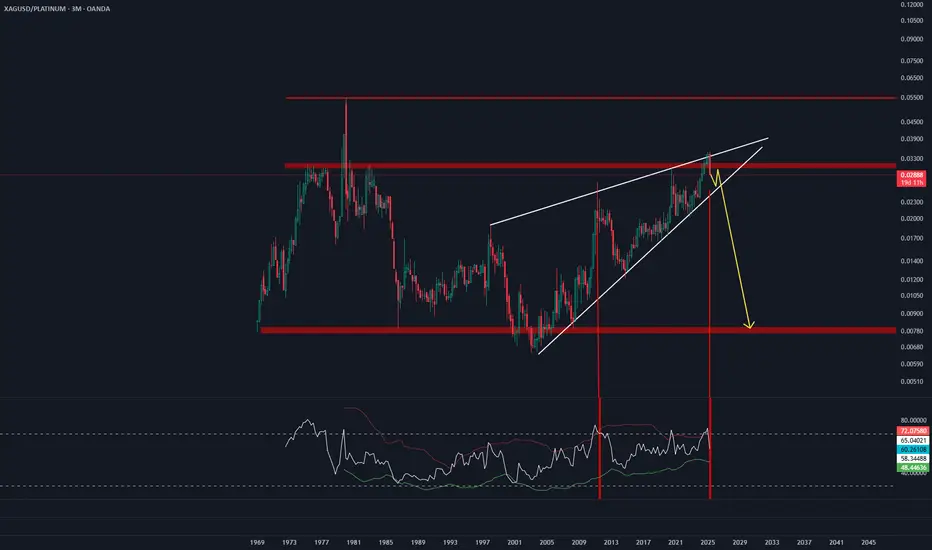
Silver UP but PLATINIUM MOREHello there, good ? Me Yes.
Silver vs Platinium.
So we have a silver momentum against gold. But more than this, we have a platinium momentum against silver.
Platinium against silver is historically high.
So we need a reset.
The move is probably go at the bottom (x4 against silver). So, if Silver make a x5, plaitnium make a x20.
We have also a beautiful bearish pattern (white lines). For a safety capital rotation, go on platinium when the white line is break.
Indicator show us a reversal in 3M...
Look platinium chart (15 years of consolidation).
I recommend a big caution about Stocks. When commodities rises, it's not good.
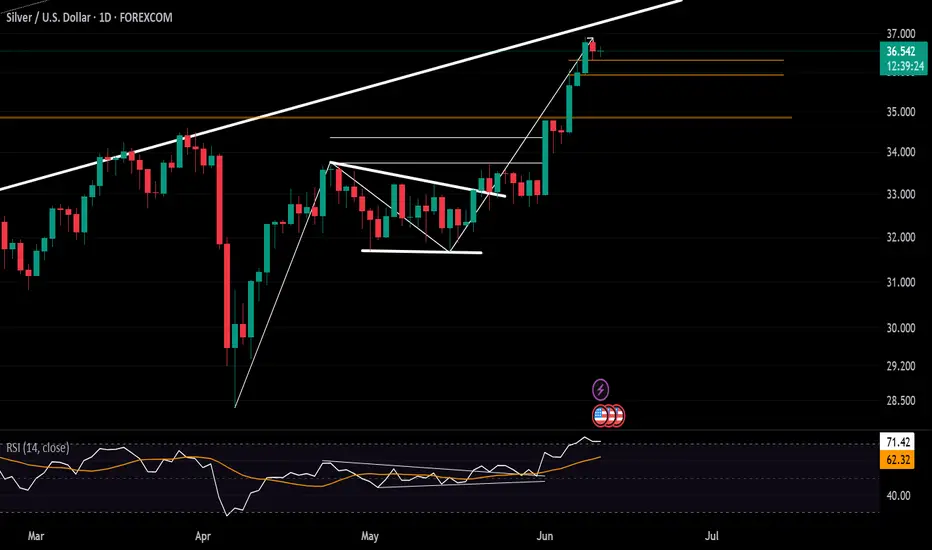
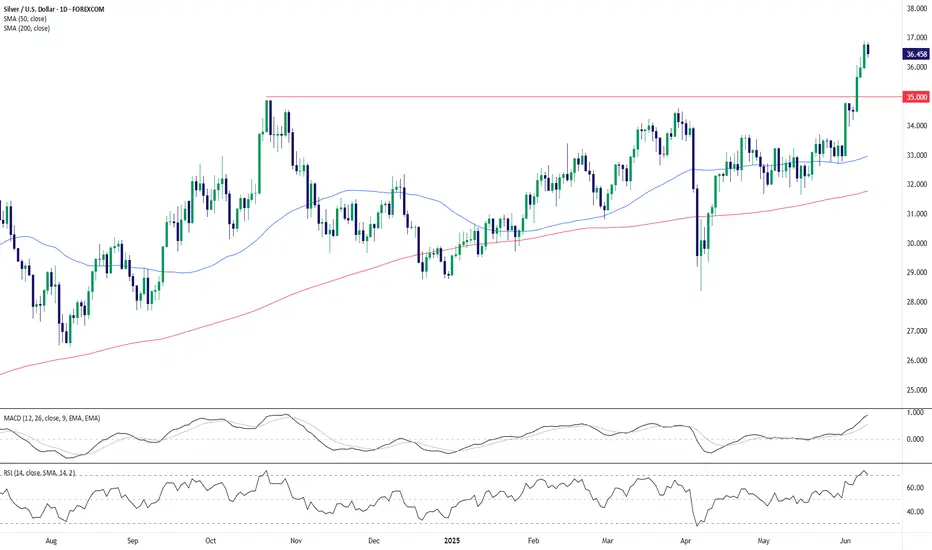
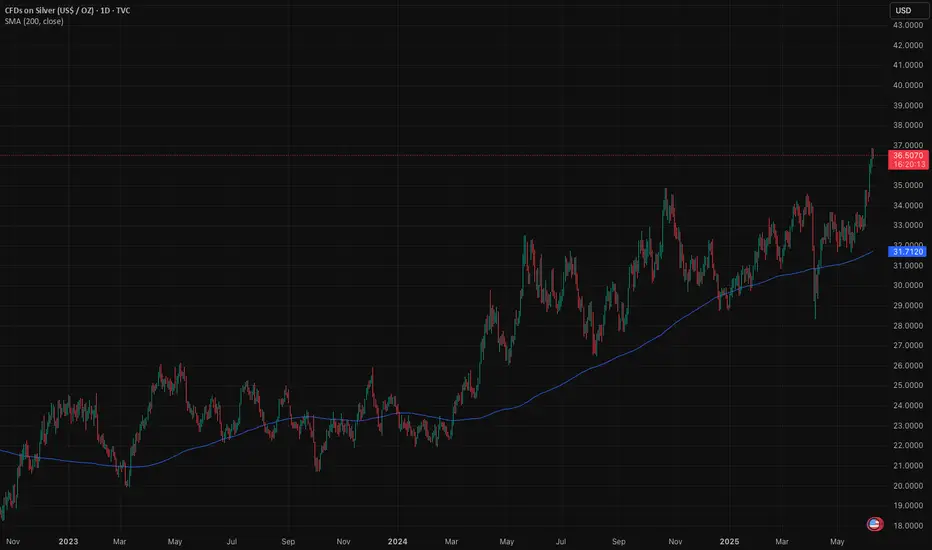
Silver Holds Near 13-Year HighsSilver has surged past the $36.40 per ounce mark, reaching its highest level in 13 years after a clean breakout from a one-month consolidation phase spanning April and May 2025. The breakout targets the $37 level and aligns with a rising channel defined by higher lows since February 2024.
If silver retraces below $36, potential support levels include $35.70, $35.30, and $34.70, which may offer a base for consolidation or a recharge before continuation of the broader uptrend. A sustained hold above $37.30 could open the path toward the $40 level, further validating a larger inverted head and shoulders pattern on the monthly chart.
Are we on track to revisit 2011 highs in 2025?
- Razan Hilal, CMT
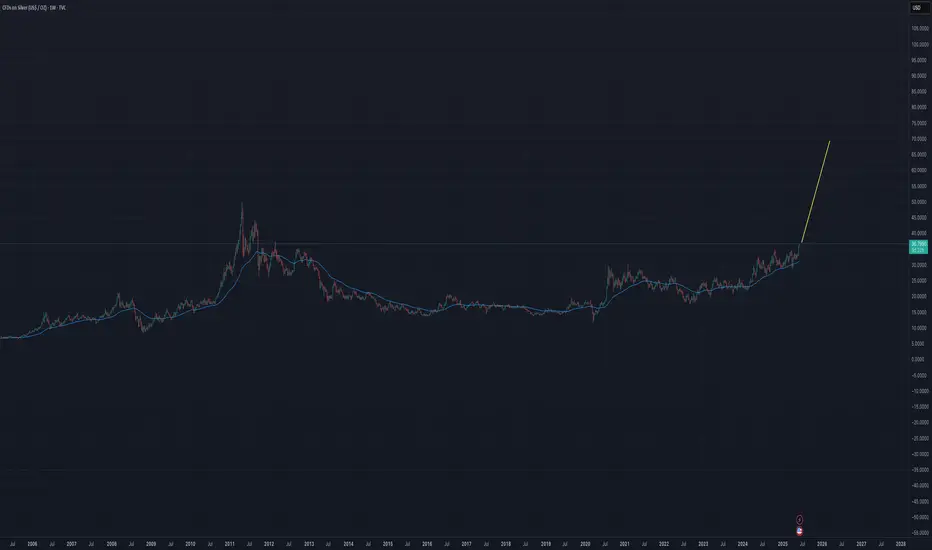
Silver possibly $53 by end of July, $70 by Dec & $300 long termSilver possibly $53 by end of July & $70 by Dec. Buy & hold... live changing moment in once every 25 yrs Silver overshoot.
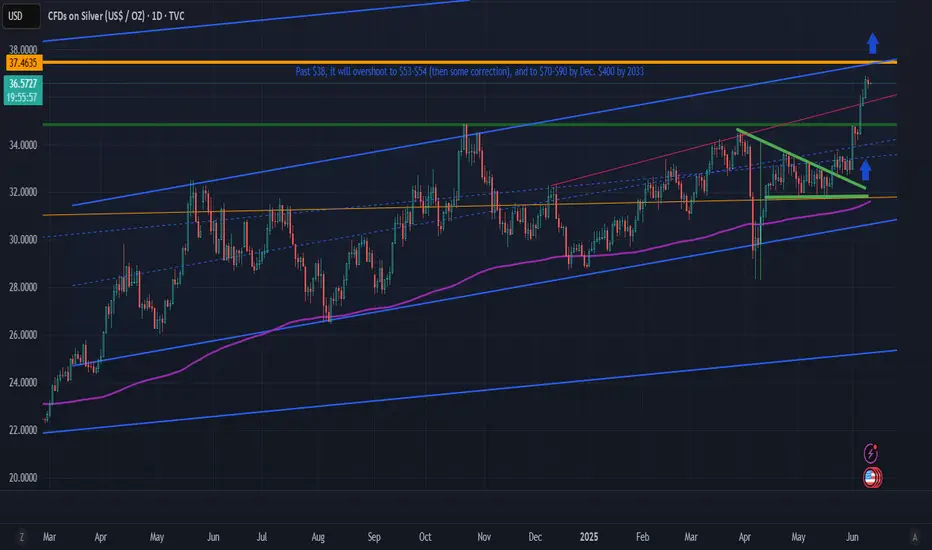
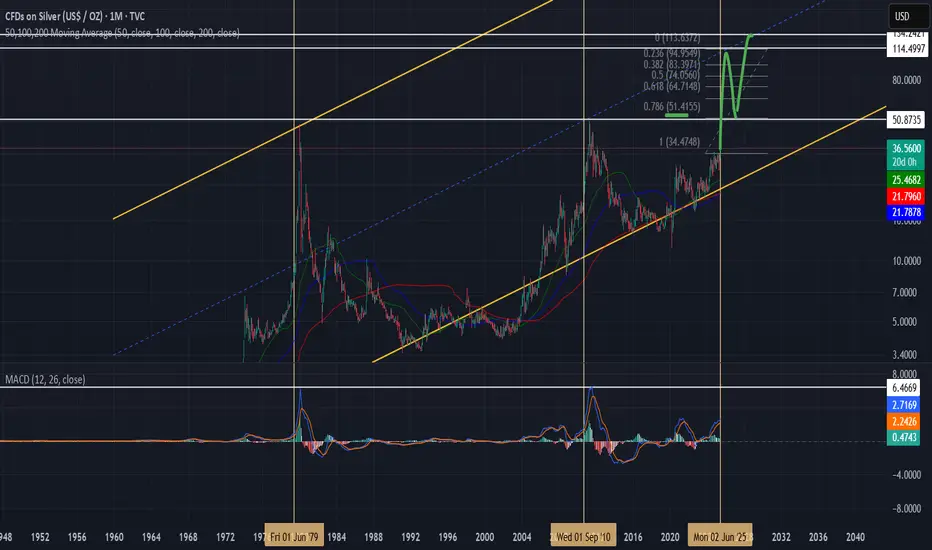
Silver about to EXPLODE?If we go and hit the mid range of this channel $114, consistent with the peak in 2011 and the peak in 1974 and 1983, then a 0.71 Fib pullback lands us with support EXACTLY on the $50 historical resistance. Fib extending this gain and pullback from this breakout gives a target of $134!
Just some technical speculation.
After these blow-off-tops, we can expect a multi-year bear cycle (8-9 years) to some 20% below the 200 week MA, or the bottom of the channel. So potentially back to $35 range in 2035? Or is this time different?
Chat GPT states:
Phase 3: $134.24 Fibonacci Expansion
This is not an arbitrary number. It aligns with:
1.618 extension of the previous full range
Long-term silver:gdp/M2 parity when adjusted for gold performance
Top of the upper channel (log scale)
In real terms, this would still be undervalued compared to historical benchmarks like:
1700s–1800s England/France, where 1 oz silver bought 1 day’s skilled wage ($200–300 today)
1930s–1960s U.S. silver dime could buy a gallon of petrol — still ~$3.50 today = ~$50–70/oz minimum utility parity
Why $134 Is Not an Irrational Target
Historical + Monetary Convergence:
Metric Value Needed for Silver
Gold at $3,400, 25:1 Ratio $136
M2 Parity (Silver:M2 = 1:160B) $130–140
ShadowStats Inflation Adj. 1980 $134–150
Industrial Demand Scaling (2025–2030) $100+ minimum
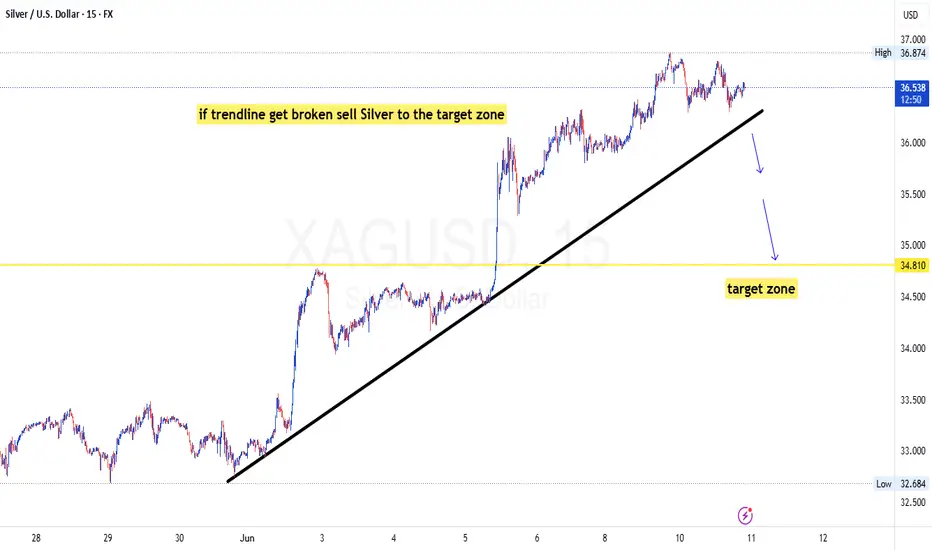
Possible Bearish Idea on SilverSilver seems overbought on the daily timeframe and on the 15 mins we can see a bearish breakout forming, if trendline get broken sell Silver to the target zone around 34.800
SILVER: Strong Bullish Sentiment! Long!
My dear friends,
Today we will analyse SILVER together☺️
The price is near a wide key level
and the pair is approaching a significant decision level of 36.496 Therefore, a strong bullish reaction here could determine the next move up.We will watch for a confirmation candle, and then target the next key level of 36.646.Recommend Stop-loss is beyond the current level.
❤️Sending you lots of Love and Hugs❤️

Silver Bulls Breach Key Resistance – Momentum BuildsSilver (XAG/USD) has punched through a major horizontal resistance level around the psychological $35.00 mark, marking a significant technical breakout with bullish continuation potential.
🔍 Technical Highlights
Breakout Above Multi-Month Resistance: Price has cleanly broken above the key $35.00 zone, which had capped upside since late 2023. The breakout follows a tight consolidation range, suggesting a measured accumulation phase has ended.
Moving Averages Aligned Bullishly:
The 50-day SMA is rising sharply and sits well above the 200-day SMA.
Price is comfortably trading above both averages, confirming a strong uptrend structure.
MACD in Strong Positive Territory: MACD has surged above its signal line, reinforcing bullish momentum. No signs of a bearish crossover in sight.
RSI Enters Overbought Zone: RSI is currently near 70. While this signals strong momentum, it also raises the potential for short-term cooling or consolidation before any continued leg higher.
⚙️ Outlook
The breakout above $35.00 represents a major bullish development, potentially opening the door to further upside exploration. The impulsive nature of recent gains, combined with rising momentum indicators and trend-confirming moving averages, all favor the bulls. However, the overbought RSI suggests the possibility of a short-term pullback or sideways consolidation before the next move higher.
Traders may want to monitor for a potential retest of the $35.00 area as support, which could offer a higher-probability continuation setup within the broader uptrend.
-MW
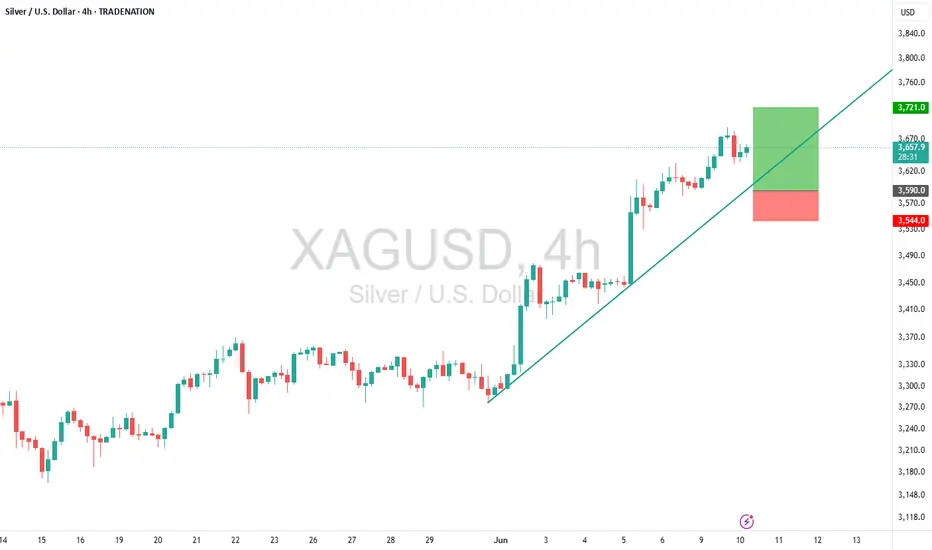
Silver (XAGUSD) – Buy the Dip Toward Bespoke SupportTrade Idea
Type: Buy Limit
Entry: 3590
Target: 3721
Stop Loss: 3544
Duration: Intraday
Expires: 11/06/2025 06:00
Technical Overview
Despite signs of a short-term top forming, the overall bias has turned positive, suggesting any downside may be corrective.
Price is expected to pull back into bespoke support at 3590, providing a low-risk opportunity to rejoin the broader bullish move.
The setup aligns with a buy-the-dip strategy, targeting a retest of resistance at 3721.
Additional confirmation would come from a hold above 3630, reinforcing the short-term bullish outlook.
Disclosure: I am part of Trade Nation's Influencer program and receive a monthly fee for using their TradingView charts in my analysis.
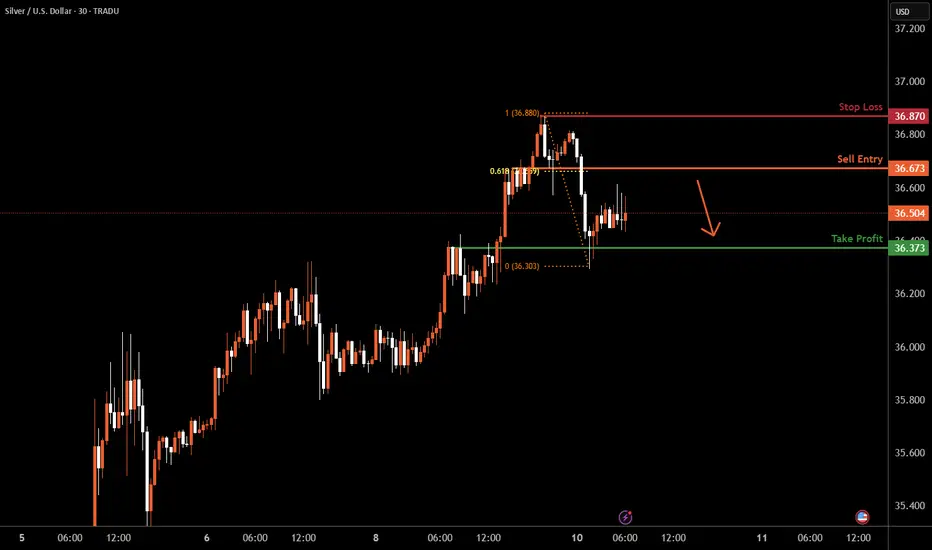
XAGUSD H1 I Bearish Reversal off the 61.8% FibBased on the H1 chart, the price is approaching our sell entry level at 36.87, a pullback resistance that aligns with the 61.8% Fib retracement.
Our take profit is set at 36.37, an overlap support.
The stop loss is set at 36.87, a swing high resistance.
High Risk Investment Warning
Trading Forex/CFDs on margin carries a high level of risk and may not be suitable for all investors. Leverage can work against you.
Stratos Markets Limited (tradu.com ):
CFDs are complex instruments and come with a high risk of losing money rapidly due to leverage. 63% of retail investor accounts lose money when trading CFDs with this provider. You should consider whether you understand how CFDs work and whether you can afford to take the high risk of losing your money.
Stratos Europe Ltd (tradu.com ):
CFDs are complex instruments and come with a high risk of losing money rapidly due to leverage. 63% of retail investor accounts lose money when trading CFDs with this provider. You should consider whether you understand how CFDs work and whether you can afford to take the high risk of losing your money.
Stratos Global LLC (tradu.com ):
Losses can exceed deposits.
Please be advised that the information presented on TradingView is provided to Tradu (‘Company’, ‘we’) by a third-party provider (‘TFA Global Pte Ltd’). Please be reminded that you are solely responsible for the trading decisions on your account. There is a very high degree of risk involved in trading. Any information and/or content is intended entirely for research, educational and informational purposes only and does not constitute investment or consultation advice or investment strategy. The information is not tailored to the investment needs of any specific person and therefore does not involve a consideration of any of the investment objectives, financial situation or needs of any viewer that may receive it. Kindly also note that past performance is not a reliable indicator of future results. Actual results may differ materially from those anticipated in forward-looking or past performance statements. We assume no liability as to the accuracy or completeness of any of the information and/or content provided herein and the Company cannot be held responsible for any omission, mistake nor for any loss or damage including without limitation to any loss of profit which may arise from reliance on any information supplied by TFA Global Pte Ltd.
The speaker(s) is neither an employee, agent nor representative of Tradu and is therefore acting independently. The opinions given are their own, constitute general market commentary, and do not constitute the opinion or advice of Tradu or any form of personal or investment advice. Tradu neither endorses nor guarantees offerings of third-party speakers, nor is Tradu responsible for the content, veracity or opinions of third-party speakers, presenters or participants.
Precious metals: rotation towards silver, platinum and palladium1) GOLD, a mature bull cycle running out of technical steam
For over a year, gold (XAU/USD) has been the undisputed leader of the precious metals segment, driven by a powerful cocktail of technical and macroeconomic factors. Long-term bullish targets, identified via an Elliott wave reading, have now been reached or are very close to being reached, suggesting a possible end to the cycle. Gold's outperformance has been driven by several factors: an annual depreciation of the US dollar, robust physical demand in China and India, a rush by central banks to use gold as a strategic reserve, and increased financial demand via ETFs and futures markets. Nevertheless, this momentum may now be running out of “fuel” as the greenback approaches a technical crossroads, US interest rates stabilize, and the geopolitical environment remains uncertain but largely taken on board by the markets.
2) Silver, platinum and palladium lag far behind gold
While gold's bullish cycle appears to be coming to an end, investors are turning their attention to the other precious metals - silver, platinum and palladium - which are lagging significantly behind. This is partly due to their hybrid nature: halfway between industrial asset and safe-haven, they have not enjoyed the same enthusiasm as gold during periods of sheer financial uncertainty. However, the situation seems to be changing: the first stages of a technical catch-up can be observed, notably in silver (XAG), whose recent performance has outstripped that of gold. This comeback is supported by an optimistic reading of COT (Commitment of Traders) data, showing a reconstitution of long positions. Upside potential remains intact in the short to medium term, supported by industrial fundamentals and converging technical signals.
3) Are platinum and palladium technical opportunities or not?
Platinum (XPT) and palladium (XPD), long lagging behind, are now entering a recovery phase. These metals, widely used in automotive catalysts, have suffered from the energy transition and the decline in internal combustion engines. However, this weakness seems to have been overplayed by the markets. From a technical point of view, the current configurations suggest opportunities for a rebound. All the more so as certain players are beginning to recognize the role these metals could play in industrial value chains linked to hydrogen and clean mobility. If gold is reaching the top of the cycle, it is potentially in these “lagging” metals that the bullish leverage now lies for the months ahead.
4) The special case of copper
Last but not least, copper (XCU), although not considered a precious metal in the strict sense, deserves special attention. A true thermometer of the global economy, it has long been held back by uncertainties over Chinese growth and structural difficulties in Asia's real estate sector. But here too, the scenario seems to be changing: the gradual recovery in industrial demand, coupled with structural tensions on supply, is paving the way for a bullish phase. Copper thus represents a bridge between industrial metals and speculative dynamics, an asset in a context of accelerated energy transition. In short, while gold remains a strategic pillar, the next big move could well come from a generalized catch-up of all the metals that have lagged behind.
DISCLAIMER:
This content is intended for individuals who are familiar with financial markets and instruments and is for information purposes only. The presented idea (including market commentary, market data and observations) is not a work product of any research department of Swissquote or its affiliates. This material is intended to highlight market action and does not constitute investment, legal or tax advice. If you are a retail investor or lack experience in trading complex financial products, it is advisable to seek professional advice from licensed advisor before making any financial decisions.
This content is not intended to manipulate the market or encourage any specific financial behavior.
Swissquote makes no representation or warranty as to the quality, completeness, accuracy, comprehensiveness or non-infringement of such content. The views expressed are those of the consultant and are provided for educational purposes only. Any information provided relating to a product or market should not be construed as recommending an investment strategy or transaction. Past performance is not a guarantee of future results.
Swissquote and its employees and representatives shall in no event be held liable for any damages or losses arising directly or indirectly from decisions made on the basis of this content.
The use of any third-party brands or trademarks is for information only and does not imply endorsement by Swissquote, or that the trademark owner has authorised Swissquote to promote its products or services.
Swissquote is the marketing brand for the activities of Swissquote Bank Ltd (Switzerland) regulated by FINMA, Swissquote Capital Markets Limited regulated by CySEC (Cyprus), Swissquote Bank Europe SA (Luxembourg) regulated by the CSSF, Swissquote Ltd (UK) regulated by the FCA, Swissquote Financial Services (Malta) Ltd regulated by the Malta Financial Services Authority, Swissquote MEA Ltd. (UAE) regulated by the Dubai Financial Services Authority, Swissquote Pte Ltd (Singapore) regulated by the Monetary Authority of Singapore, Swissquote Asia Limited (Hong Kong) licensed by the Hong Kong Securities and Futures Commission (SFC) and Swissquote South Africa (Pty) Ltd supervised by the FSCA.
Products and services of Swissquote are only intended for those permitted to receive them under local law.
All investments carry a degree of risk. The risk of loss in trading or holding financial instruments can be substantial. The value of financial instruments, including but not limited to stocks, bonds, cryptocurrencies, and other assets, can fluctuate both upwards and downwards. There is a significant risk of financial loss when buying, selling, holding, staking, or investing in these instruments. SQBE makes no recommendations regarding any specific investment, transaction, or the use of any particular investment strategy.
CFDs are complex instruments and come with a high risk of losing money rapidly due to leverage. The vast majority of retail client accounts suffer capital losses when trading in CFDs. You should consider whether you understand how CFDs work and whether you can afford to take the high risk of losing your money.
Digital Assets are unregulated in most countries and consumer protection rules may not apply. As highly volatile speculative investments, Digital Assets are not suitable for investors without a high-risk tolerance. Make sure you understand each Digital Asset before you trade.
Cryptocurrencies are not considered legal tender in some jurisdictions and are subject to regulatory uncertainties.
The use of Internet-based systems can involve high risks, including, but not limited to, fraud, cyber-attacks, network and communication failures, as well as identity theft and phishing attacks related to crypto-assets.
Silver surge has more bullish upsideSilver is breaking out. Its strength is no accident. The US is running a structural deficit north of 6% of GDP in a full-employment economy. The bond market has absorbed the pain so far, but pressure is building. Investors are starting to look for insurance. Silver is one of the cleanest ways to play the dollar’s long-term debasement.
The metal is trading well above its 200-day moving average. The US$31.50-32.00 zone now acts as solid support. Any pullback into that range is likely to be short-lived.
Silver doesn’t move in straight lines. It runs, consolidates, then runs again, usually in 50–90 day cycles. The current setup fits that rhythm.
The gold-to-silver ratio is still near 100x. Historically, the average is closer to 60-70x. That gives silver more room to catch up. Traders can short gold and go long silver to play that mean reversion. Or simply buy silver outright and short the dollar. ETF inflows into silver have picked up, showing broader market interest.
The main risk? A sudden shift in Fed tone or falling inflation expectations. But that seems unlikely near term.
Silver isn’t just a trade. It’s a message. A hedge against fiscal irresponsibility and the cost of kicking the can too far.
XAUUSD/BTC / USDJPY forecast 10/06/2025XAUUSD Forecast | VSA & Trend Line Analysis | Gold Price Prediction
In this video, I share my detailed forecast for XAUUSD (Gold vs. USD) using Volume Spread Analysis (VSA) and trend line strategies. Watch as I break down the market structure, identify key levels, and explain the logic behind potential moves in gold.

Update on Silver's march to $40.Update on Silver's march to $40.
Yes, there will eventually be a correction..
this rising support line needs to hold for higher up targets to be reached
