#XAI/USDT#XAI
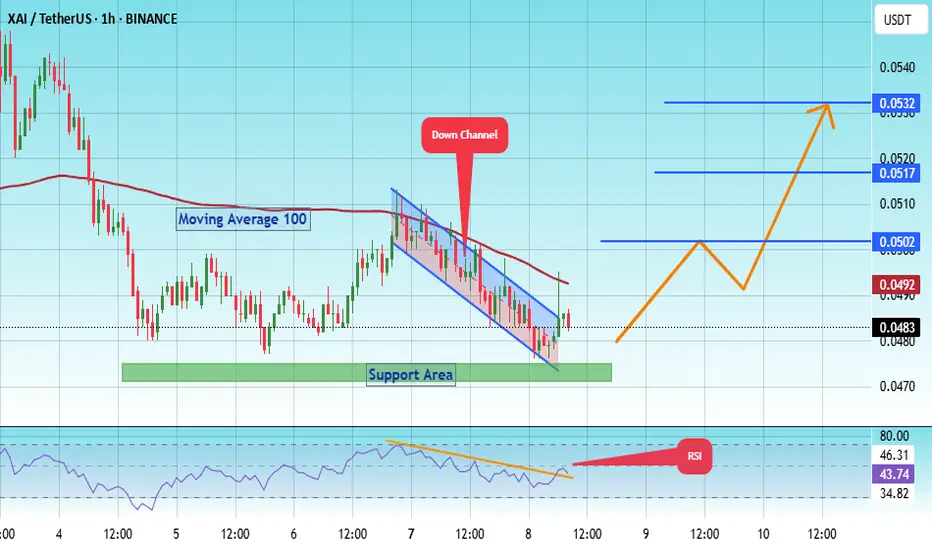
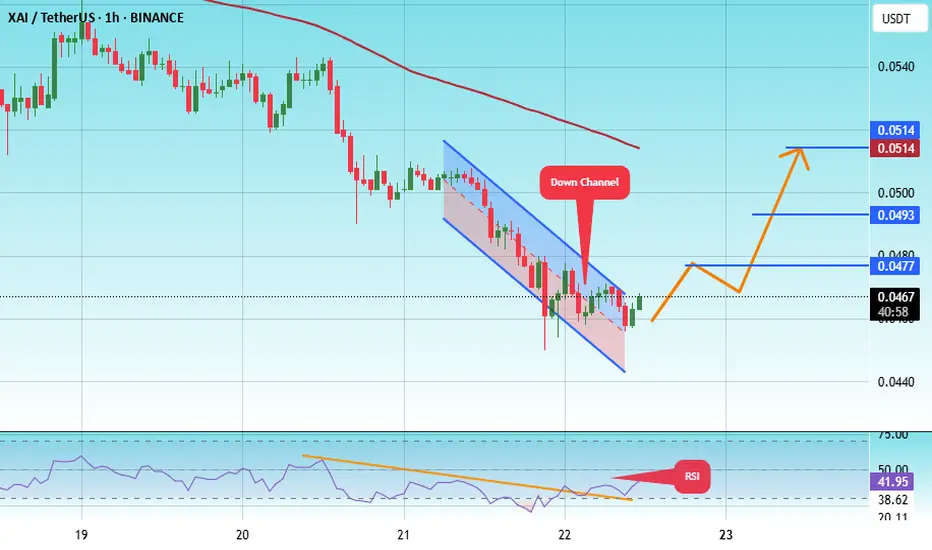
The price is moving within a descending channel on the 1-hour frame, adhering well to it, and is on its way to breaking it strongly upwards and retesting it.
We have a bounce from the lower boundary of the descending channel. This support is at 0.0476.
We have a downtrend on the RSI indicato
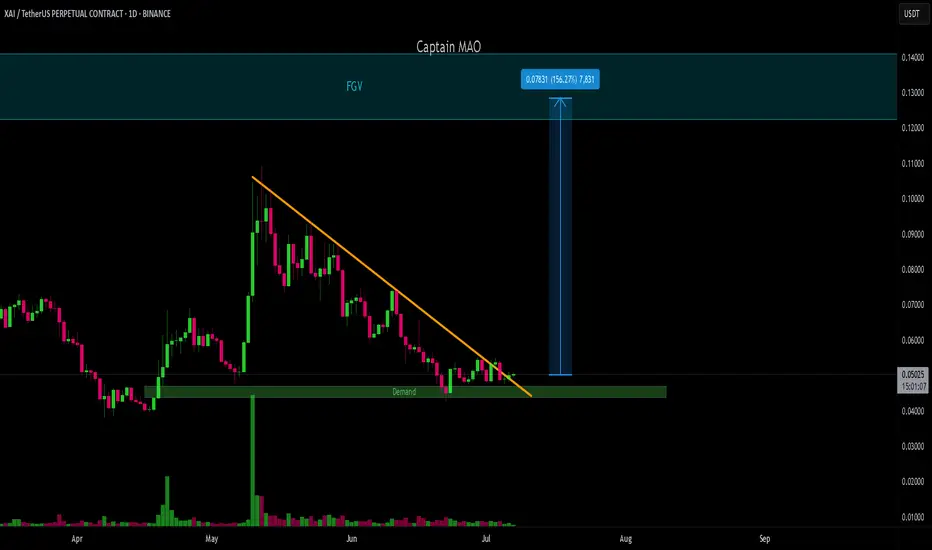
XAI/USDT Breakout XAI has completed a 60% retracement back to a key demand zone on the daily timeframe. Price action shows a clean breakout from the downtrend line, followed by a successful retest a classic confirmation of reversal structure.
with a potential upside move of +150% from current levels.
#XAI #XAIUSDT
XAI breakout Buy breakout, #XAI
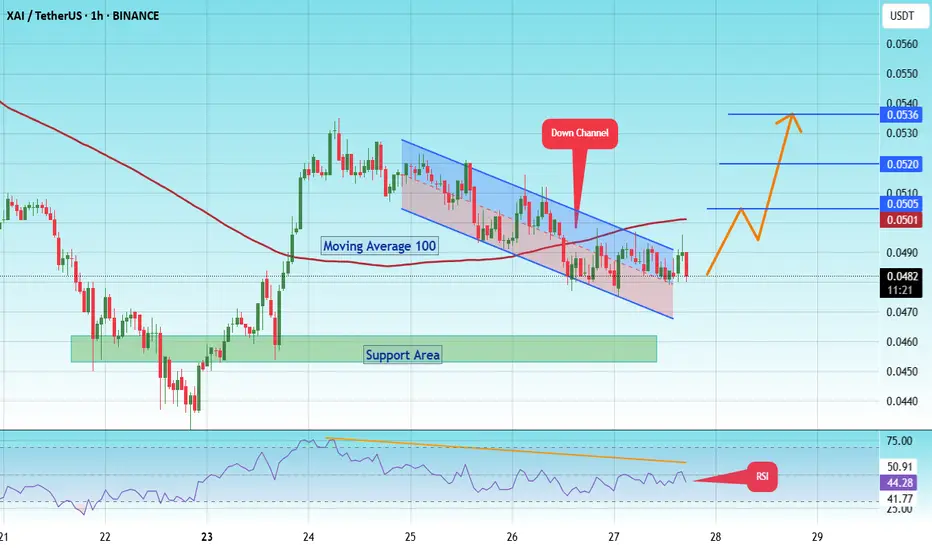
The price is moving within a descending channel on the 1-hour frame and is expected to break and continue upward.
We have a trend to stabilize above the 100 moving average once again.
We have a downtrend on the RSI indicator that supports the upward break.
We have a support area at the lowe
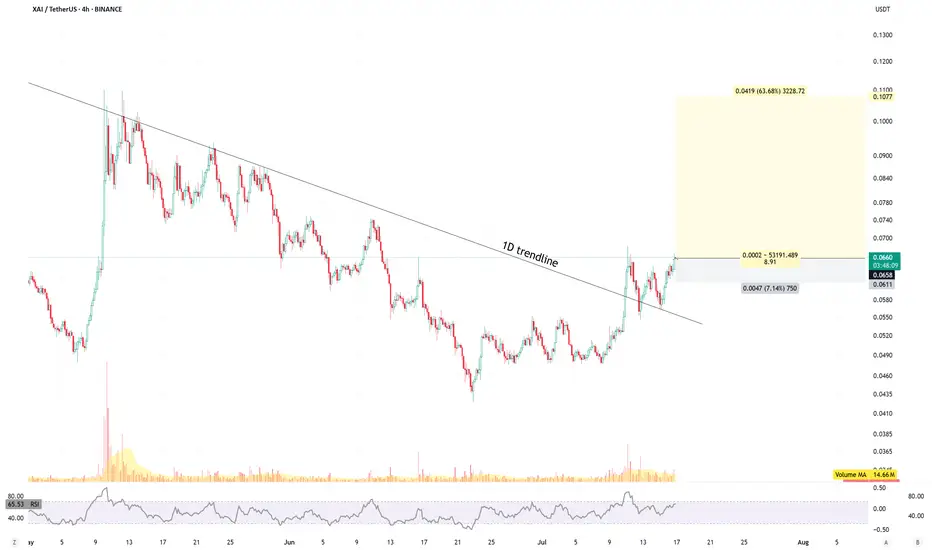
Long XAIXAI is emerging as a leading token in the blockchain gaming sector, supported by strong infrastructure, community grants, and developer adoption.
Trade setup is as in chart for the following reasons.
Breakout 1D trendline: done
Breakout 4H local double bottom: done
Disclaimer:
This anal
#XAI/USDT#XAI
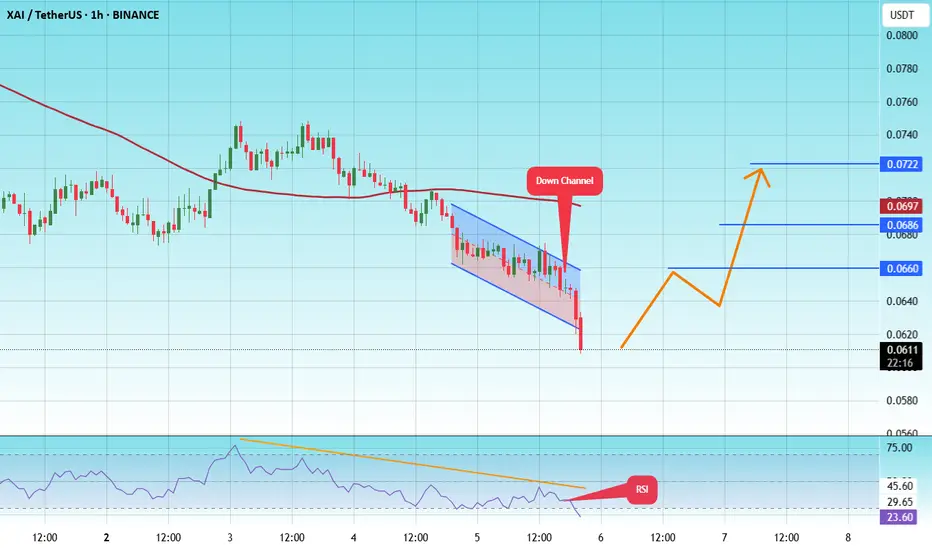
The price is moving within a descending channel on the 1-hour frame, adhering well to it, and is heading for a strong breakout and retest.
We have a bounce from the lower boundary of the descending channel, which is support at 0.0448.
We have a downtrend on the RSI indicator that is about to
#XAI/USDT#XAI
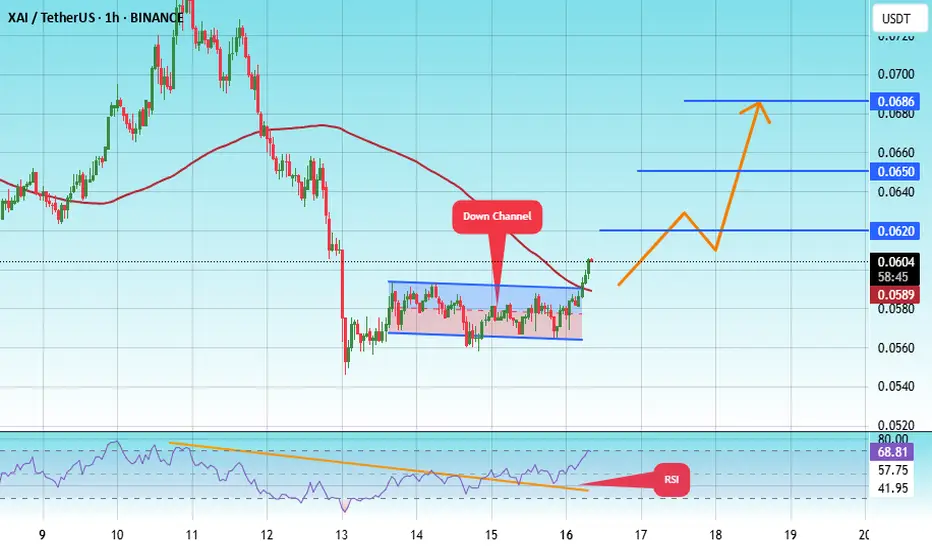
The price is moving within a descending channel on the 1-hour frame, adhering well to it, and is heading toward a strong breakout and retest.
We are experiencing a rebound from the lower boundary of the descending channel. This support is at 0.0570.
We are experiencing a downtrend on the RSI
#XAI/USDT#XAI
The price is moving within a descending channel on the 1-hour frame and is expected to break and continue upward.
We have a trend to stabilize above the 100 moving average once again.
We have a downtrend on the RSI indicator, which supports the upward move by breaking it upward.
We have a s
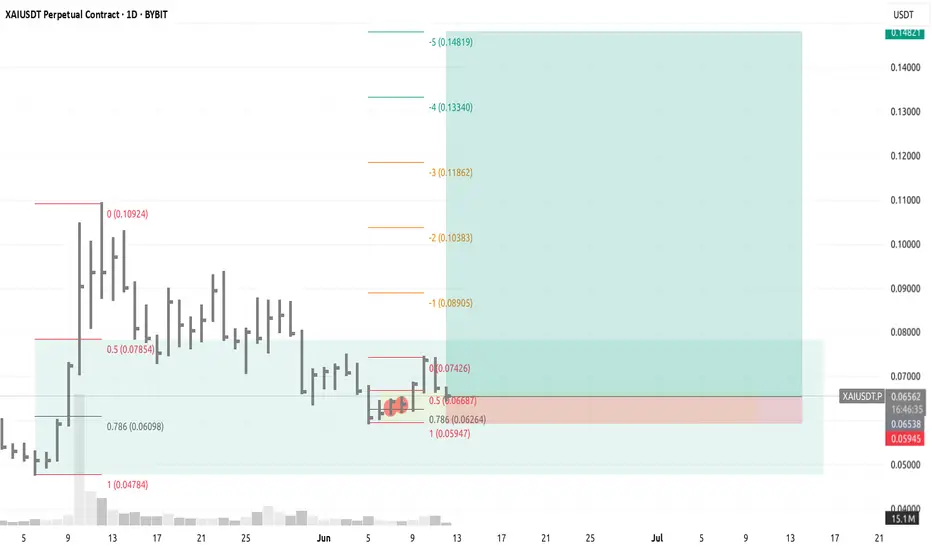
XAIUSDT / LONG / 12.06.25⬆️ Buy XAIUSDT, 12.06.25
💰 Entry: 0.06687
🎯 Target: 0.14819
⛔️ Stop: 0.05947
Reasons for entry:
— 1D
Price in consolidation for more than 1 day
Correction into the discount zone
— 1H
Divergence in long, exit from correction
Decrease in volumes during correction
Predominance of volumes for purch
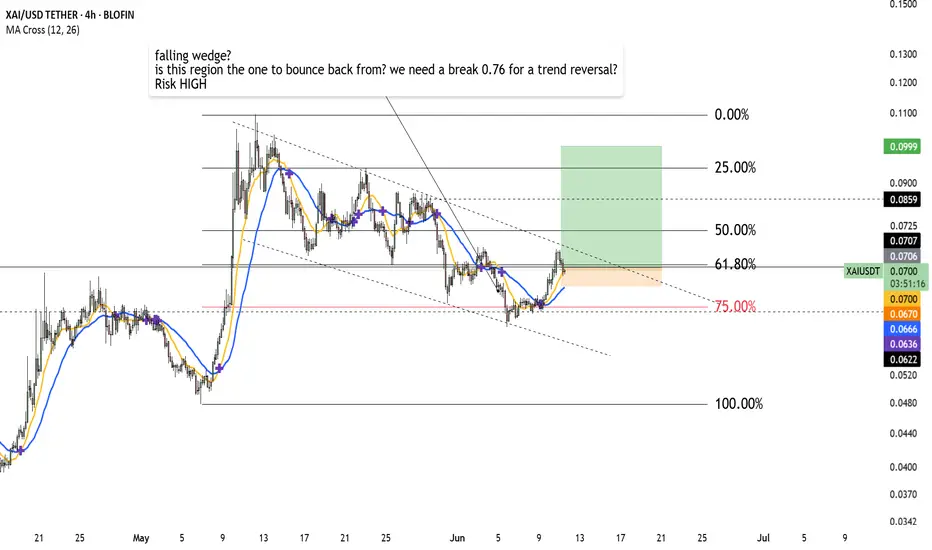
XIA/USDTBetting this chart.
Very high risk trade as XIA has been known for being volatile especially in day like today.
I am interested to see how this is going to react to the CPI data.
Is it going to pump with the whole market?
There is a posible faling wedge pattern here.
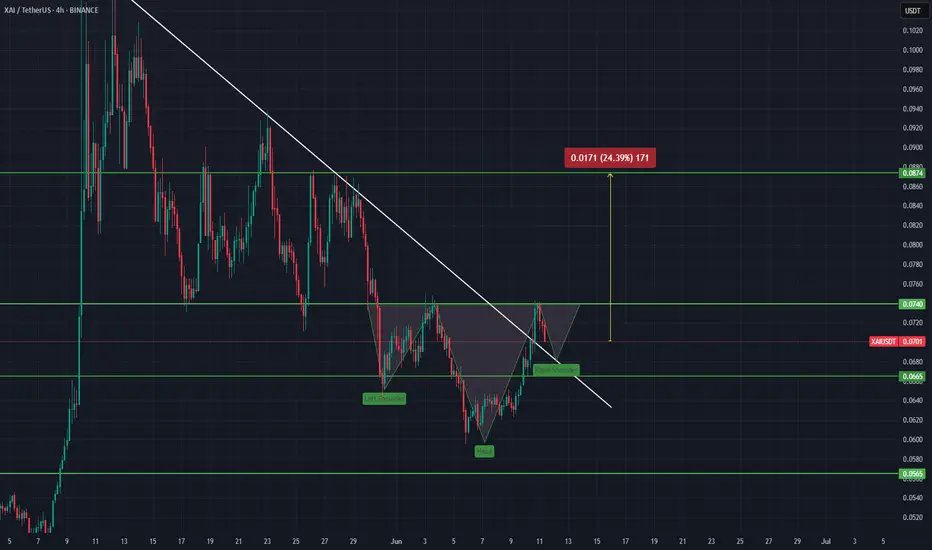
XAI 4H
There is an inverse head-and-shoulders formation in XAI. If closings come above $0.074, the price is expected to touch $0.087 as the target.
See all ideas
Summarizing what the indicators are suggesting.
Oscillators
Neutral
SellBuy
Strong sellStrong buy
Strong sellSellNeutralBuyStrong buy
Oscillators
Neutral
SellBuy
Strong sellStrong buy
Strong sellSellNeutralBuyStrong buy
Summary
Neutral
SellBuy
Strong sellStrong buy
Strong sellSellNeutralBuyStrong buy
Summary
Neutral
SellBuy
Strong sellStrong buy
Strong sellSellNeutralBuyStrong buy
Summary
Neutral
SellBuy
Strong sellStrong buy
Strong sellSellNeutralBuyStrong buy
Moving Averages
Neutral
SellBuy
Strong sellStrong buy
Strong sellSellNeutralBuyStrong buy
Moving Averages
Neutral
SellBuy
Strong sellStrong buy
Strong sellSellNeutralBuyStrong buy
Displays a symbol's price movements over previous years to identify recurring trends.