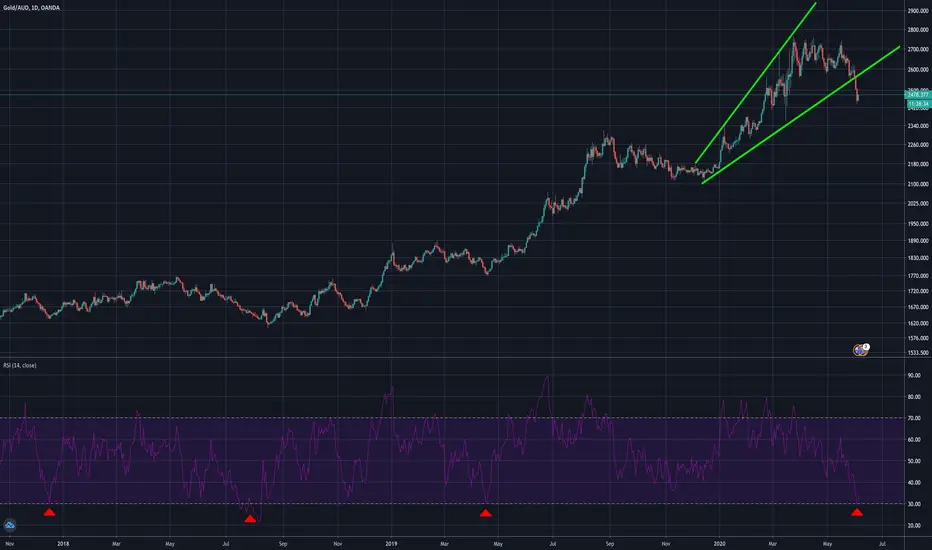
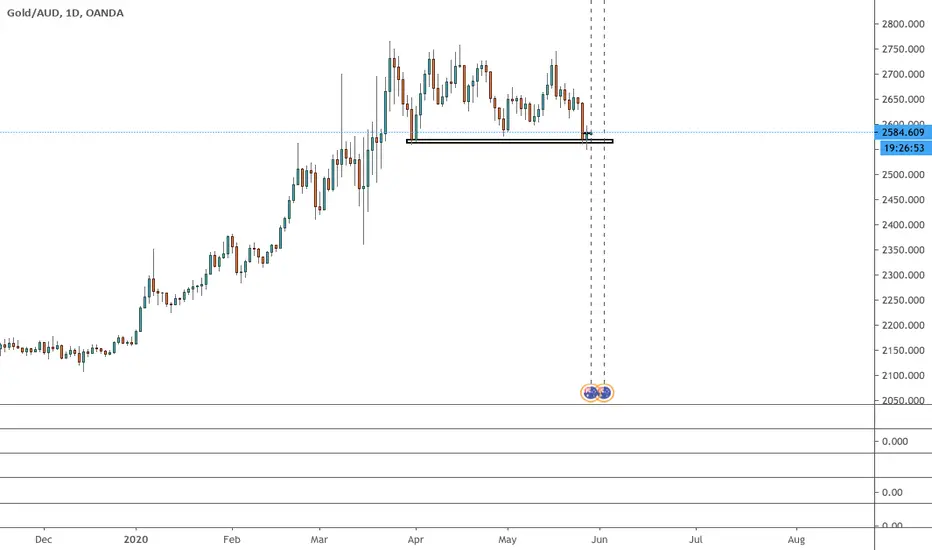
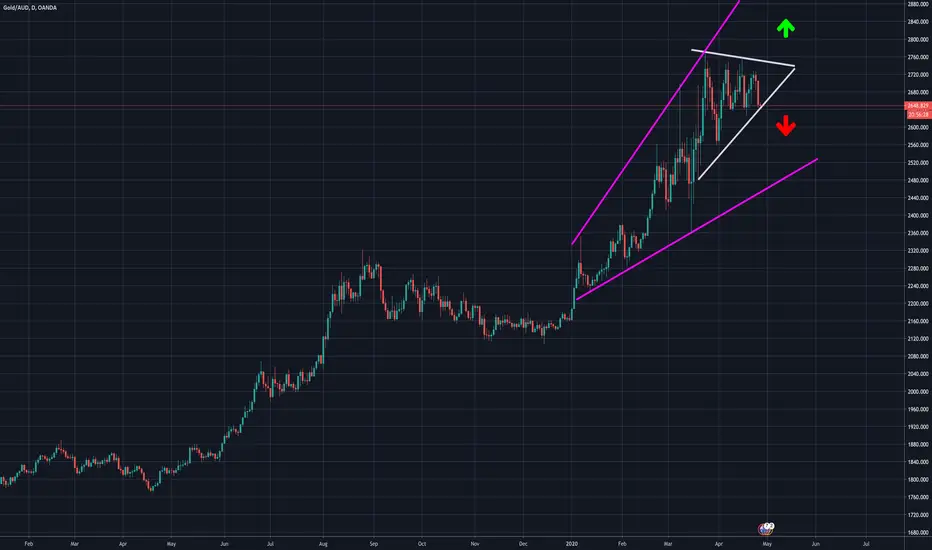
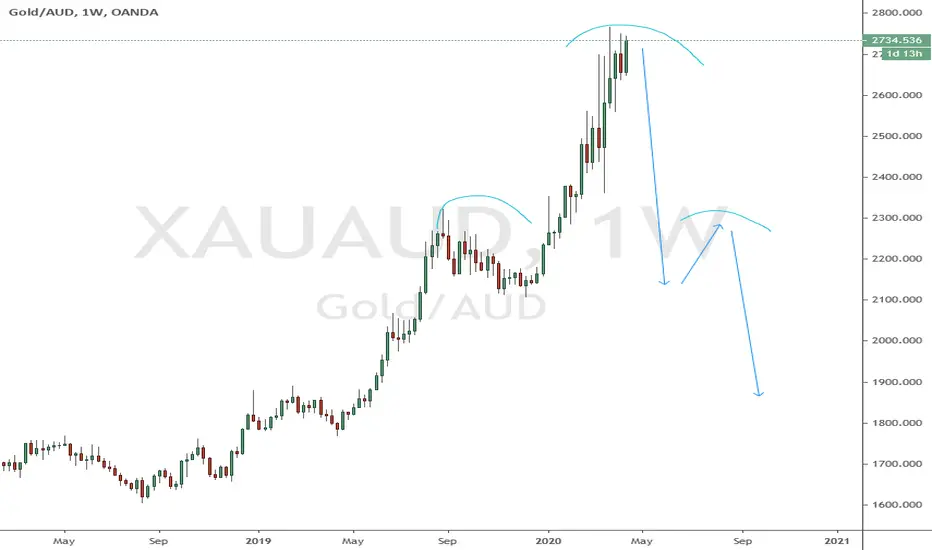
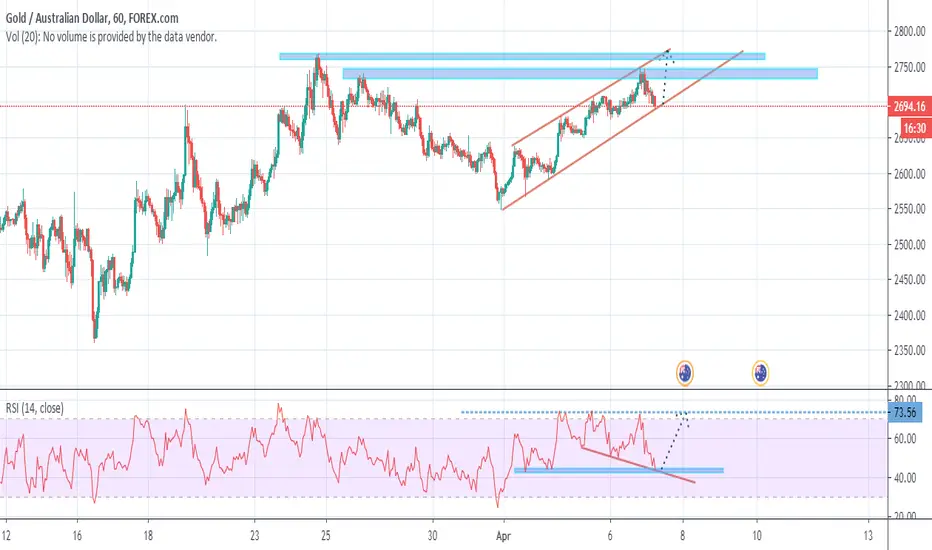
Gold (AUD) daily- Downward breakout from Ascend' Broaden' Wedge.Gold (AUD) daily- Downward breakout from Ascendening Broadening Wedge (ABW).
81% of AWB breakouts occurs in the direction leading up to the ABW. However, this is that 19% of cases.
Note: We are at Oversold RSI's under 30. History shows, when the RSI hits these levels, usually prices bounce back up.
XAUAUD trade ideas
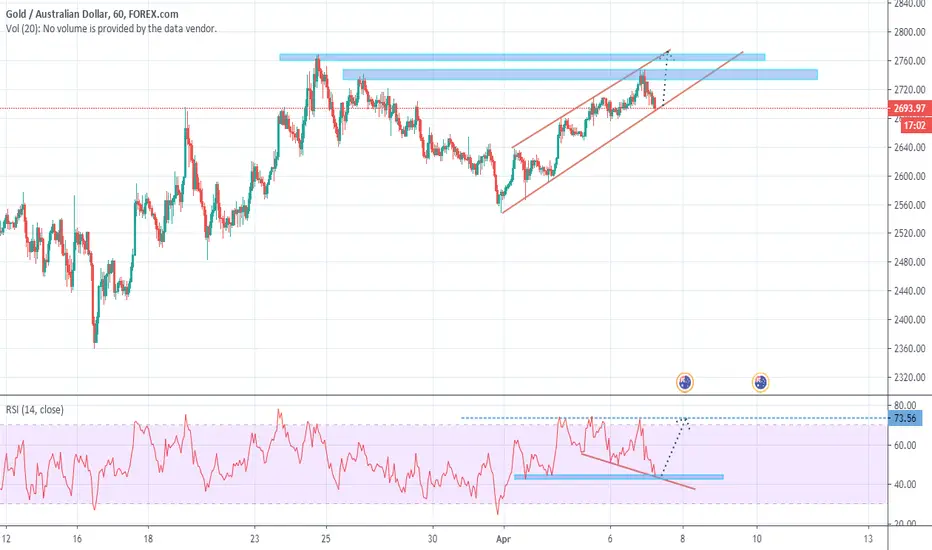
Long opportunity with XAUAUD bounce off support XAUAUD touched daily support offering a long opportunity. Stop Loss should below the previous swing low on H1 not above it.
Gold (AUD) daily chart-Symmetrical triangl's,Ascend/Fallin'WedgeGold (AUD) daily. Symmetrical, ascending, fallin' wedges. However, bullish uptrend intact.
With unprecedented Unlimited Fed QE , expect a big rally in Gold and Silver over the next 3 years (as occurred after the great Fed QE from 2008-11).
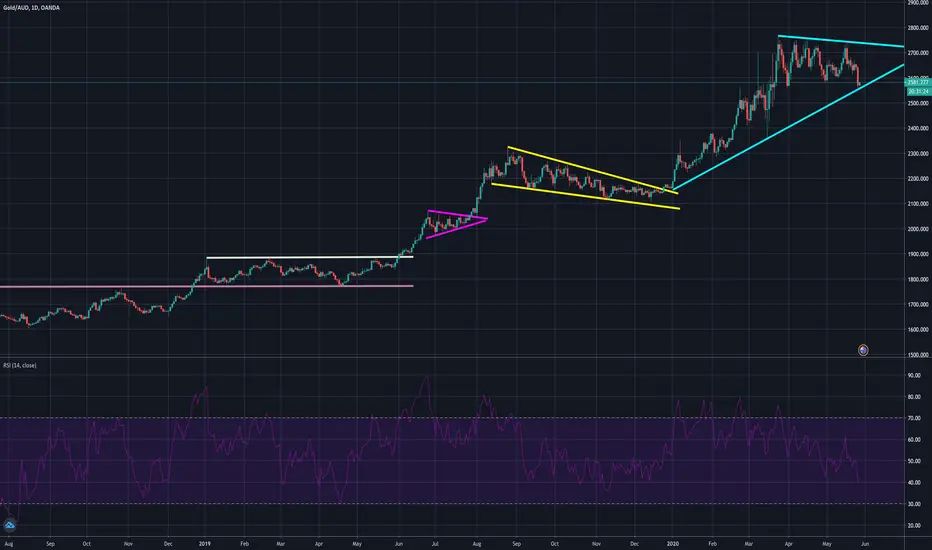
Gold (AUD) Daily- Symmetrical Triangle inside a Ascendening BroaGold (AUD) Daily- Symmetrical Triangle inside a Ascendening Broadening Wedge.
thepatternsite.com
thepatternsite.com

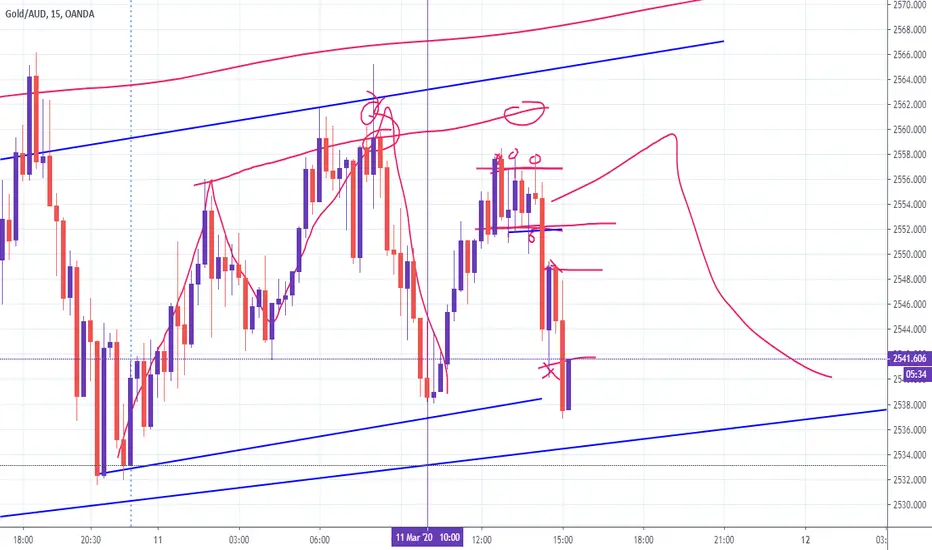
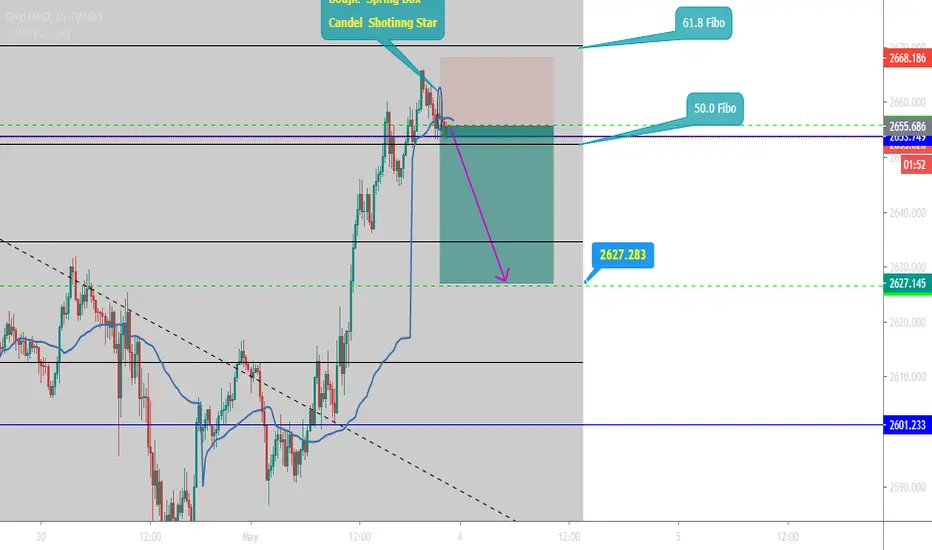
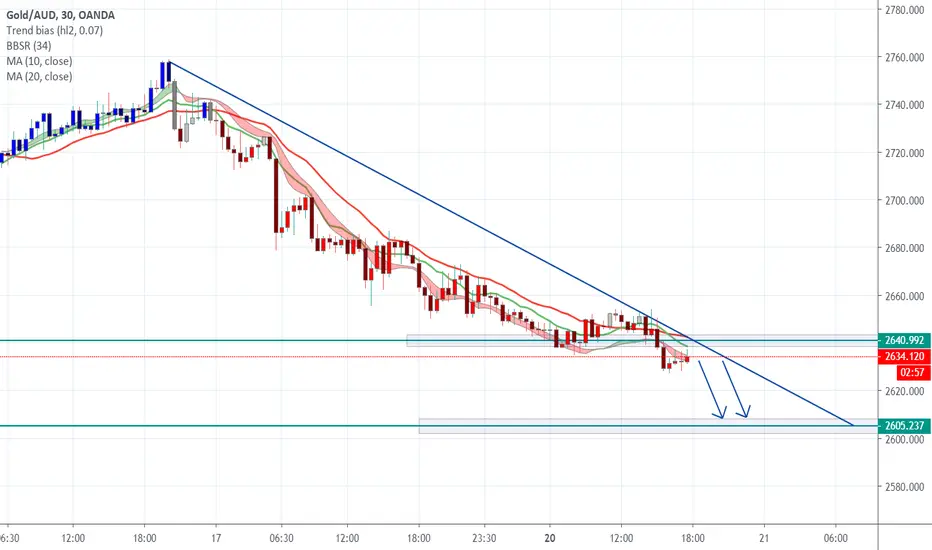
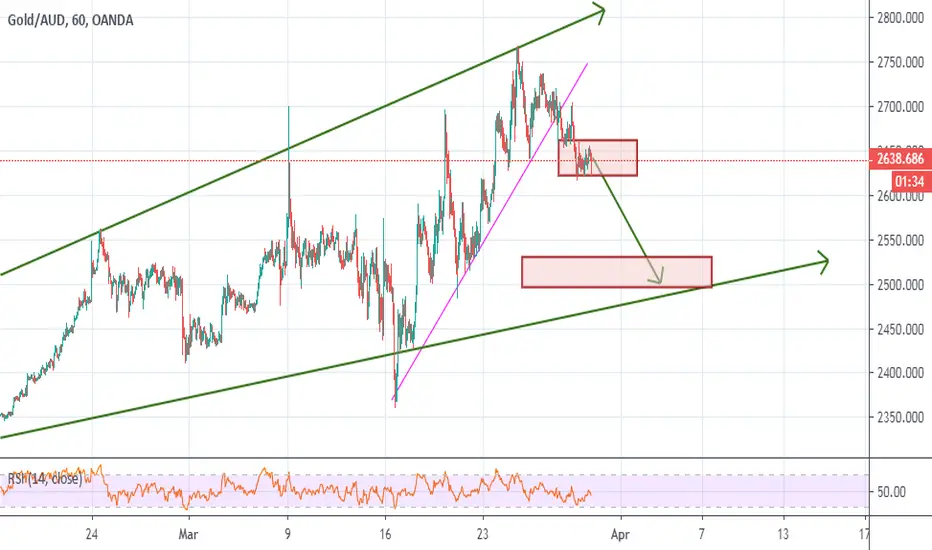
XAUAUD bearish To 2627.30 . MK ( Market Killer )We have end of Correction,
and Price action Shoting star candel ( Spring Box ).
We can see bearish to 2627.30.
Thank you.
" MK "
Gold/AUD - Pullback - Buying Opportunity? I usually get quite frustrated with the Wall Street idiom of "buy the dip" what amounts to the gross over simplification of an entire field of study to "buy when big line go down" is quite annoying.
That being said...
When i see Gold prices dropping in the current financial and economic climate, YES please! I'll buy that dip all day long
As you can see from the chart below, we have a very nice weekly MACD cross, this has historically been quite a nice sign of a decent pullback in our future, usually to the 21 ema as a minimum.
Furthermore, the weekly RSI is also showing signs of weakening momentum, with the typical pullback landing Gold within the $2,400-$2,500 range, as minimum.
That being said, Aussie stocks are looking a little long in the tooth, with the all ordinaries hitting the resistance i outlines several weeks ago, and while there is still some room to move higher, and in fact we are in a near-term uptrend barring a close below the 5,200 mark, i am expecting the equity markets to continue to deteriorate over the coming weeks and months.
Even as the Aussie economy does begin to 'reopen' and loosen certain restrictions, that will amount to very little, as Australia is still predominantly a resource based economy, reliant on exports of minerals and raw materials. The economy's struggles will be exacerbated with the damage to oil prices, and any real recovery will be out of the question until trade begins to resume.
So the equity markets are suggesting HIGHER gold prices, and the gold charts are suggesting a possible pullback (confirmed with a weekly close below the 9ema).
With the global economy still in tatters and as the world slowly begins to awaken to this fact, Gold looks very likely to catch a bid.
Therefore, any dip within gold is one that i am more than happy to follow that oh so simple idiom of "buy the dip"
-TradingEdge
Gold (AUD) daily- Rising WedgeGold (AUD) daily- Rising wedge, inside a Broadening wedge.
60% of downward rising wedge breakout. 40% upward breakout.
Larger Broadening Wedge pattern- 80% of upward eventual breakout.
Gold (AUD) Daily chart- Ascendening Broadening Wedge. Gold (AUD) Daily chart- Ascendening Broadening Wedge.
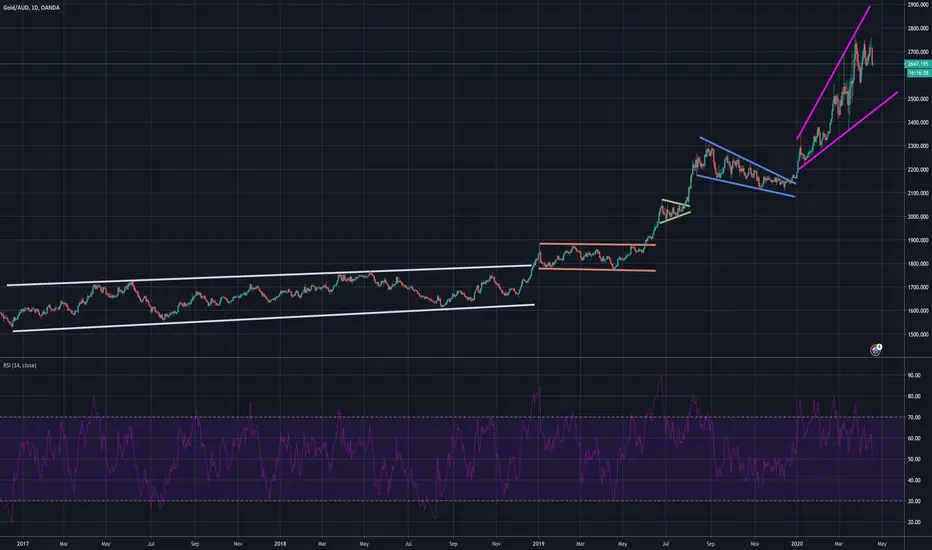
Gold (AUD) daily chart- Symmetrical Triangle.Symmetrical triangles as part of lead uptrend, tend to bias bullish breakouts.

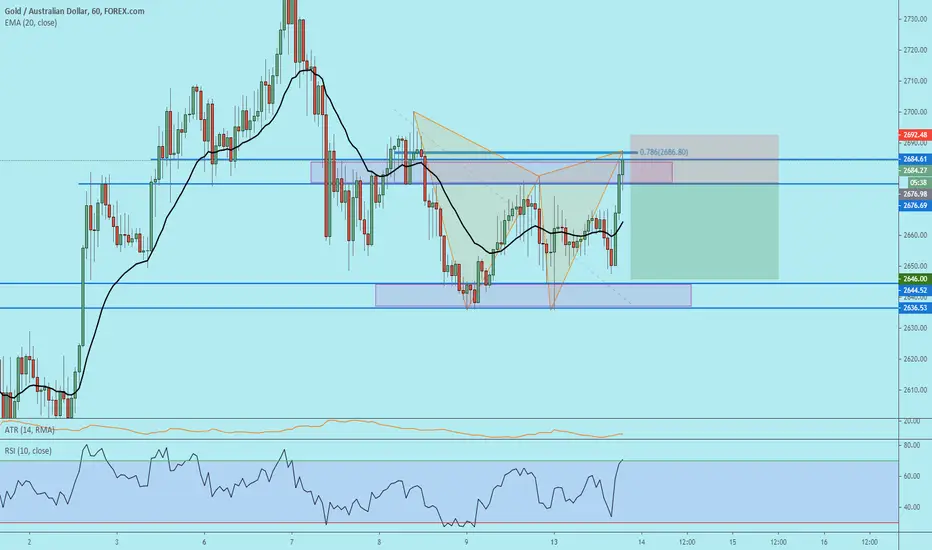
The XAUUSD is going to shortAfter a double top in the 4hr there is a Gartlley pattern on 1 hour that suggestive to short.
I will go down to 15 min to see price action on the 76.8 fib and take a 1:2 trade.
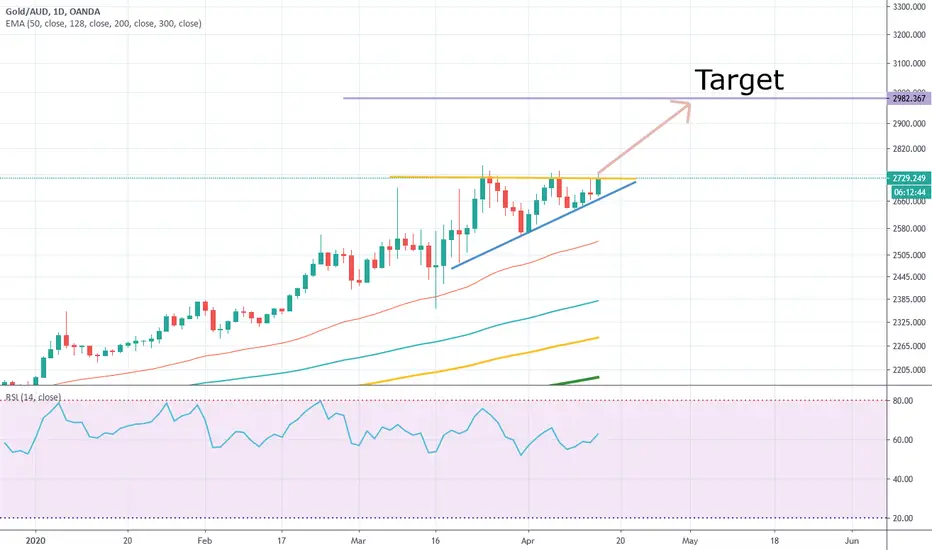
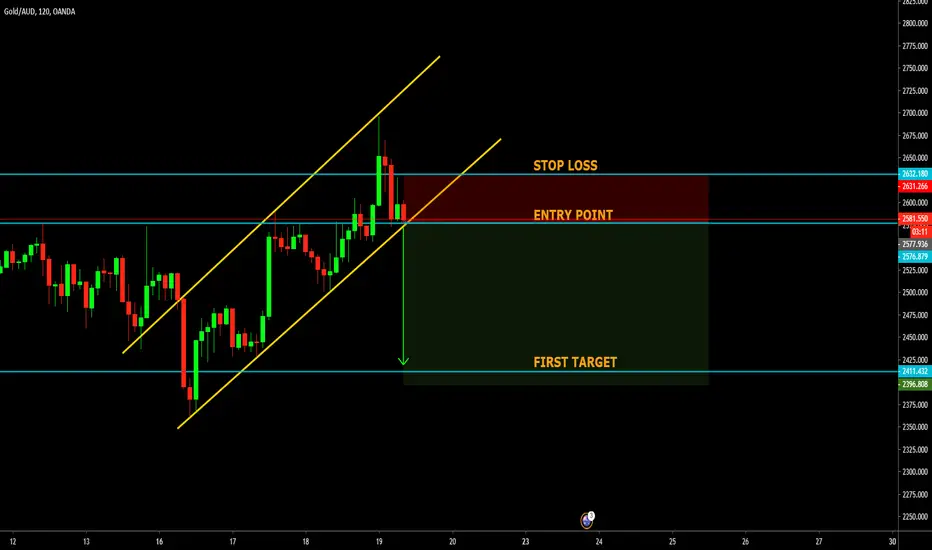
GOLD/AUD - $2,800 Fib Target Within SightQuick update on GOLD/AUD
We appear to be chugging along in a relatively undisturbed uptrend, the Fib extension targets from the April-August 2019 wave higher are pitching a potential point of resistance at the $2,800 mark as this coincides with the 1.27 extension. With a potential overshoot to just shy of $2,900 (based on Keltner channel targets)
Technicals:
~ Macd is bullish and is crossing above on the daily
~ Daily RSI appears to be congruent with the move higher, with no significant divergences, the monthly RSI however, is quite overbought at press time, but is confirming the higher highs
~ Price recently checked in with the 50 ma, so there is still ample room to move higher before a more substantial pullback
~ Price appears to be respecting the 21 ema
~ Looking to the monthly, price has come quite detached from the 10 period ma, suggesting that some mean reversion is on the cards, either by way of price falling, or a period of consolidation to allow the moving averages to catch up
Overall GOLD/AUD is performing very well and looks set to continue higher, at least to the $2,800-$2,900 range, at that point i would expect some selling pressure which could prove to be an ideal entry point
-TradingEdge
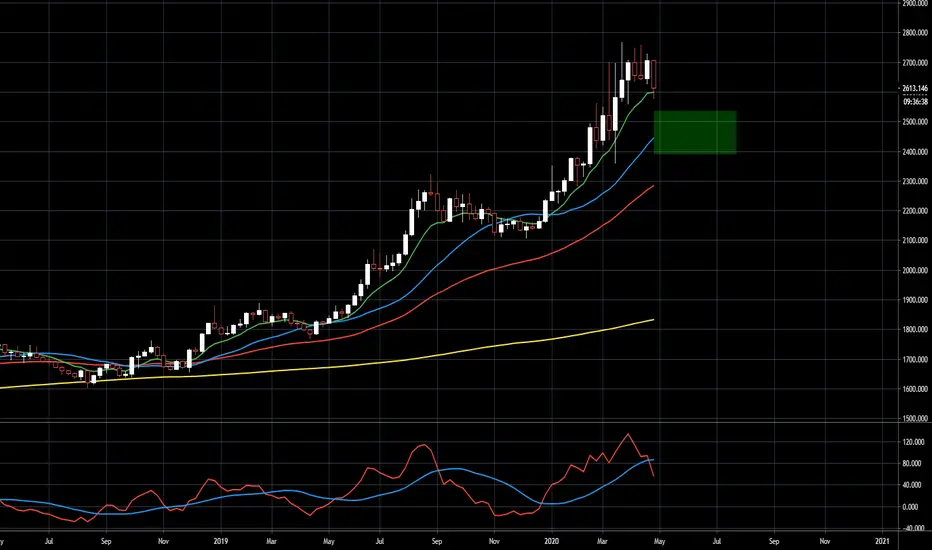
Gold (AUD) daily chart- Following orderly uptrend. Gold (AUD) daily chart- Following orderly uptrend.
Yellow line- 20 day simple MA.

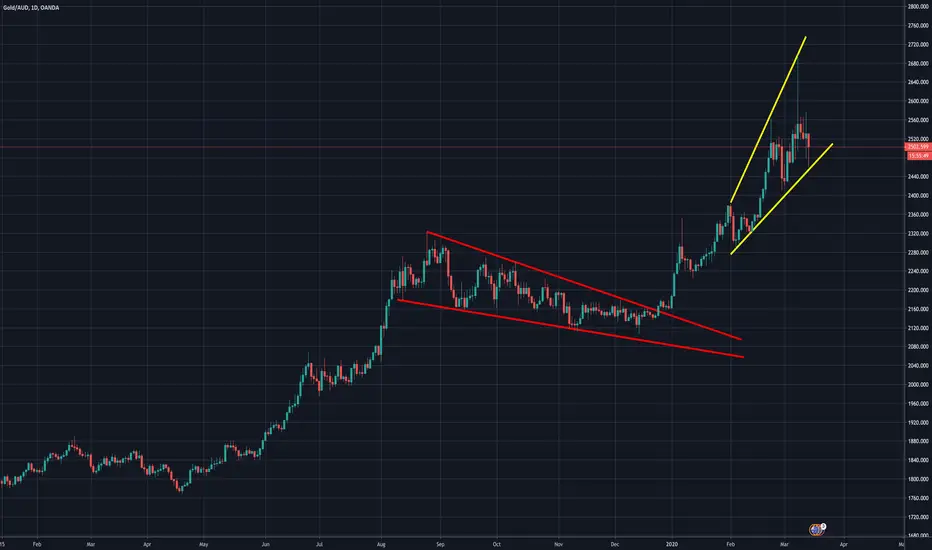
Gold in AUD (daily chart)- Ascending broadening wedge. Gold in AUD (daily chart)- Ascending broadening wedge (yellow lines).
According to Bulkowski's chart pattern research- 81% probability of a bullish eventual breakout.
thepatternsite.com