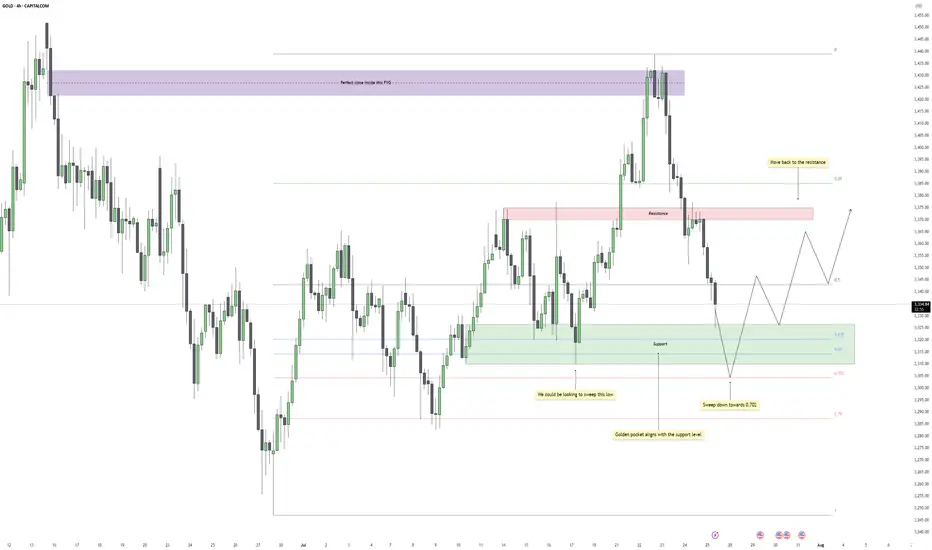
Gold - Eyes on the Final Flush Before ReclaimGold recently dropped after reacting perfectly inside a higher time frame fair value gap. That zone acted as clean supply, offering a precise close within the imbalance and initiating a strong bearish leg. The move confirmed that buyers were overwhelmed at that level, and price began its descent bac
About Gold Spot / U.S. Dollar
Gold price is widely followed in financial markets around the world. Gold was the basis of economic capitalism for hundreds of years until the repeal of the Gold standard, which led to the expansion of a flat currency system in which paper money doesn't have an implied backing with any physical form of monetization. AU is the code for Gold on the Periodic table of elements, and the price above is Gold quoted in US Dollars, which is the common yardstick for measuring the value of Gold across the world.
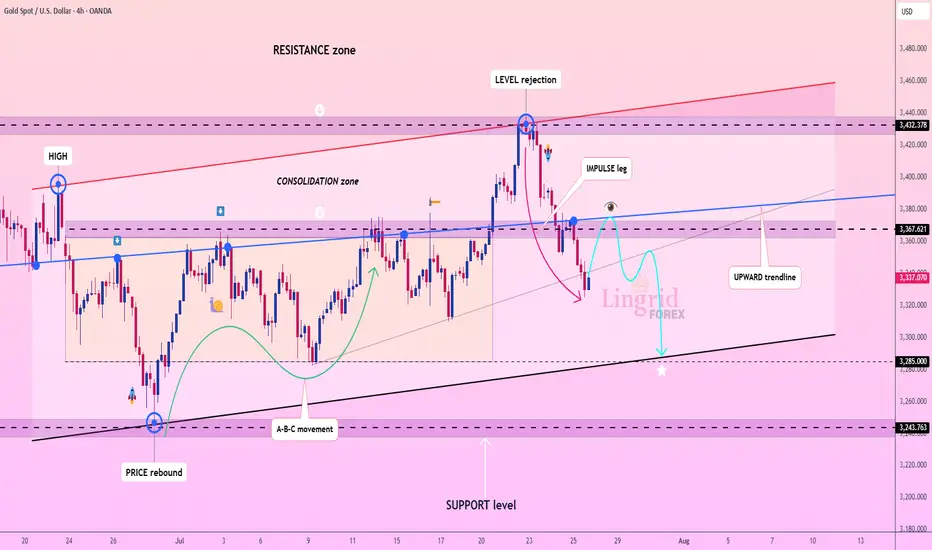
Lingrid | GOLD Weekly Market Outlook: Resistance Zone RejectionOANDA:XAUUSD markets have encountered significant resistance at the $3,450 level, resulting in a notable rejection and subsequent pullback toward support zones. The precious metal is now testing critical technical levels that will determine whether the broader bullish momentum can be sustained or i
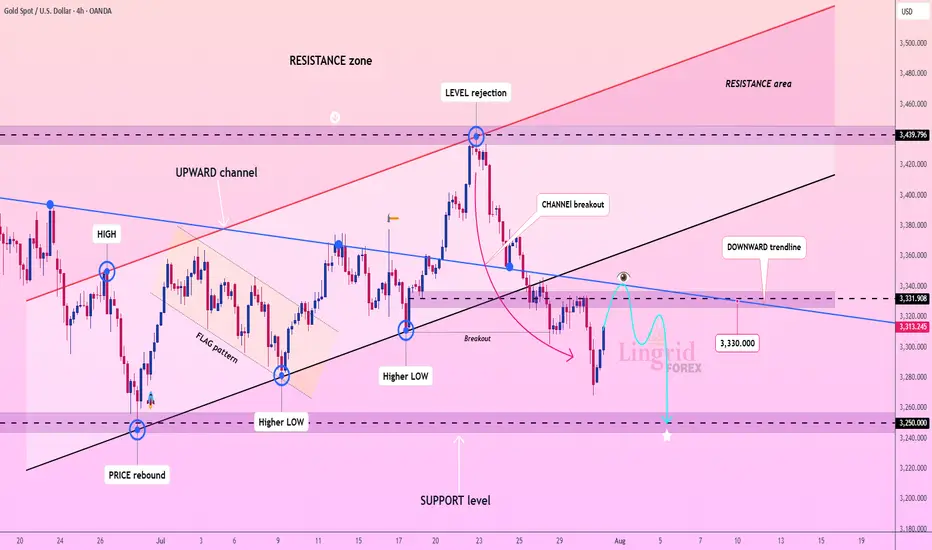
Lingrid | GOLD Possible Retest of the Major Support ZoneThe price perfectly fulfilled my previous idea . OANDA:XAUUSD is bouncing from recent lows but remains under pressure below the key resistance at 3,331.90 and the downward trendline. The prior rejection near 3,440 led to a steep selloff with a clean break below the upward channel. Current action
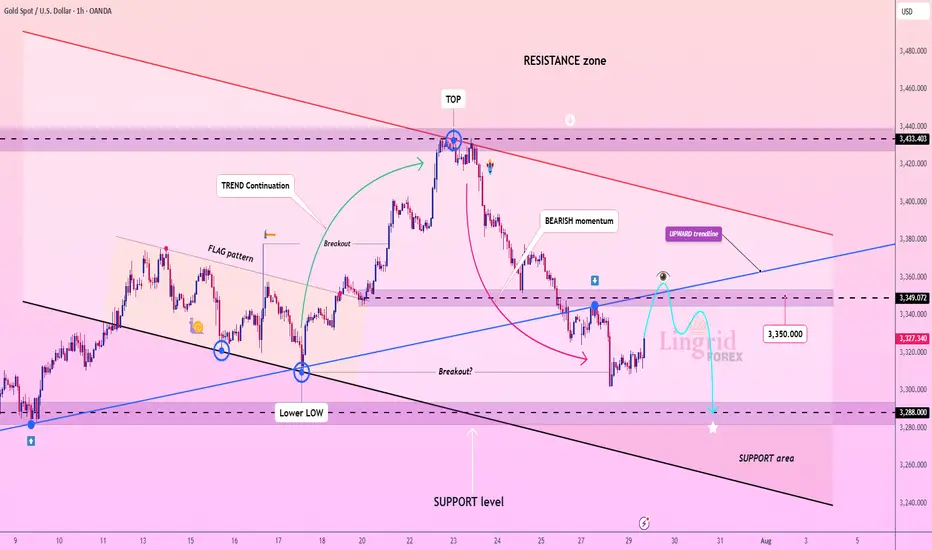
Lingrid | GOLD shorting Opportunity at Confluence ZoneThe price perfectly fulfilled my previous idea . OANDA:XAUUSD broke down sharply after forming a local top at the 3433 resistance zone, with clear bearish momentum dominating recent candles. Price is now consolidating below the broken trendline and previous structure at 3349, setting up for a pos
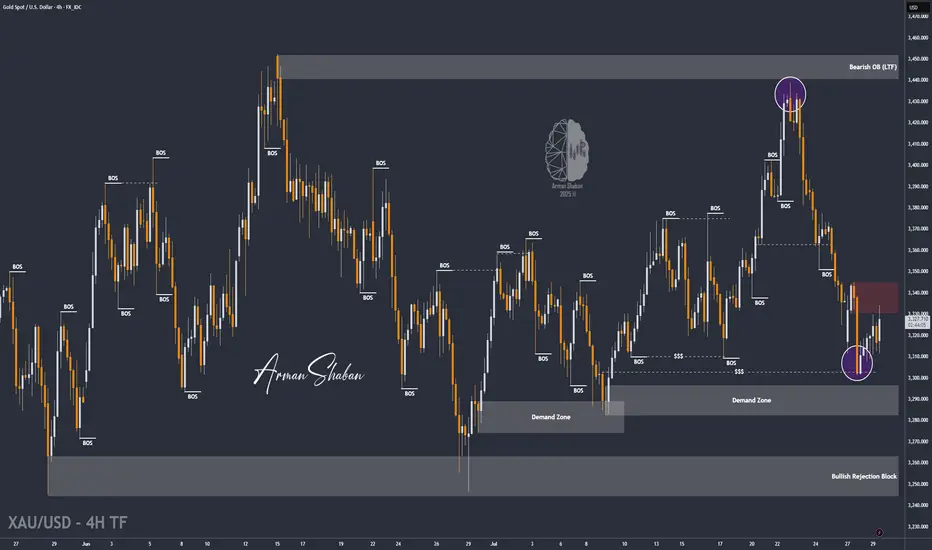
XAU/USD | Gold Below $3345 – Key Demand Awaits at $3282–$3296!By analyzing the gold chart on the 4-hour timeframe, we can see that after dropping to the $3301 area, strong demand came in, helping the price stabilize above $3300 and rally up to over $3334. Currently, gold is trading around $3331. If the price fails to break and hold above $3345 within the next
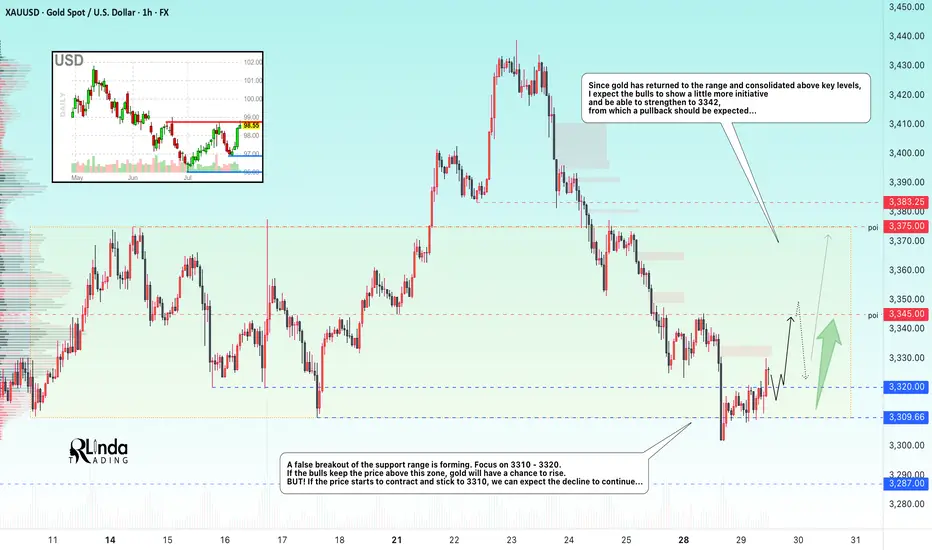
GOLD → Formation of a trading range. 3345?FX:XAUUSD confirms support for the local range. A false breakdown has formed and the price has returned to the buying zone. We are waiting for the bulls to take the initiative...
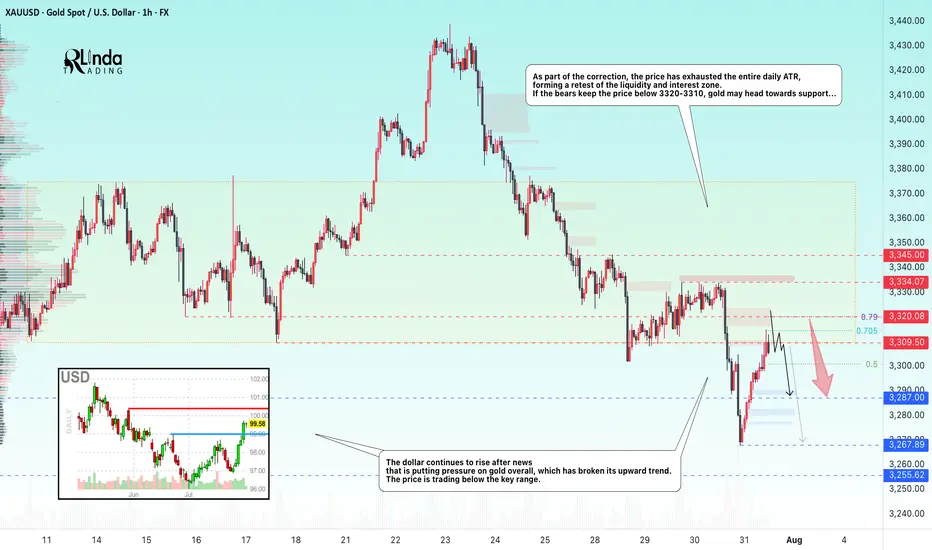
Gold is trying to recover after falling to $3302, remaining under pressure ahead of key events in the US: the publi
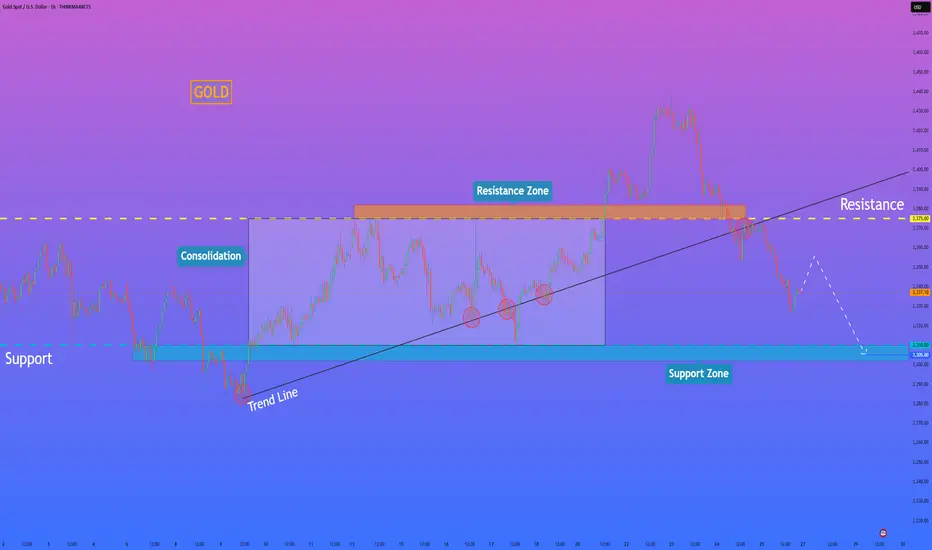
HelenP. I Gold can continue to decline to support zoneHi folks today I'm prepared for you Gold analytics. If we look at the price chart, we can observe a significant shift in the market structure, highlighted by the recent decisive break of a long-standing ascending trend line. This event suggests that the previous bullish momentum has been exhausted a
Gold 30Min Engaged ( Buy & Sell Reversal Entry Detected )Time Frame: 30-Minute Warfare
Entry Protocol: Only after volume-verified breakout
🩸Bearish Reversal - 3304
🩸Bullish Reversal - 3275
➗ Hanzo Protocol: Volume-Tiered Entry Authority
➕ Zone Activated: Dynamic market pressure detected.
The level isn’t just price — it’s a memory of where they moved s
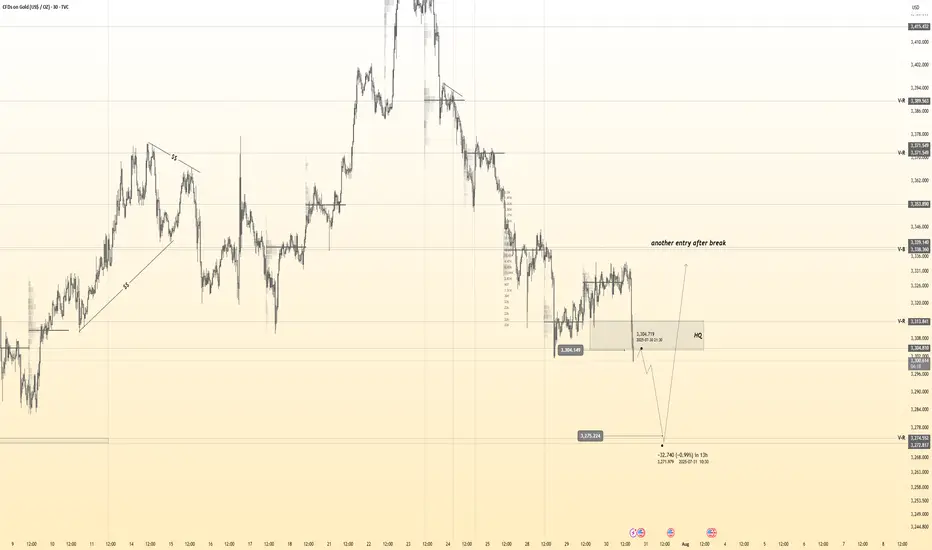
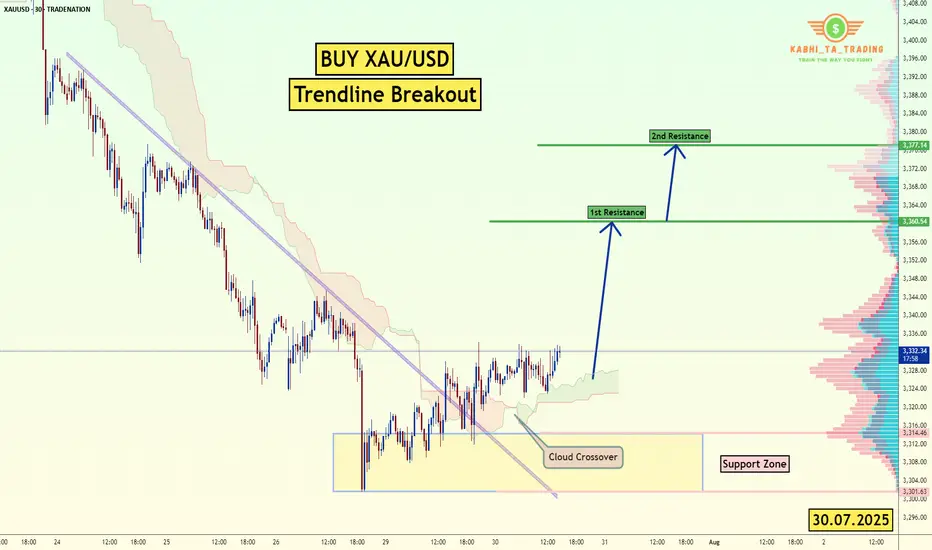
XAU/USD Trendline Breakout (30.07.2025)The XAU/USD pair on the M30 timeframe presents a Potential Buying Opportunity due to a recent Formation of a Trendline Breakout Pattern. This suggests a shift in momentum towards the upside and a higher likelihood of further advances in the coming hours.
Possible Long Trade:
Entry: Consider Enter
GOLD → Retest of resistance within a bearish runFX:XAUUSD breaks through the upward trend support amid a rallying dollar. Since the opening of the session, the price has been testing the zone of interest, but bears are quite aggressive...
Gold is partially recovering after falling to $3,268, a monthly low caused by the Fed's hawkish tone. T
See all ideas
Summarizing what the indicators are suggesting.
Oscillators
Neutral
SellBuy
Strong sellStrong buy
Strong sellSellNeutralBuyStrong buy
Oscillators
Neutral
SellBuy
Strong sellStrong buy
Strong sellSellNeutralBuyStrong buy
Summary
Neutral
SellBuy
Strong sellStrong buy
Strong sellSellNeutralBuyStrong buy
Summary
Neutral
SellBuy
Strong sellStrong buy
Strong sellSellNeutralBuyStrong buy
Summary
Neutral
SellBuy
Strong sellStrong buy
Strong sellSellNeutralBuyStrong buy
Moving Averages
Neutral
SellBuy
Strong sellStrong buy
Strong sellSellNeutralBuyStrong buy
Moving Averages
Neutral
SellBuy
Strong sellStrong buy
Strong sellSellNeutralBuyStrong buy
Displays a symbol's price movements over previous years to identify recurring trends.