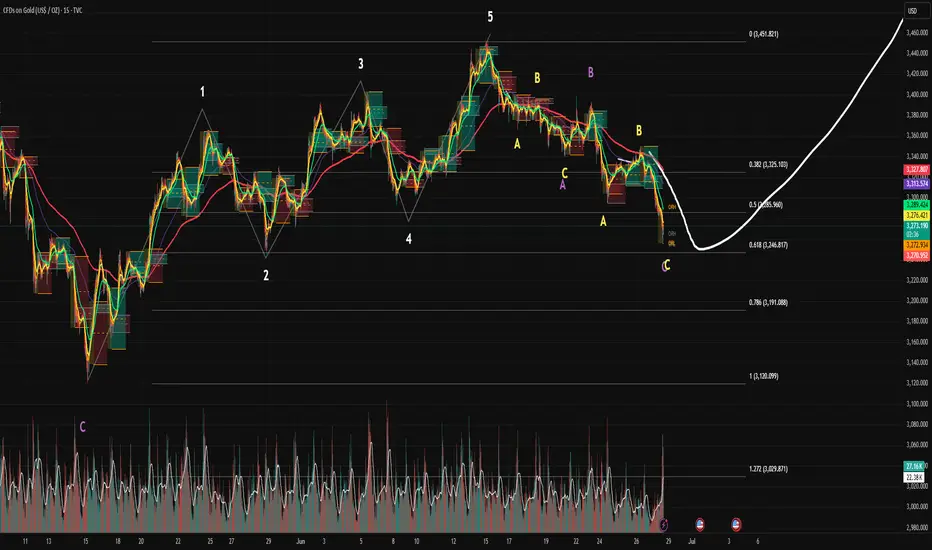
Gold has no chance to rise
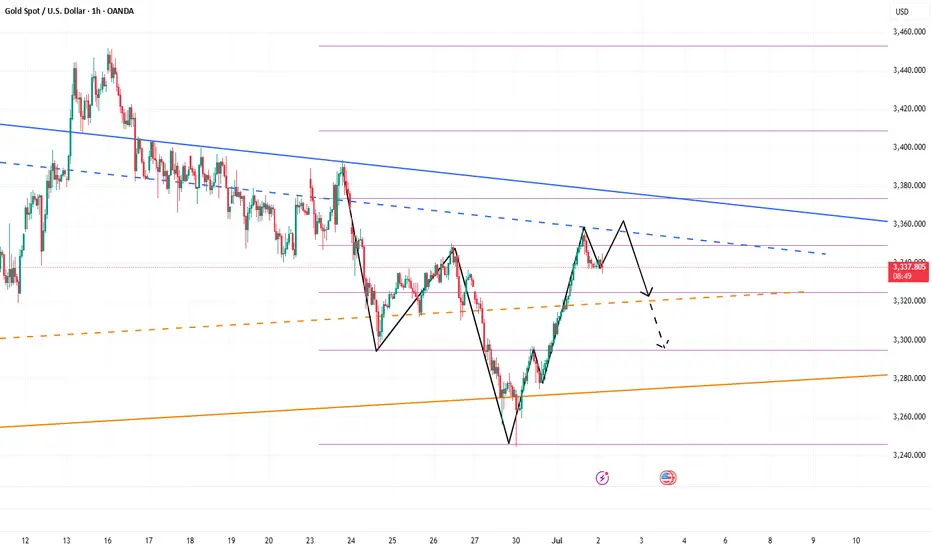
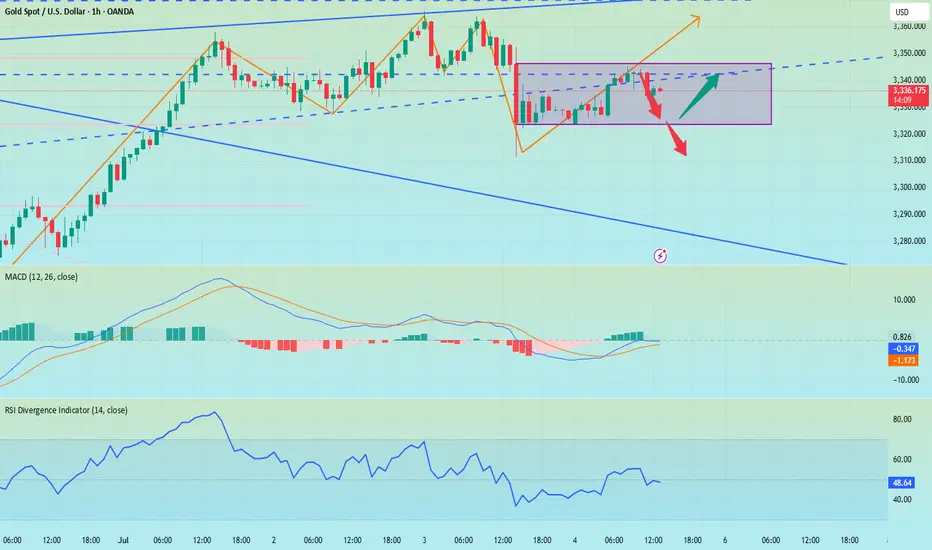
Gold did not break through the upper pressure on Friday. Gold fell directly after opening on Friday. The bears broke through the previous 3295 support line, and the lowest reached 3255. It closed near 3274. The daily line also closed in the form of a big Yin line. The downward trend is obvious, and all the previous supports will also turn into pressure. The short-term moving average system crosses downward to accumulate energy for the bears, and the Bollinger Bands are also expected to open downward. Since the closing did not break through the upper 3300 suppression level, we will continue to rebound and short next week. After all, the technical side is still short, and only by following the trend can we keep up with our rhythm. We also pay attention to international news on the weekend. Combined with the news, I will analyze the specific strategy ideas before the opening of Monday. If your current gold operation is not ideal, I hope Yulia can help you avoid detours in your investment. Welcome to communicate!
From the 4-hour analysis, the upper short-term resistance is around 3295-3301, and the focus is on the important suppression of 3314-16. In terms of operation, the rebound continues to be short and follow the trend to fall. The short-term support below is around 3250-3255. The overall high-altitude participation is maintained in this range. I will remind you of the specific operation strategy during the trading session, so please pay attention to it in time.
Gold operation strategy:
Short at the rebound of 3295-3301, short at the rebound of 3314-16, stop loss at 3326, target at 3255-3260, and continue to hold if it breaks;
XAUUSD.F trade ideas
XAUUSD| - liquidity Driven Buy Setup📌 Pair: XAUUSD
📈 Bias: Bullish
🕰 HTF View (4H):
Last week’s price action formed a bullish continuation structure. Internal major high taken, sweeping liquidity—confirmation of smart money interest. Expecting continuation to upside objectives.
🧭 LTF View (30M):
Waiting for clean major LH break following the sell-side liquidity sweep. Entry zones will be refined once OB mitigation confirms buyer interest.
🎯 Entry Zone:
After SSL sweep + OB tap
🎯 Target: Recent highs and continuation beyond
🧠 Mindset Note:
Trusting the flow from higher-timeframe intention down to precision entries. Patience here pays—let the structure confirm before pressing the trigger.
Bless Trading!
XAUUSD Under Pressure: What the Market Is Telling UsGold (XAUUSD) is currently trading with a clear bearish bias, showing sustained downside momentum on the 4H timeframe 🕒. Price has been gradually stepping lower, and the structure continues to favor the sellers.
As expected for early in the week, there’s been a bit of choppy movement ⚖️, but the overall sentiment remains weak. Unless we see a strong shift or catalyst, I’ll be maintaining a bearish outlook.
🧭 I’m watching for price to revisit key resistance levels, and if we get a clean break and retest 🔄, I’ll be looking for potential short setups from areas of previous demand that flip into resistance.
🌐 Keep an eye on broader risk sentiment — if NASDAQ starts pulling back or DXY strengthens, it could fuel further downside in gold.
As always, this is not financial advice, but the detailed breakdown is available in the latest video 🎥.

Lesson 16: gold/usd 1hr price break-out analysis Quick explanation on how to chart your trades and analyze price break-out of support and resistance.

XAUUSD Daily Sniper Plan – June 27, 2025Hey traders! Today’s a trader’s dream: high-impact US news, gold trapped in a tight coil between supply and demand, and price flirting with the decision zone. The first breakout will be explosive — but only one side survives the trap. Let’s lock in the real structure, real bias, and sniper-level execution.
🔸 HTF Bias Breakdown
Daily Bias: Neutral → Price trapped between major supply (3359) and HTF demand (3282). Expect breakout after news.
H4 Bias: Bearish → Lower highs holding below 3359, structure weak below 3340.
H1 Bias: Mixed → Bullish momentum building off 3310–3282, but compression under EMAs warns of a fake rally.
🔹 Key Levels Above Price
3385 – Final top-side liquidity zone (last week’s spike high)
3359–3344 – HTF supply & OB (main short zone)
3340–3330 – The pivot zone (battle for control)
🔸 Key Levels Below Price
3317–3310 – Primary demand zone (where buyers stepped in yesterday)
3297–3282 – Deep liquidity pocket & HTF OB (last chance for bulls)
3260 – Breakdown zone if everything fails below
🔥 Sniper Zones & Execution Logic
🔴 3385–3375 – Extreme Supply
Only trade this zone if NY news launches price up and rejection is instant. Needs M5/M15 bearish reversal (engulfing, CHoCH, FVG fill). No news spike = no trade.
🔴 3359–3344 – Main Supply Zone
This is your first real short setup. Sweep into this area + rejection = clean short trigger. Confluence: HTF OB, FVG, EMA 100 rejection, bearish CHoCH.
⚔️ 3340–3330 – Pivot Decision Zone
This is where direction flips.
Break and hold above 3340 = bullish → targets 3359 / 3375
Rejection under 3330 = bearish → back toward 3310 or 3282
Plan: Use for break/retest entries only with M5/M15 confirmation. No blind trades.
🟢 3317–3310 – Primary Demand Zone
Watch for news-induced sweep, then M15 bullish PA (CHoCH, engulfing, RSI bounce). First safe buy zone if structure holds.
🟢 3297–3282 – Deep Demand Zone
Only used if NY session nukes the market. Enter only on textbook SMC/ICT reversal + RSI sub-30. This is the last stand for bulls.
🧠 Execution Strategy
Wait for NY news and first liquidity sweep. Don’t guess.
Sell 3359–3344 or 3375+ only on strong rejection
Buy 3310 or 3282 only on bullish reversal confirmation
Pivot 3340–3330 is the heart of today — use for break/retest or trap reversal
If you love clear logic, tap like, follow, and share your bias in the comments! 🚀👇
Disclosure: I am part of TradeNation's Influencer program and I'm using their TradingView charts in my analyses and educational articles.
GoldFxMinds
Short gold, it may retreat again after reaching 3340-3350Although the rebound in gold has exceeded my expectations to a certain extent, it is obviously not a good time to chase the rise in gold. The gold rebound mainly benefits from Trump's repeated requests for the Federal Reserve to cut interest rates, which has led to the continued weakness of the US dollar. In fact, we can clearly see that the gold rebound is not supported by trading volume, and the rebound without volume may face the risk of collapse again at any time. So I don't advocate chasing long gold at present.
Currently, gold has rebounded to around 3339, almost recovering most of the losses in the previous downward wave (the starting point of the previous wave was 3350), but gold is still under pressure in the 3340-3350-3355 area. In the absence of volume support, gold may fall again after touching this resistance area.
Therefore, shorting gold is still the first choice for short-term trading at present; at least make sure not to chase high!
You can consider shorting gold with the 3340-3350-3355 area as resistance, and look at the target: 3320-3310-3300
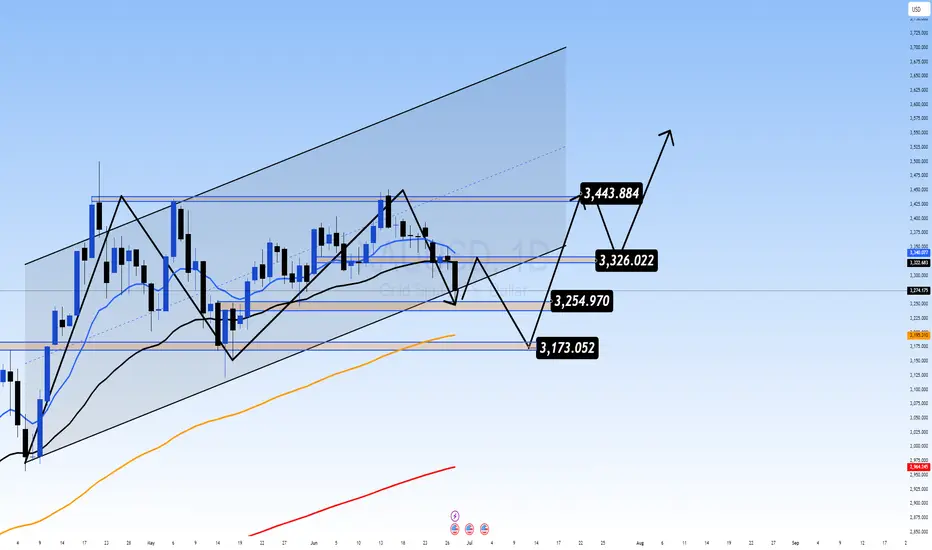
XAUUSD D1 Forecast: Gold at Pivotal 325x Support What's Next for the Yellow Metal?
Today, we're zooming out to examine the broader picture for Gold (XAUUSD) on the Daily (D1) timeframe. Our latest analysis indicates that Gold has encountered a very strong, critical support level around the 325x region. This is a pivotal point that could significantly influence Gold's medium to long-term direction!
🌍 Macroeconomic Landscape: The Underlying Forces Influencing Gold
While we've observed a degree of USD weakness stemming from speculations around the Federal Reserve (such as the rumours regarding Jerome Powell's replacement) and expectations of interest rate cuts, these factors haven't fully countered Gold's recent decline on the daily chart. Furthermore, the sustained ceasefire between Israel and Iran continues to temper Gold's appeal as a safe-haven asset.
Nevertheless, the current price action at the robust 325x support level presents a significant technical signal. The impact of forthcoming US macroeconomic data (particularly the PCE Price Index on Friday) and speeches from FOMC members will be crucial in confirming or negating our projected movements for Gold. Should positive news for Gold align with this support holding, it could act as a potent catalyst.
📊 XAUUSD D1 Technical Analysis: Projecting Gold's Next Move
Given that Gold has reached strong support at 325x, we can anticipate the following scenarios:
Bounce from 325x (Potential Upside Phase):
If the 325x area (which reinforces the 3264.400 support from image_e9d325.png) holds firm, we expect a strong reaction and an upward move for Gold.
The initial target for this bounce would be the 332x region, aligning with resistance levels 3313.737 - 3330.483 from our previous analysis. On a broader timeframe (as illustrated in image_83845c.png), this corresponds to the resistance zone around 3326.022. This 332x area might represent a continuation pattern, suggesting it could be a corrective rally before the resumption of the larger trend.
Resumption of Downtrend (After Reaching 332x):
Once Gold reaches and tests the 332x zone (3313.737 - 3330.483 / 3326.022) and exhibits bearish confirmation signals (e.g., a strong bearish engulfing candle, a pin bar, or a clear top formation), we anticipate a resumption of the downward movement.
The next major target for this decline would be the 317x area, which correlates well with the strong support at 3173.052 on the larger timeframe (as depicted in image_83845c.png).
🎯 XAUUSD D1 Trading Plan: Your Long-Term Strategy Ahead!
Considering the current D1 analysis, here's our actionable plan:
1. BUY PHASE (Bounce from Support):
Entry: Observe price reaction in the 325x - 326x zone (specifically 3264.400). Only consider buying if there are clear bullish confirmations (e.g., a confirmed bullish pattern on the daily or 4-hour candle, a strong bounce from the zone with significant volume).
SL (Stop Loss): Position just below the 325x support zone (e.g., 3245-3240, depending on confirmation).
TP (Take Profit): 3280 - 3284 - 3290 - 3295 - 3300 - 3305 - 3310 - 3313.737 - 3320 - 3326.022 (key 332x zone). This will be our primary target for the potential bounce.
2. SELL PHASE (Downtrend Resumption):
Entry: Once the price reaches and tests the 332x zone (3313.737 - 3330.483 / 3326.022) and shows bearish confirmation signals (e.g., a strong bearish engulfing, pin bar, or clear top formation).
SL (Stop Loss): Position slightly above the 332x zone (e.g., 3335-3340).
TP (Take Profit): 3326 - 3320 - 3316 - 3310 - 3305 - 3300 - 3295 - 3290 - 3280 - 3200 - 3173.052 (final 317x target).
XAUUSD NEXT POSSIBLE MOVEIn this video, I break down my bullish outlook on XAUUSD (Gold) from a 4H and broader market perspective.
With gold currently consolidating near the 3,260 zone, I believe there’s strong potential for a move toward 3,400 in the coming sessions.
One of the key drivers I’m watching is the escalating geopolitical tension between Israel and Iran. If conflict resurfaces or intensifies, we could see a renewed rush into safe-haven assets like gold — historically a reliable response during uncertainty and risk-off sentiment.
Watch the full analysis for detailed levels, market structure, and what I’m looking for in terms of confirmation.

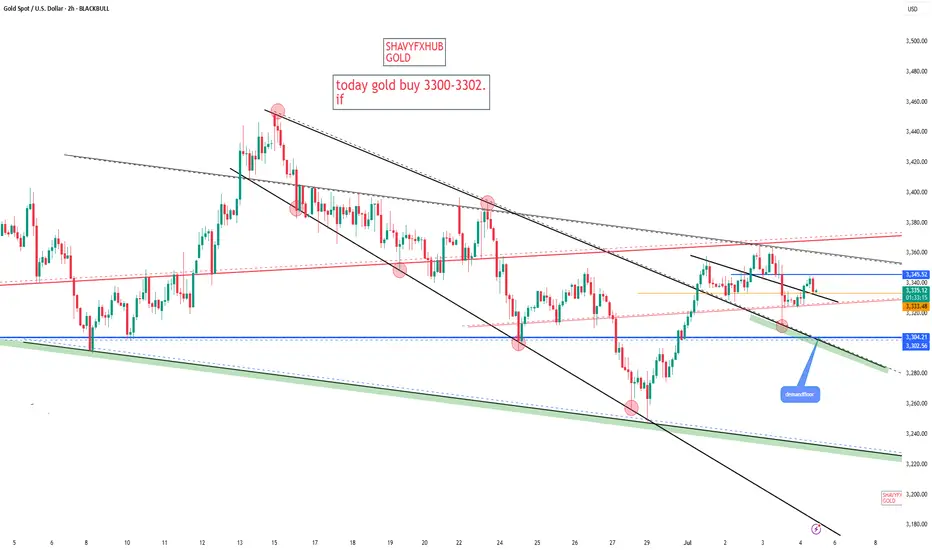
GOLD GOLD ,am watching 3300-3302 demand floor ,the confluence look strong,
the reason for this buy is based on a second retest to a broken descending trendline and a strong horizontal support.
pls watch the price action of US10Y AND DXY BEFORE ACTING.

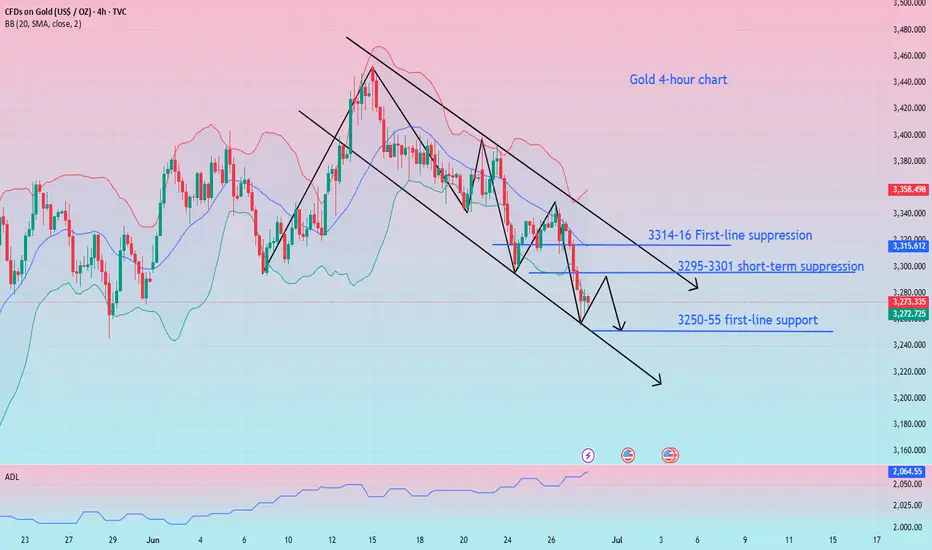
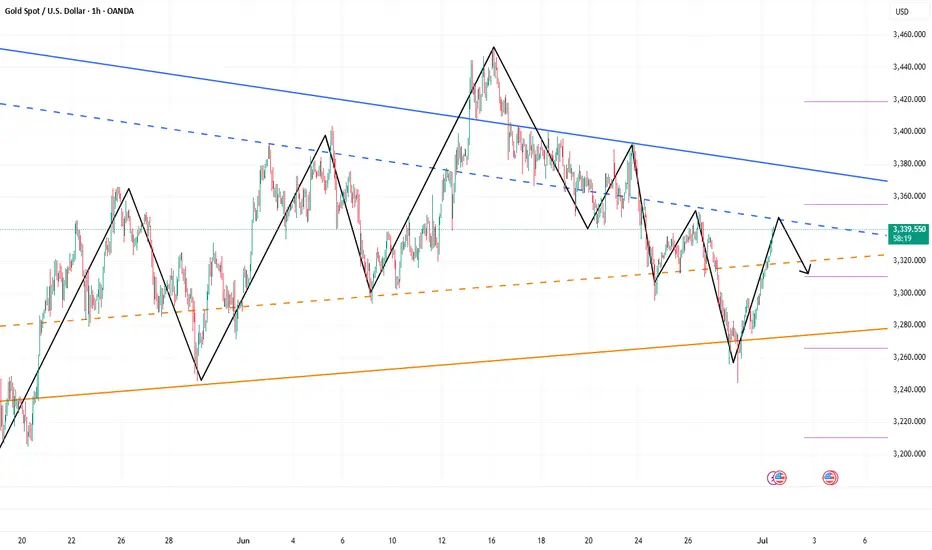
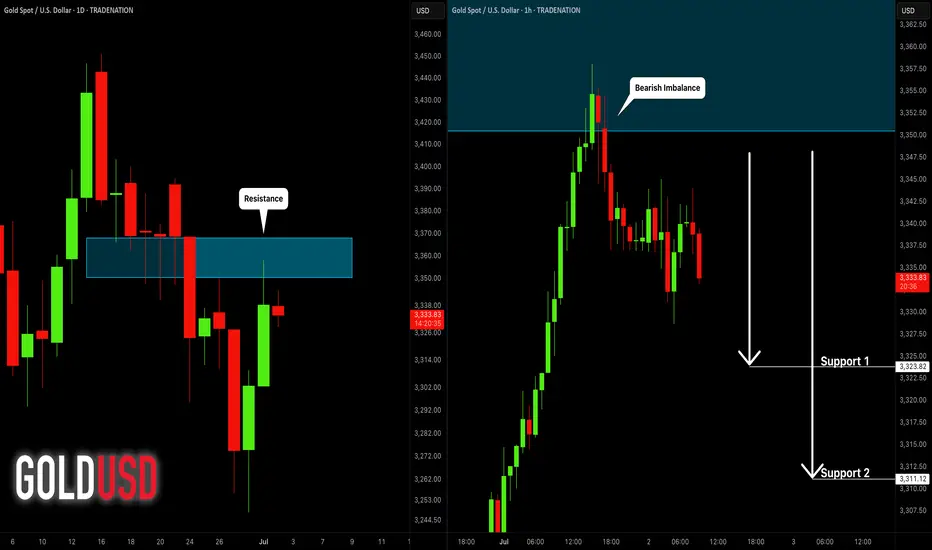
Gold fluctuates upward. Is the decline over?On Monday, gold opened at around 3282, and then fell back quickly to around 3247 under pressure; the downward low was blocked, and then rebounded strongly to around 3297; the market currently maintains a small upward trend.
At present, we need to focus on the resistance range of the upward trend.
From the 4-hour chart, the upper short-term resistance is around 3295-3300, followed by the suppression range of 3310-3315. The main direction of short-term operations maintains the rebound short-selling strategy. The support below is around 3255; the overall short-term operation relies on 3260-3300 to maintain the main tone of high-altitude participation unchanged.
Operation strategy:
Short near 3305, stop loss 3320, profit range 3270-3260.
A new week has just begun. I wish you all gain something from the market fluctuations.
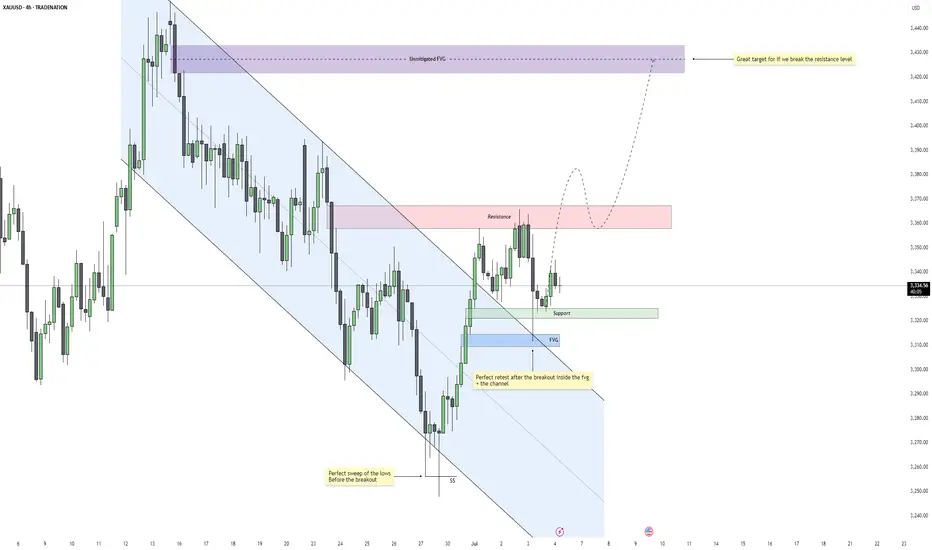
Gold – Is $3430 the Next Target After This Breakout?Gold recently completed a clean sweep of the 4H swing lows, taking out downside liquidity just before breaking out of a well-defined descending channel. This move marked a shift in momentum and structure, suggesting that the bearish leg may have concluded and the market is now transitioning into a more bullish phase.
Breakout Confirmation and Retest Zone
Following the breakout, price retraced and tapped directly into a confluence area where a fair value gap aligns with the upper boundary of the broken channel. This acted as a high-probability retest zone, and the reaction was strong. The market respected this structure perfectly, adding conviction to the breakout's validity.
Support and Resistance Dynamics
Currently, price is hovering between a nearby support level and a short-term resistance zone above. The support is holding firm after the retest, while the resistance is capping upward momentum for now. This is a healthy consolidation following the breakout, and it provides a clear structure for monitoring continuation.
Imbalance Target and Flow Outlook
Should the market gain enough strength to break through the overhead resistance, there is a large unmitigated imbalance further above that stands as a strong magnet. It represents a clean fair value gap left behind during the previous selloff and could be the next major draw if bullish momentum continues.
Overall Flow and Trade Logic
The sequence is very clean: sweep of liquidity, bullish breakout, efficient retest, and now consolidation above support. As long as price continues to form higher lows and respect the current structure, the probability of further upside remains favorable. Patience around the resistance area will be key for confirmation.
Conclusion
Gold is displaying a textbook reversal setup driven by liquidity and structure. If the current support continues to hold and buyers reclaim control above resistance, the path toward the upper imbalance becomes highly probable. The market is aligned for continuation, with bullish momentum building gradually.
Disclosure: I am part of Trade Nation's Influencer program and receive a monthly fee for using their TradingView charts in my analysis.
___________________________________
Thanks for your support!
If you found this idea helpful or learned something new, drop a like 👍 and leave a comment, I’d love to hear your thoughts! 🚀
Go short before breaking 3350, go long before falling to 3320📰 News information:
1. Geopolitical situation
2. Tariff implementation and interest rate cut bill
📈 Technical Analysis:
As I said, the US stock market closed early today, and the market will lack some momentum. It is difficult to have a large fluctuation. It is expected to fluctuate and consolidate. I also explained in the previous post that the upper pressure in the short term is at 3340-3350. If it is touched, we can try to short and defend 3360. If it falls back to 3323, we can try to go long for the first time. If it continues to fall, it is expected to reach 3315-3305. Therefore, if it first touches 3323, go long, SL 3316, and consider going long if it touches 15-05 below.
🎯 Trading Points:
SELL 3340-33350
TP 3330-3320-3310-3300
BUY 3323
TP 3333-3340-3350
BUY 3315-3305
TP 3325-3333-3340
In addition to investment, life also includes poetry, distant places, and Allen. Facing the market is actually facing yourself, correcting your shortcomings, confronting your mistakes, and strictly disciplining yourself. I hope my analysis can help you🌐.
TVC:GOLD OANDA:XAUUSD FX:XAUUSD FOREXCOM:XAUUSD PEPPERSTONE:XAUUSD FXOPEN:XAUUSD
Gold Is Set to Bottom Out and Rebound This WeekGood morning, everyone!
At today’s open, gold once again dipped into the 3258–3248 buy zone, then rebounded toward 3270. From a structural perspective, gold has clearly entered a downward trend, but this decline is unlikely to be one-directional—short-term rebounds and consolidations are expected along the way.
Based on my experience, below 3250 remains a favorable area for initiating long positions. Whether the price rebounds directly or continues lower before building a stronger base to challenge 3300 again, the broader outlook remains bullish as long as the 3200 support holds. A bottoming reversal this week is still the more probable scenario.
As such, the focus early this week should be on buying near the lows, with short opportunities on rebounds as a secondary strategy. Monitor key support levels for signs of strength.
This week is also packed with important data—including PMI, Non-Farm Payrolls (NFP), and the unemployment rate, in addition to regular economic releases. Given the current macroeconomic backdrop, significant market volatility is expected—bringing both risk and opportunity. Manage your exposure carefully and stay adaptable.
Mastering Delta–Volume Divergence
🎓 Mastering Delta–Volume Divergence: How to Read Institutional Absorption and Trap Setups
⸻
1️⃣ What Is Delta?
Delta measures the net aggression between buyers and sellers:
• Market Buys: traders lifting the ask
• minus
• Market Sells: traders hitting the bid
✅ Positive Delta indicates stronger buying pressure.
✅ Negative Delta indicates stronger selling pressure.
Delta shows who is initiating trades, not just that trading is occurring.
⸻
2️⃣ What Is Volume?
Volume measures the total number of contracts traded, regardless of who initiated them.
Every matched buy and sell contributes equally to volume.
Volume reveals activity, but not who controls the move.
⸻
3️⃣ What Is Delta–Volume Divergence?
Delta–Volume Divergence occurs when:
✅ Volume is high (lots of trades happening),
✅ But Delta is near zero (neither side dominates).
This signals:
• Intense two-sided activity between buyers and sellers,
• Strong participation on both sides,
• Passive absorption—institutions quietly filling large orders without moving price significantly.
⸻
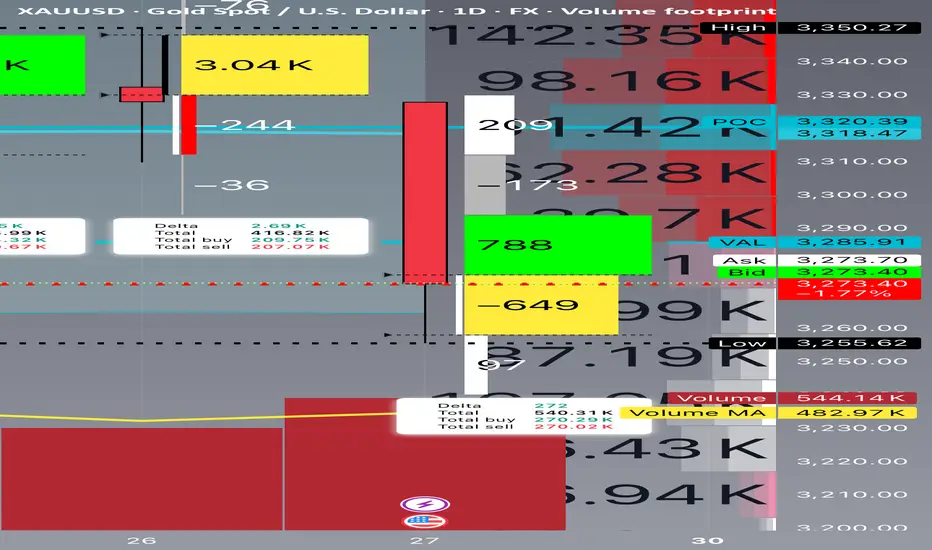
4️⃣ Chart Breakdown – Bar by Bar
Below is a clear example of this concept in practice, reviewing each daily bar from your footprint chart:
⸻
🔴 June 24
• Delta: -8,240 (strong net selling)
• Volume: 575,720 (very high)
• Interpretation:
• Heavy, aggressive selling.
• Clear trend-confirming action.
• No divergence.
⸻
🟢 June 25
• Delta: +4,650 (net buying)
• Volume: 343,990 (moderate)
• Interpretation:
• Counter-trend buying or short covering.
• Less volume and less conviction.
⸻
🟢 June 26
• Delta: +2,690 (mild net buying)
• Volume: 416,820 (higher)
• Interpretation:
• Rising volume but weaker delta.
• Early sign of balance developing.
• Possible absorption beginning.
⸻
🟨 June 27 (Critical Bar)
• Delta: +272 (near zero)
• Volume: 540,310 (very high)
• Interpretation:
• Huge volume churn.
• Neither buyers nor sellers in control.
• Likely institutional absorption of aggressive orders.
✅ This is a textbook example of Delta–Volume Divergence.
⸻
5️⃣ Why This Matters
Professional Insight:
• Sellers had been aggressive for several sessions.
• Suddenly, volume remained elevated, but delta flatlined.
• This suggests:
• Exhaustion of selling aggression, or
• Institutional accumulation and passive positioning.
This often sets the stage for:
• A trap reversal (short squeeze), or
• A continuation flush if sellers regroup and push lower.
⸻
6️⃣ Confirmation Scenarios
Scenario A: Bearish Continuation
• Watch for renewed strong negative delta (e.g., -5,000 or worse).
• Price remains below the last support (~3,250).
• Confirms absorption failed and sellers remain dominant.
Scenario B: Short Squeeze Reversal
• Price reclaims the VAL (~3,285–3,300).
• Delta flips strongly positive (+5,000 or more).
• Trapped shorts begin covering, driving price back toward supply.
⸻
7️⃣ Common Misinterpretation
⚠️ High volume alone does NOT mean momentum.
Key Point:
If delta is flat, high volume simply means churn, not directional energy.
This is why inexperienced traders often get caught:
• They see heavy volume and assume a breakout is underway.
• In reality, the market is absorbing liquidity to trap both sides.
⸻
8️⃣ Professional Tips for Trading Divergence
✅ Wait for confirmation before entering:
• Clear delta shifts, and
• Price reclaiming or rejecting key levels.
✅ Be aware of stop zones:
• Under recent lows if buyers fail,
• Above recent range if sellers get exhausted.
✅ Avoid trading during pure churn without clear follow-through.
⸻
9️⃣ Quick Recap
✅ Delta–Volume Divergence: High volume, flat delta, no clear directional control.
✅ Typically signals absorption and position buildup.
✅ Requires confirmation before committing to trades.
✅ Recognizing it helps you avoid traps and false breakouts.
⸻
🔟 Final Thought
Learning to read divergence is what separates professional traders from retail:
“Volume tells you how hard the market is working. Delta tells you who’s winning.”
Combine both to see the hidden game behind every price bar.
⸻
⚠️ Disclaimer: This lesson is for educational purposes only. Nothing here constitutes financial advice.
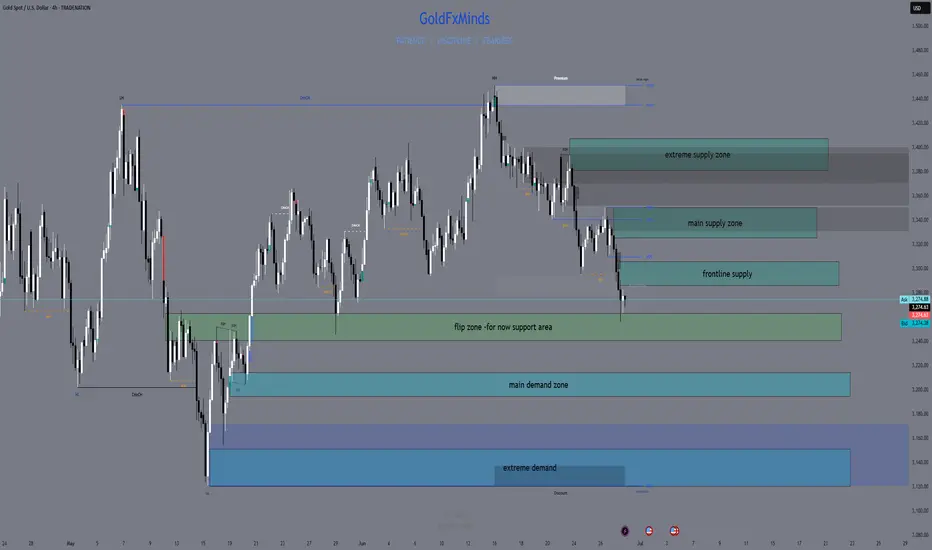
H4 Outlook | XAUUSD Monday • June 30 • 2025Hey fam,
Fresh week on gold — clean structure, clean levels, clean execution ahead. Forget the noise. We trade price, we trust precision.
🔍 Market Flow & Bias
Gold remains bearish on the H4 timeframe.
Lower highs, lower lows, clean rejection from supply, and all EMAs (21/50/200) aligned down. RSI hovers near 30, showing heavy momentum — not exhaustion yet.
Price is coiled, not crushed. If structure holds, we follow the short flow into deeper zones.
📌 Bias: Bearish below 3325. Pullbacks into supply = opportunity.
—
🧱 Zones of Interest (Clean & Confluent)
🔺 Zone 1 – 3380–3405 | Extreme Supply
Top OB zone with resting liquidity above. If price sweeps this level and fails, expect a sharp reversal. Only valid with reaction (CHoCH or bearish engulfing).
🔺 Zone 2 – 3325–3350 | Main Supply
Strong H4 breaker block. Origin of the last major selloff. Already defended once — if it holds again, look for sniper shorts from within.
🔺 Zone 3 – 3285–3305 | Frontline Supply
First inducement zone. Clean micro-OB that could give early fade trades. If bulls break through, Zone 2 becomes magnet.
⚖️ Zone 4 – 3260–3240 | Flip Shelf
Range base. If price holds, bulls might step in short-term. But a clean break below shifts momentum fully toward lower demand.
🟢 Zone 5 – 3215–3195 | Main Demand
Unmitigated OB with imbalance. If gold drops here with momentum and forms rejection wicks or CHoCH on LTF → long opportunity for bounce.
🟢 Zone 6 – 3150–3120 | Extreme Demand
Macro swing demand. Deepest discount level on the chart. Valid only if market flushes — this is the “last stand” for buyers.
—
🎯 Key Levels Zone Cheat-Sheet
Above
• 3380–3405 → Extreme Supply (trap zone)
• 3325–3350 → Main Supply block
• 3285–3305 → Micro OB inducement
Below
• 3260–3240 → Flip shelf (structural pivot)
• 3215–3195 → Main buy zone
• 3150–3120 → Deep macro demand
—
⚔️ Execution Plan
We sell from reaction zones, not assumptions.
We buy from confluence, not hope.
Every zone above comes with condition: no confirmation, no entry.
—
📣 Found this useful?
Drop a ⚔️ in the comments, tag your bias, 🚀and follow GoldFxMinds for sniper-level execution.
This isn’t guessing. This is structure. This is clarity.
GOLD (XAUUSD): Bearish Move From Resistance
Gold went overbought after a test of a key daily resistance cluster.
A formation of multiple bearish imbalance candles on an hourly time frame
signifies a local dominance of the sellers.
The price will continue retracing at least to 3323 support.
❤️Please, support my work with like, thank you!❤️
I am part of Trade Nation's Influencer program and receive a monthly fee for using their TradingView charts in my analysis.
Gold non-agricultural layout strategy
💡Message Strategy
Small non-farm data "big surprise"
The ADP employment report released on Wednesday showed that the number of private employment in the United States decreased by 33,000 in June, the first decline since March 2023. Economists surveyed previously expected the number to increase by 100,000 on average.
The ADP employment report showed that the number of private employment in the United States fell for the first time in more than two years in June, indicating that the Federal Reserve may cut interest rates as early as September.
Spot gold closed up $18.20 on Wednesday at $3,356.90 per ounce.
Bednarik pointed out that gold has gained upward momentum recently, with a gold price target of $3,373.50 per ounce. The "big surprise" of the ADP data suggests a weak non-farm payrolls report in June.
📊Technical aspects
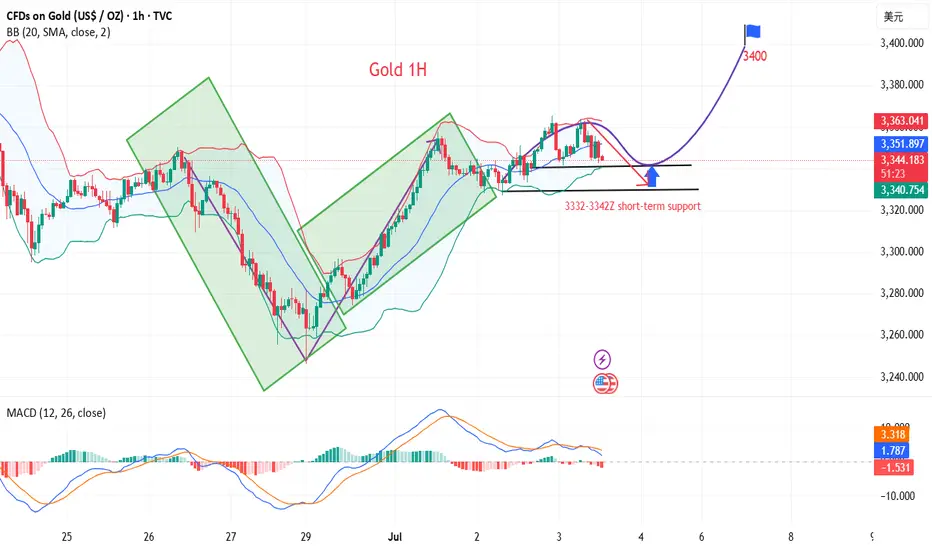
1. The daily line was the support line for the rise in the previous month. It fell back very hard last week and turned into suppression. It was tested repeatedly and finally a big Yin hit the lower track of the pattern. However, it started at a low point this week and rose steadily. Now it has returned to the top of the lifeline again. At this point, the space will consider switching again.
2. The four-hour pattern opens slightly upward, with the lifeline 3330 as the dividing line between strength and weakness. Hold here and climb upward step by step.
3. The double lines on the hourly chart formed a dead cross after breaking through and turning into pressure last week, which helped to further increase the volume and fall by more than 100 US dollars. After breaking through and standing on it this time, it turned into support. The double line range is 3332-3342. This area is used as the boundary to switch between the upper and lower spaces. The support line for the bulls to dominate is the upper rail position of 3332, and the support line for the bulls to sweep is the lower rail position of 3316
💰Strategy Package
Long Position:3332-3340,SL:3316,Target: 3400
Gold bullish SetupAs per my analysis gold is making inverted Head n Shoulder. we all know the break of this pattern is Bullish scenario. Fundamentally gold is bullish due to instability in world and dollar is going weak. Technically gold sweep the liquidity and makin HH n HL. Seasonality also tell us gold is bullish in month of July.
XAUUSD - Breakdown: - RISK OFF - Gold Bears Part IV - Complete TVC:GOLD buyers got flushed all week 💥
Big Boy sells only.
Sometimes you’ve got to put your balls on the line and call it ahead — no hesitation.
New Ideas next week, Thank you and keep supporting!!
We did just that.
#Trump #DXY #Gold #XAUUSD #Dollar #Metals #CommodityTrading #KeepGoing #SmartMoneyMoves
Gold is near the 0.618 levelGold is near that 0.618 level, going to watch it closely from here. We might not get an entry until Sunday at 6pm NY time when market open.
Key Level to watch 3249, 3194
We need SPY / ES to come down for gold to gain momentum.
GOLD GOLD, we will watch every price action and respond accordingly ,from the lower zone am watching 3300-3302 descending trendline break out retest which will likely be in the 3300-3302 level and the fib is giving 0.63 fib.in addition to that i have a horizontal support to back my back my buy bias.
NOTE that H4 of gold is giving bearish after rejecting 3364 yesterday.
trading is 100% educated probability.
trade with caution and know that any key level can fail.
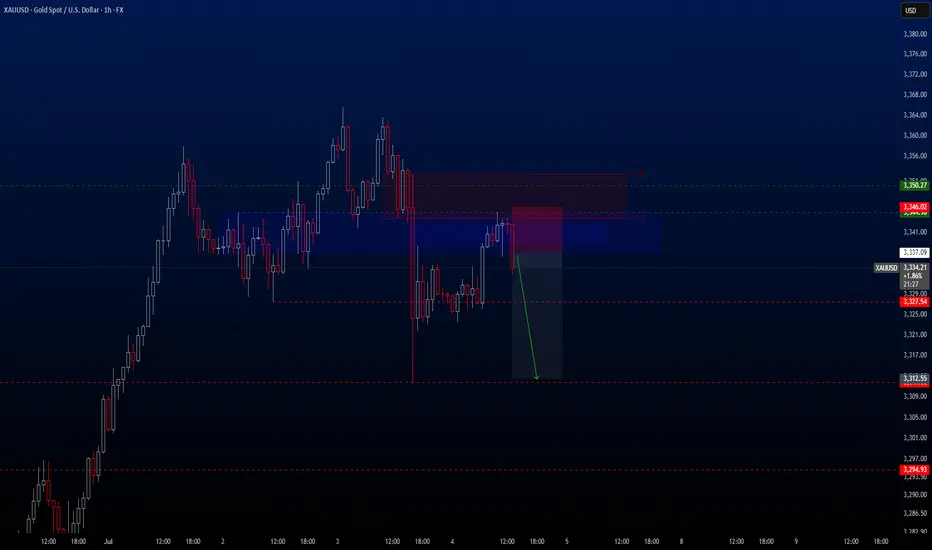
XAUUSDHello traders. After a short break, we’ve identified a promising sell opportunity on the XAUUSD pair.
Despite the U.S. Independence Day holiday, I believe we may still see solid movement in gold during today's session.
🔍 Trade Details
✔️ Timeframe: 1-Hour (H1)
✔️ Risk-to-Reward Ratio: 1:2.70
✔️ Trade Direction: Sell
✔️ Entry Price: 3337.09
✔️ Take Profit: 3312.16
✔️ Stop Loss: 3345.63
🕒 If momentum fades or the price consolidates in a tight range, I will keep this trade open only until 23:00 (UTC+4). After that, I’ll close it manually—whether in profit or loss—depending on how price action evolves.
🔔 Disclaimer: This is not financial advice. I’m simply sharing a trade I’ve taken based on my personal trading system, strictly for educational and illustrative purposes.
📌 Interested in a systematic, data-driven trading approach?
💡 Follow the page and turn on notifications to stay updated on future trade setups and advanced market insights.
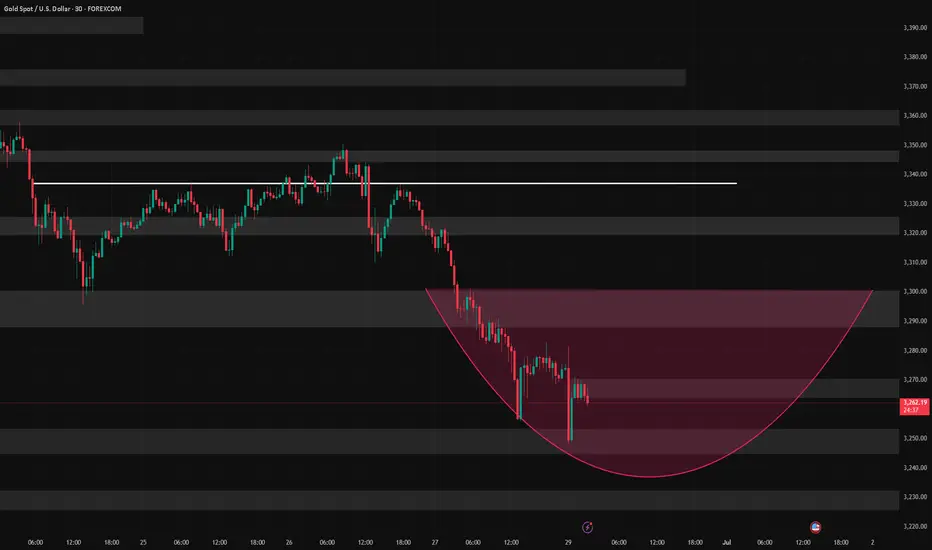
Gold may collapse again, don't get buried in it!In the past two trading days, gold began to rebound from a low of around 3245, and has now rebounded to around 3358, with a rebound of up to $113. Moreover, there has been no significant retracement during this rebound, indicating that gold has little intention to fall, and may even continue to rise.
But for me, gold rebounded from 3245. Even if a double bottom structure with 3275 as the secondary low was constructed on the technical level, it should not be enough for gold to rebound more than $113 in just two days as it fell below many supports in the early stage and bullish confidence suffered a serious blow. Moreover, it happened before the uncertain news of the NFP market.
So I have to consider that the market did it deliberately, and its primary purpose was to kill a large number of short chips in the market and lure more attracted long chips; secondly, the sharp rise before the NFP market may be to reserve room for the NFP market to fall in advance; in addition, I have to consider that the US dollar has fallen to a three-year low. If it continues to fall, there may be a global crisis of confidence in the US dollar, and the oversold rebound demand for the US dollar will also suppress gold.
Therefore, I still will not advocate chasing the rise of gold for the time being; on the contrary, I will actively seek opportunities to short gold in the 3350-3370 area; and once gold turns to a downward trend again, it may at least test the 3325-3315-3305 area downward in the short term.