XAU/USD M5 – Bearish Fib Retracement & Downtrend Continuation SeXAU/USD M5 – Bearish Fib Retracement & Downtrend Continuation Setup
Gold is currently testing the Fibonacci 0.236–0.382 retracement zone after a clean bearish leg, aligning with the descending channel structure. Price is now forming a possible lower high, hinting at a potential continuation of the intraday downtrend.
🔍 Key Technical Highlights:
Bearish Market Structure: Price remains inside a well-respected descending channel, respecting both lower highs and lower lows.
Fibonacci Confluence: Retracement into the 0.236–0.382 zone (around $3,345 – $3,347) may act as a resistance.
Rejection Expected: Small distribution forming near $3,347 inside the channel resistance.
Downside Targets:
1.0 extension: ~$3,338
1.618 extension: ~$3,330
Extended target: Lower channel boundary
📊 Trade Setup:
Bias: Short (scalp/intraday)
Sell Area: $3,345 – $3,347 (Fibonacci + structure confluence)
Stop Loss: Above $3,350
Target: $3,330
Risk:Reward: ~1:3 (depending on entry)
🧠 Tactical Note:
Watch for a break and retest below $3,343–3,342 demand zone (purple box) to confirm continuation. A breakout from the descending channel would invalidate this scenario.
XAUUSD.F trade ideas

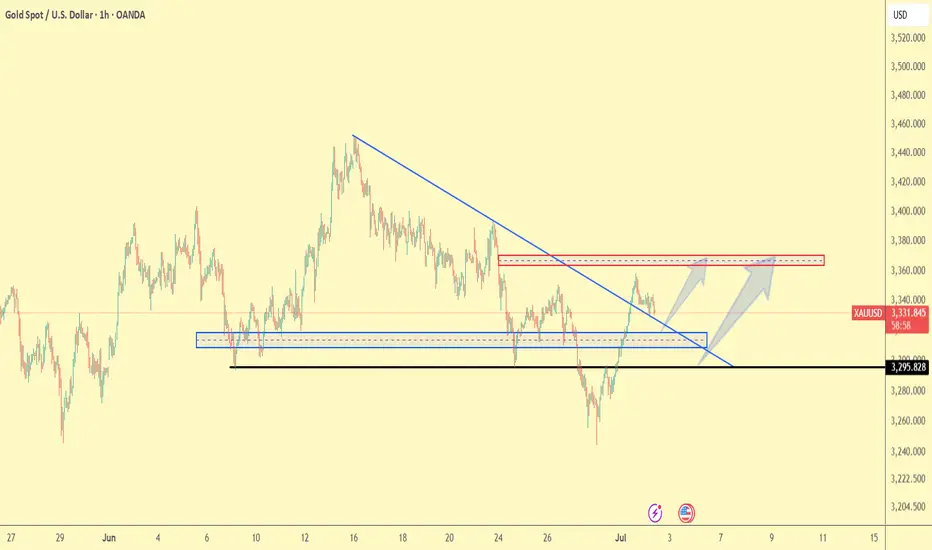
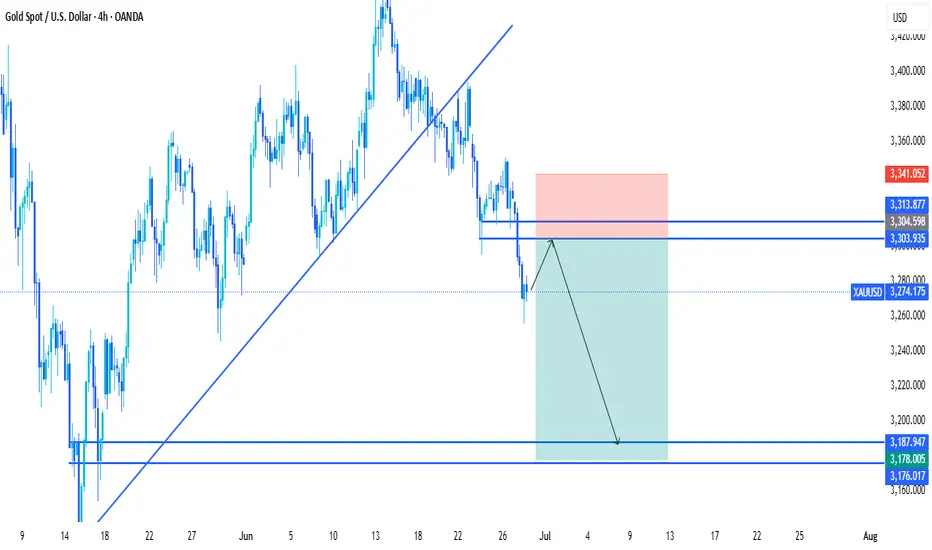
Gold Trade Plan 02/07/2025ِDear Traders,
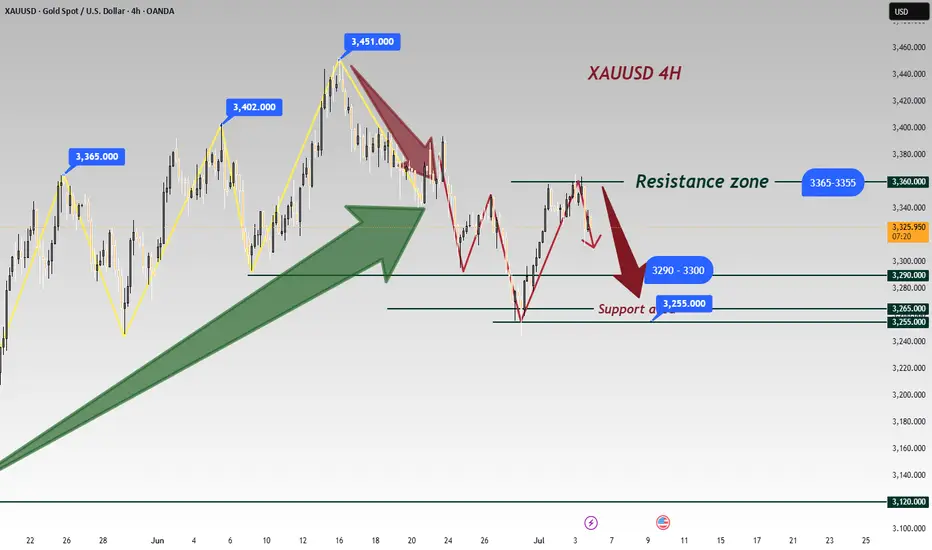
On the 1-hour chart of XAUUSD (Gold vs. USD), we observe a breakout of the descending trendline, followed by a successful pullback and continuation to the upside.
The blue demand zone around 3295–3310 acted as a strong support and triggered a bullish move.
As long as the price holds above this support, we expect the uptrend to continue, targeting the resistance areas between 3360–3375 and potentially up to 3390–3400.
The RSI has pulled back from the overbought zone but is still holding above the 50 level, supporting the bullish sentiment.
📌 Conclusion:
If the price holds above the support zone, further upside towards the resistance zones is likely. If the support fails, the bullish scenario may be invalidated for now.
Regards,
Alireza!
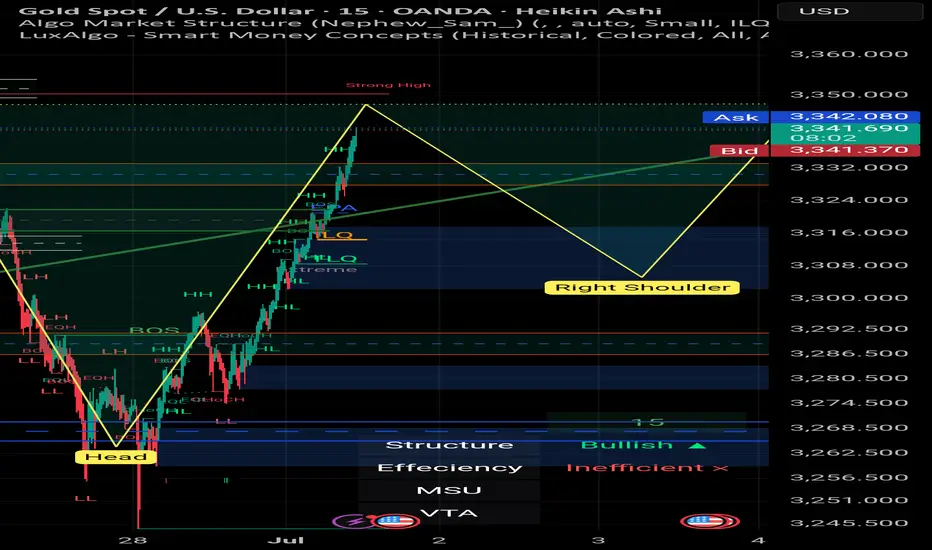
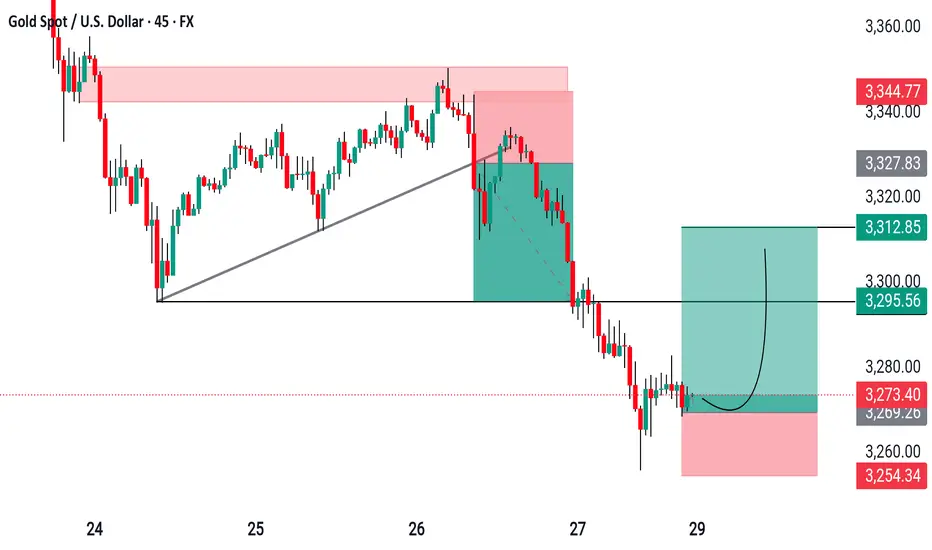
Below of last update of reverse head and shoulder post XAU/USD | 30min | by Mohsen Mozafari Nejad
🔸 **Instrument:** Gold / USD (XAU/USD)
🔸 **Timeframe:** 30min
🔸 **Methodology:** Smart Money Concepts (SMC) + Liquidity + OB + Market Structure
🔸 **Focus:** New Monthly Open Setup
🔍 Market Context:
---
## 🧠 Technical Breakdown:
1. **Strong recovery** after clearing deep liquidity sweep (Head zone)
2. **Bullish BOS** structure confirmed on LTF → Multiple HH and HL formed
3. Price now testing **Key Supply/OB zone at 3300–3315**
4. Above this zone lies a **Strong High (SH) around 3,350**, a potential liquidity magnet
5. Overall bias is bullish unless strong rejection appears from upper OB
---
## 📌 Trade Plan:
| Position | Entry Confirmation Zone | Stop Loss (SL) | Take Profit (TP) |
|----------|--------------------------|----------------|------------------|
|
| Short (scalp only) | Bearish reaction from 3,345–3,350 | Above 3,353 | TP1: 3,310 / TP2: 3,290 |
---
## ⚠️ Risk Factors to Watch:
- 🔺 High-impact USD news (July 1st releases: Manufacturing PMI / employment preview)
- 🔺 Overextension above supply zone without support → trap risk
- 🔺 Bull trap risk if price spikes above 3,340 then sharply reverses
---
## ✅ Summary:
> **Start of July** could fuel volatility and directional momentum.
> The structure is clearly bullish short-term, but upper liquidity zones remain **highly reactive**.
> Smart traders will wait for reaction at the 3,340–3,350 SH zone before overcommitting.
**Structure:** 🔴 bearish momentum
**Efficiency:** ✅ Clean
**Liquidity:** 🔺 Above SH & Below recent HL
📊 Prepared by: **Mohsen Mozafari Nejad**
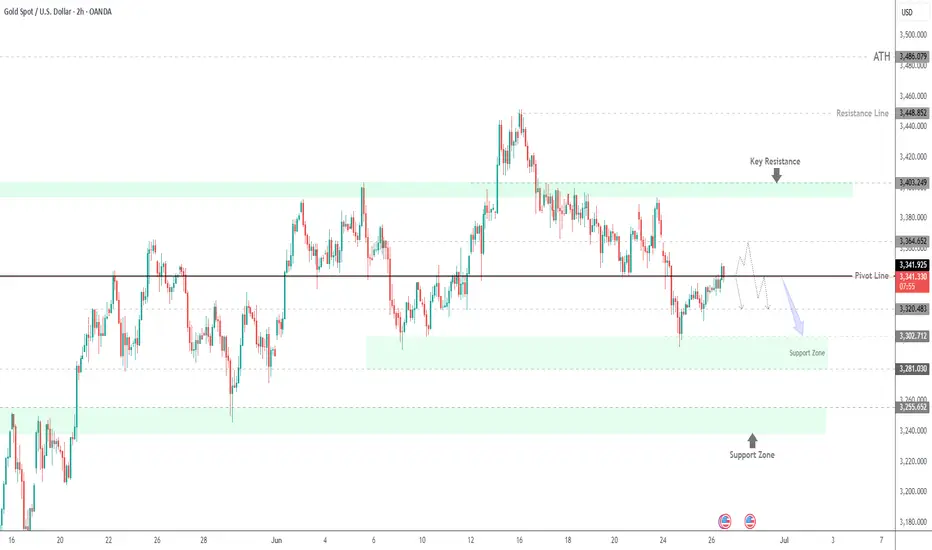
Gold Holds Above $3340 as Dollar Drops and Fed Uncertainty Rises GOLD OVERVIEW
Gold Holds Gains as Dollar Weakens and Fed Uncertainty Grows
Gold climbed above $3,340 per ounce on Thursday, supported by a sharp decline in the U.S. dollar amid growing dovish expectations from the Federal Reserve.
Adding to market speculation, U.S. President Donald Trump hinted he may announce a new Fed Chair as early as September or October, potentially reducing Jerome Powell’s influence before his term ends in June and boosting expectations for a more accommodative policy stance.
TECHNICAL OUTLOOK – XAU/USD
Gold shows bearish potential if the price can stabilize below the pivot level at 3,341.
However, while trading above 3,341, a short-term correction toward 3,364–3,365 is likely before any renewed selling pressure.
Today’s U.S. GDP release may add further volatility and direction to the market.
Key Levels
Pivot Line: 3,341
Resistance: 3,364 → 3,373
Support: 3,320 → 3,302
previous idea:
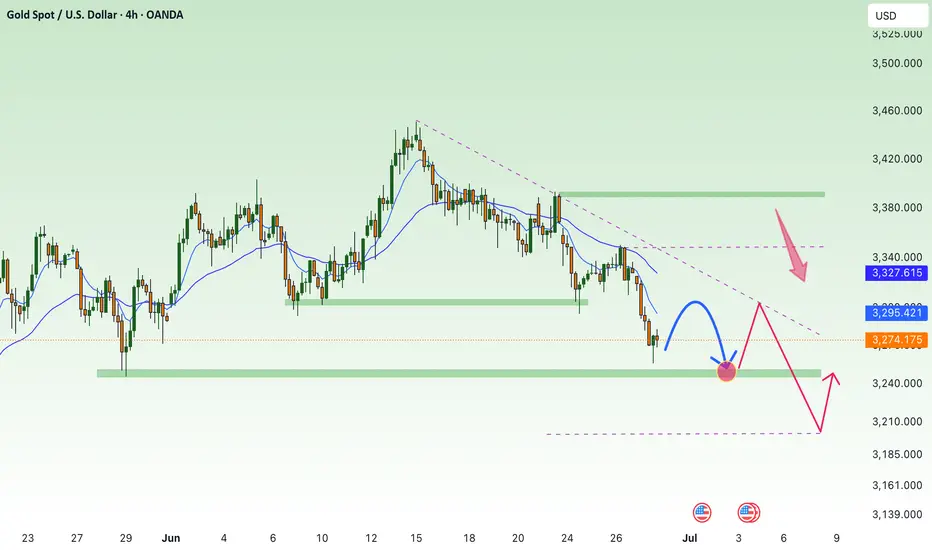
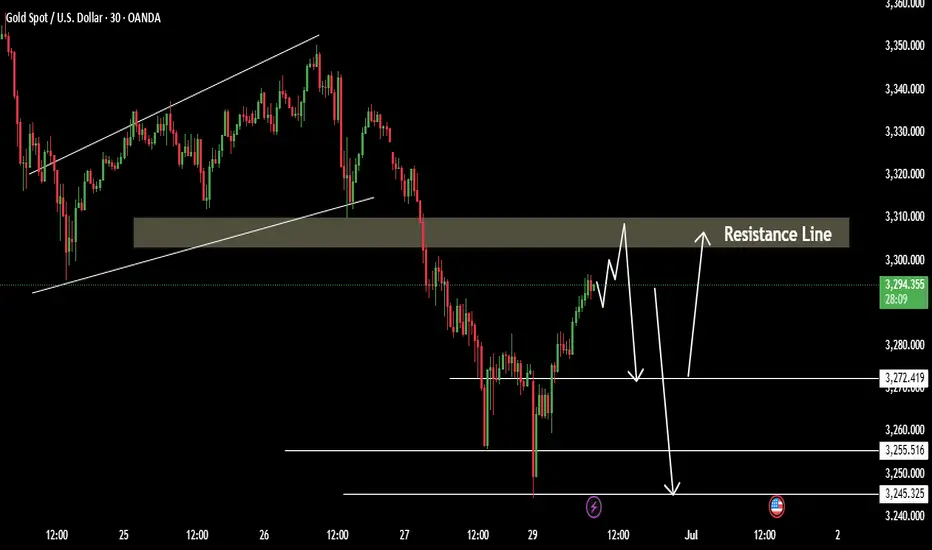
Gold has shown signs of recovery DowntrendXAUUSD Gold Technical Outlook – June 30
Gold has shown signs of recovery at the start of the session, largely supported by a weaker U.S. dollar. However, the upside remains uncertain as long as the price stays below key resistance zones.
Gold is still in a downtrend Price action suggests a potential correction phase Key resistance area lies between 3294 – 3312 Failure to break this zone keeps the bearish pressure intact.
If the price fails to hold above 3272, further downside targets are
Key Levels:
Resistance: 3294 / 3305 / 3312
Support: 3272 / 3255 / 3245
You may find more details in the chart Ps Support with like and comments for better analysis share with you.
XAUUSD:Today's Trading Strategy
Gold retreated in the sub-session, I have personally increased my long position near 3331, the overall trend is bullish unchanged, the median strategy is patient to rise. If you are trading short, you can go long at 3325-3330 and leave at 3340-45. The same can be said if you want to solve the problem; Trade according to your trading preferences and risk tolerance.
More detailed strategies and trading will be notified here ↗↗↗
Keep updated, come to "get" ↗↗↗
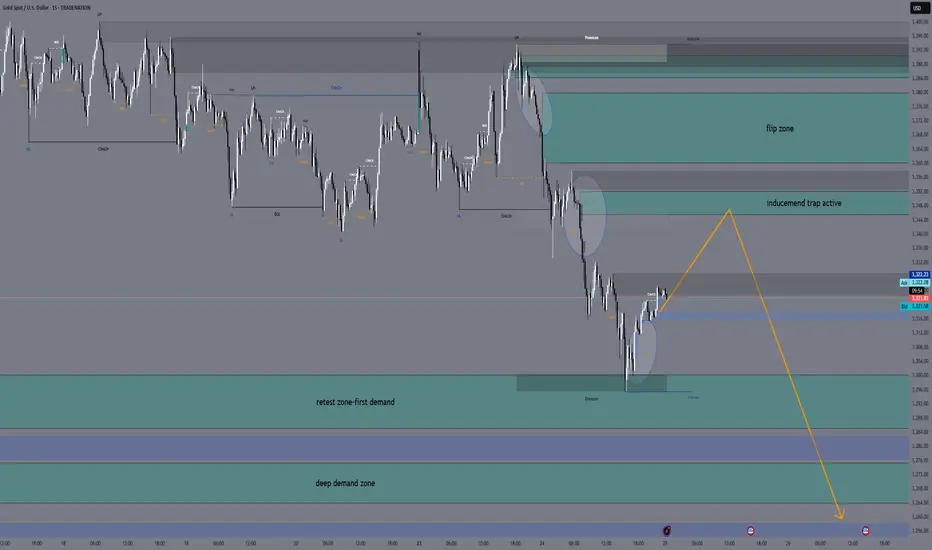
XAUUSD Daily Sniper Plan – June 25, 2025👋👋 Hello traders!
Gold is still moving down strongly. Today’s plan is made for traders who want clear and precise levels. Let’s look at the structure, important zones, and where to watch for trades.
1. Higher Timeframe Overview (Daily, H4, H1)
Daily: Price is falling near the 200 EMA around 3323. RSI shows less buying strength. We wait for a clear move.
H4: The trend is down with lower highs at 3418 and lower lows at 3311. RSI is low, showing weak buying. Price is near the 200 EMA.
H1: Small bounce up to 3328–3332 resistance. RSI is weak, so price must break this zone to move higher.
2. Lower Timeframe Details (M30, M15)
M30: EMA5 crossed above EMA21 but price is near resistance at 3328–3332. RSI is neutral.
M15: Price broke a small wedge up but is limited by EMA21 and EMA50. RSI near 58 shows price could be overbought.
3. Key Zones and How to Trade Them
🔻 Sell Zone: 3345 – 3352
Look for signs that price rejects this zone (wicks, bearish candles) before selling.
🟡 Flip / Decision Zone: 3360 – 3380
Do not trade here. This zone will show if trend changes. Wait for clear confirmation.
🟢 Buy Zone: 3300 – 3285
Look for price rejection and strong buying signs before buying here.
🟢 Deep Buy Zone: 3265 – 3272
Only buy here if price goes below 3280 and shows strength.
4. What to Do
Current price is about 3323.
If price goes above 3332, watch the sell zone 3345–3352 for a short trade.
If price drops below 3332, expect a move down to the buy zone 3300–3285.
Do not buy above 3360 without a clear trend change.
Be patient and wait for good signals.
5. Important Levels
Zone Price Range Notes
Sell Zone 3345 – 3352 Best short zone
Flip Zone 3360 – 3380 Wait and watch, no trades
Buy Zone 3300 – 3285 Good buy zone
Deep Buy Zone 3265 – 3272 Last buy chance
📣 If you like clear and simple plans, please like, comment, and follow
I’m part of Trade Nation’s Influencer Program and get paid to use their charts.
GOLD GOLD ,newyork gold dealers reacted early enough avoiding my aim sell zone of 3378-3385.
while we accept that price action will do what ever it wants ,so we accept the new cross at 3357 and took over 100pips from that bearish drop .
we are on a strong 2hr cross and a demand floor ,if we sustains above this level we could be buying above 3357 to test 3385-3378 which will expose 3400 .,but if buyers fail from this level we are going to sell in line with the sentiment of the market.
trading forex, commodities is based on probability

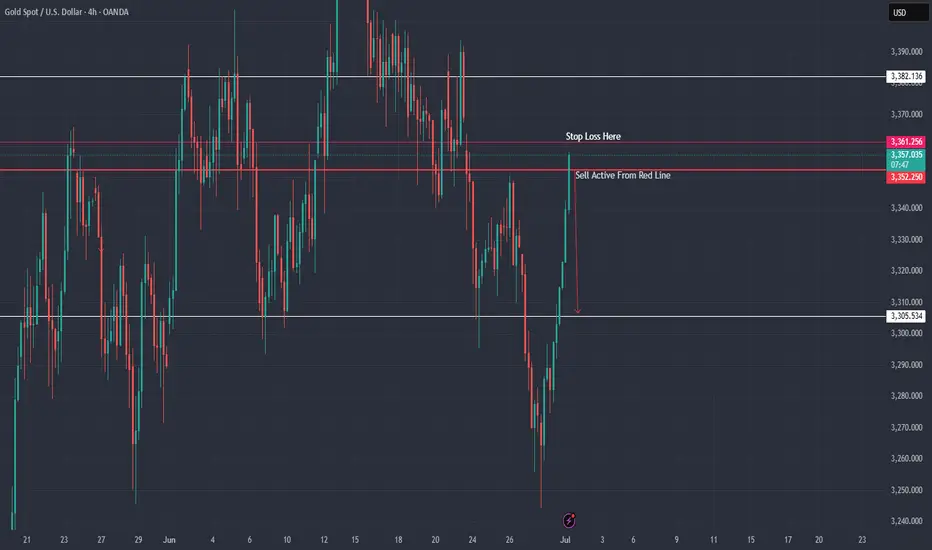
XAU / USD 4 Hour ChartHello traders. Just a quick update on my trade. I thought on the last 30 min. candle I was going to get taken out. Normally I would close half the trade to minimize loss but I am using a microlot size and I am going to let it ride. Let's see if we start pushing down or if my Stop Loss get hit. I am optimistic and looking for that push down to correct the move from the overnight sessions. Let's see how it plays out. Big G gets a shout out. Be well and trade safe.
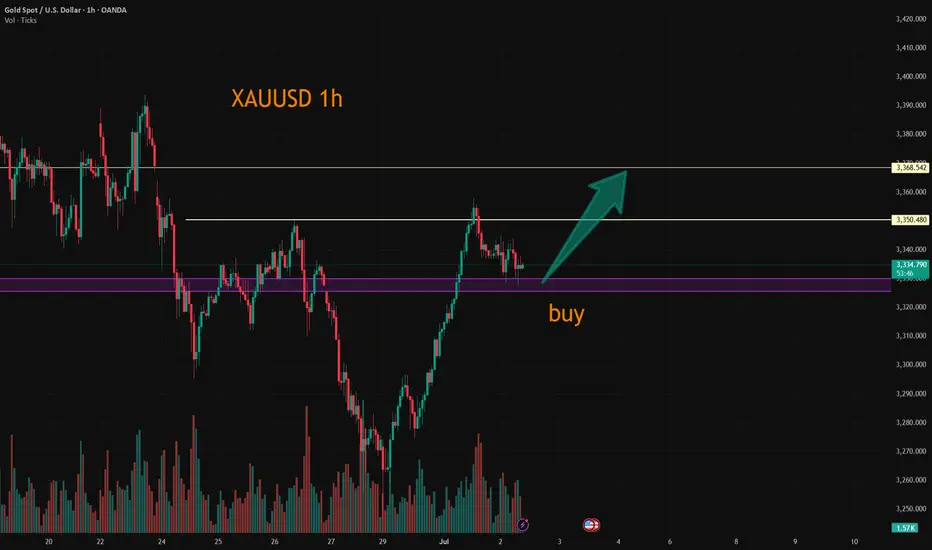
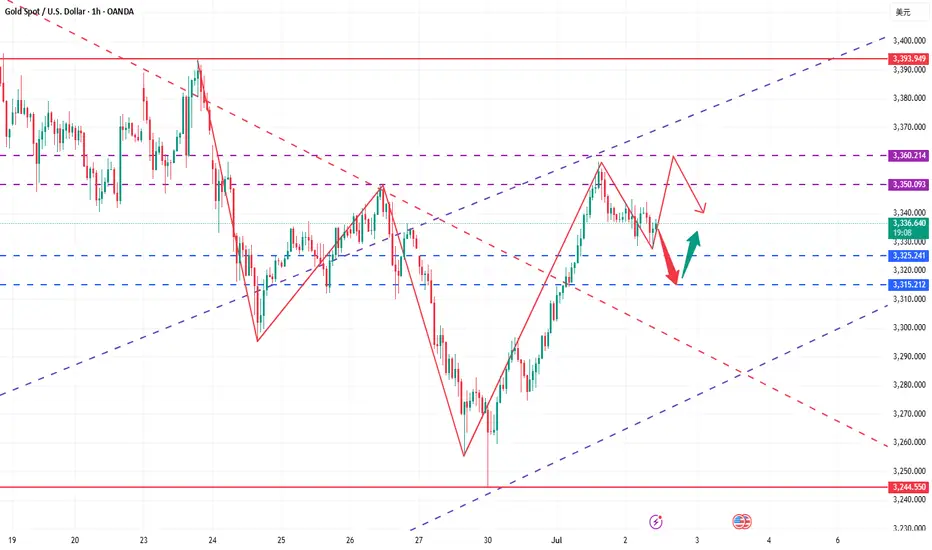
Gold Trade Plan 01/07/2025Dear Traders,
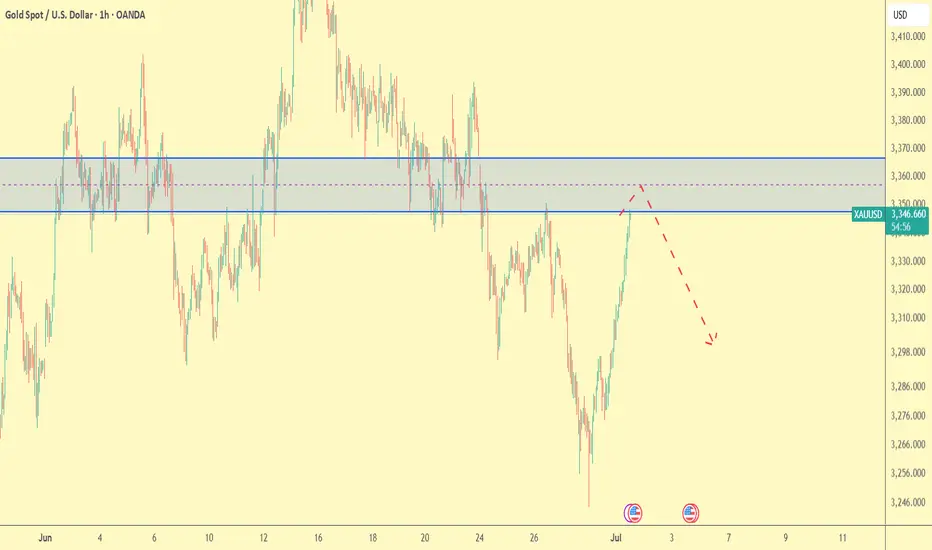
On the 1-hour timeframe for XAUUSD (Gold Spot vs. USD):
✅ The price has made a strong bullish move and is now testing a key resistance zone between 3345 and 3360. This zone has acted as both support and resistance in the past, making it a strong area of interest.
📉 We can observe upper wicks forming on the candles, suggesting buying pressure is weakening. The red dashed line on the chart indicates a potential bearish reversal scenario.
🔻 If the price fails to break and close above this resistance with strength, we could see a correction toward the 3290 to 3260 zone.
💡 Unless the price breaks above 3360 and closes strongly, long positions carry higher risk at the moment.
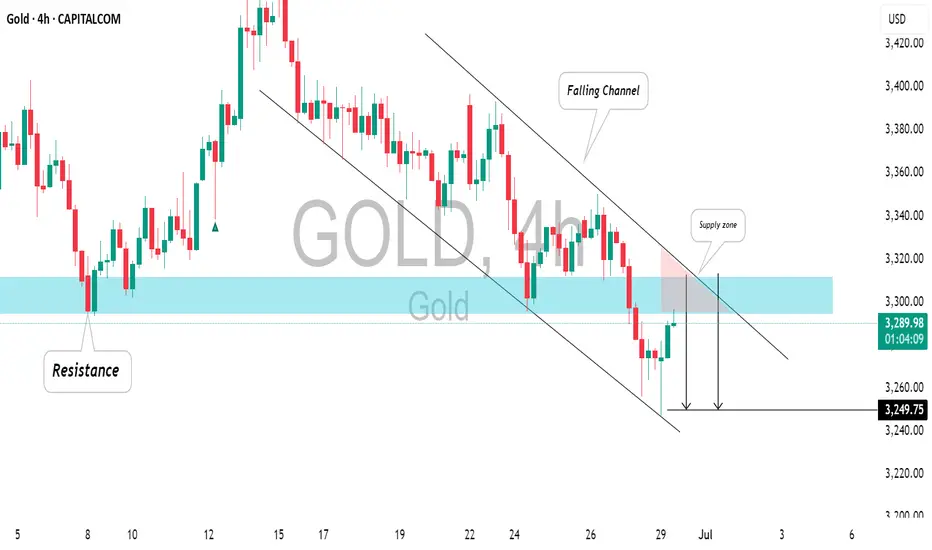
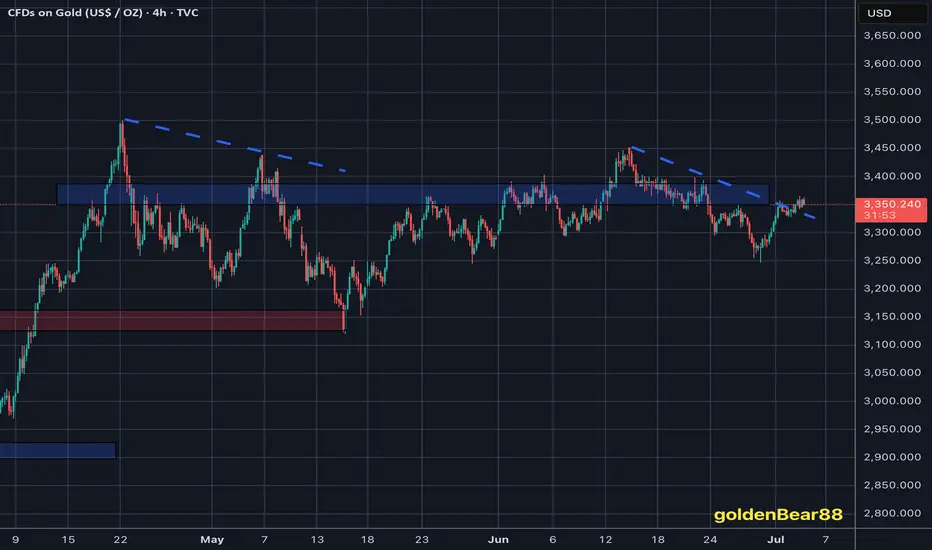
GOLD(XAUUSD): Bearish Trend Will Resume SoonGOLD appears to be bearish on an intraday chart following the violation of a key support zone.
The broken structure and descending channel resistance line now indicate a tightening supply area.
A significant bearish movement is likely to follow. The next support level is at 3249.
June Nonfarm Data: Gold PlungesThe US June nonfarm payrolls data is out: 147,000 jobs were added, exceeding the expected 106,000 and the previous 139,000, with slight upward revisions to the prior two months’ figures. The unemployment rate dipped from 4.2% to 4.1%, beating the forecast of 4.3%. While the US economy slows, the job market remains robust. 🌟
Post-data release, market bets on a July rate cut have evaporated, with the probability of a September cut dropping to around 75%. US stock futures extended gains, Treasury yields rose across the board, the US Dollar Index surged, and gold plunged nearly $40 in a short squeeze—signaling an unexpected major bearish hit to gold. Weng Fuhao advises trading with the trend, focusing on shorting on rebounds. 😲
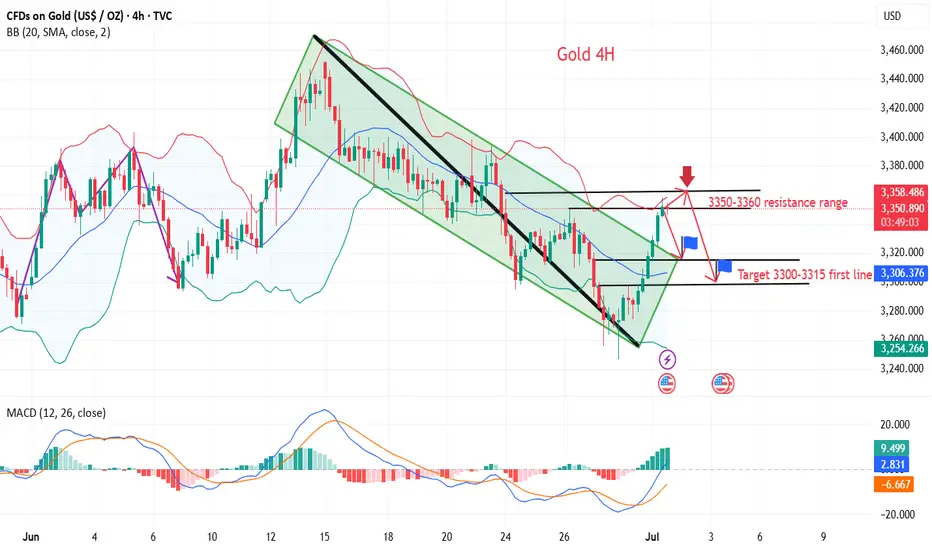
Gold, jolted by the nonfarm data, slid sharply in the short term before a minor rebound, with bearish signals across all timeframes. The data triggered an immediate breakdown, shifting the short-term trend to downward: on the 3-hour chart, moving averages formed a death cross, MACD showed a death cross with expanding volume, and gold prices fell below the Bollinger Band lower track, confirming a clear bearish momentum. 📉
🚀 Sell@3355 - 3345
🚀 TP 3335 - 3325 - 3315
Accurate signals are updated every day 📈 If you encounter any problems during trading, these signals can serve as your reliable guide 🧭 Feel free to refer to them! I sincerely hope they'll be of great help to you 🌟 👇
Beware of gold, false rise and real fall
💡Message Strategy
The global economic uncertainty has intensified recently, and the gold market has performed well. On Monday, the price of gold rose by 0.87%, hitting a bottom of $3247.87 per ounce before rebounding strongly. The upward trend continued in early trading on Tuesday. In the second quarter, the price of gold rose by 5.5%, rising for two consecutive quarters.
The main reason for this round of gold price rise is the weakening of the US dollar. The US dollar index has recorded its worst performance in the first half of the year since the 1970s. Market concerns about the expansion of the US fiscal deficit and uncertainty in trade agreements have weakened the attractiveness of the US dollar.
At the same time, global trade and geopolitical fluctuations, such as the Sino-US rare earth agreement, the progress of US-EU trade negotiations, and the uncertainty of the tariff deadline on July 9, have strengthened the safe-haven properties of gold. This week's focus is on Thursday's US non-farm payrolls report for June. The market expects 110,000 new jobs and an unemployment rate of 4.3%, which will directly affect the direction of the Federal Reserve's monetary policy.
Although the Federal Reserve is cautious about cutting interest rates, the market generally expects that interest rate cuts will be resumed in September, and the annual interest rate cut may reach 66 basis points. Trump's pressure on the Federal Reserve has also increased policy uncertainty.
Gold is driven up by multiple factors, but its future trend still depends on employment, inflation and tariff policies. Investors need to pay close attention to data and policy developments.
📊Technical aspects
Gold hit bottom and rebounded during the early trading session on Monday, and the price stopped after touching the previous low. The price stopped after touching the four-hour resistance position before the European session. The European session was under pressure before breaking through the four-hour resistance. After that, the U.S. session had consecutive positive days, and the price did not fall. Instead, it further broke through the four-hour resistance position, which means that the price still has the performance of testing the daily level resistance area. We will continue to follow the key breakthrough of 3300 on Monday and pay attention to the 3350-3360 area and then look at the pressure.
According to the daily level, after the price broke through the daily support last week, the price continued to rely on the daily resistance to bear pressure. At present, the daily resistance is at the 3360 area resistance. Below this position, gold can continue to be short.
According to the four-hour level, the four-hour key position is the key to our emphasis on short-term trends. Yesterday, the price broke through the four-hour resistance and is expected to adjust further. The current four-hour support is in the 3300 area. The price is short-term bullish above this position. After the subsequent high, it is expected to fall further after breaking the four-hour support again.
From the one-hour level, yesterday's strong closing, today's early trading again directly broke through yesterday's high position, so today's early trading low became the key. The price above this position tends to continue to test the daily resistance of 3360, so we will first look at the rebound, and wait until the price touches the daily resistance of 3350-3360, and then pay attention to further anti-K signals to see pressure.
💰Strategy Package
Short Position:3350-3360,SL:3370,Target: 3315-3300
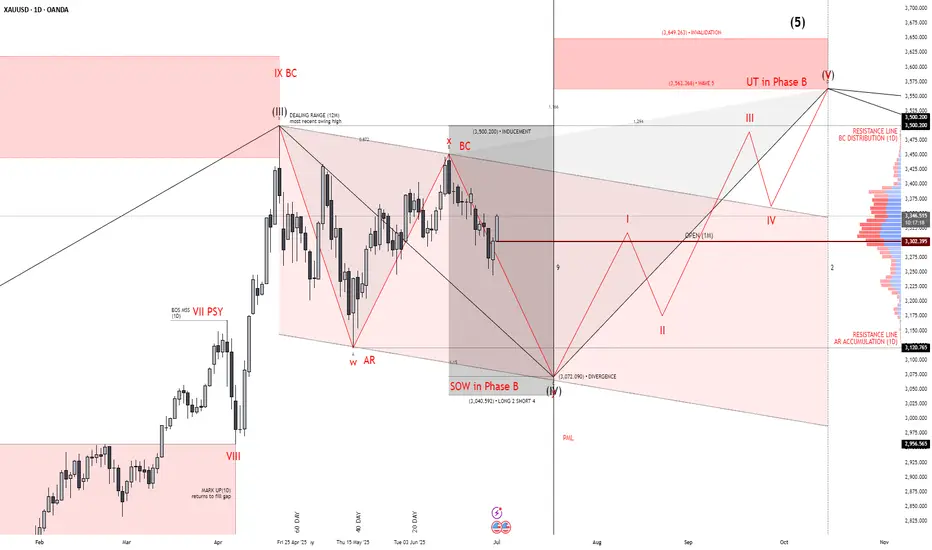
XAUUSD (GOLD/USD) Breakdown
🔴 1. UT in Phase B (Upthrust = Trap)
This move above the previous high was likely a liquidity grab, not a real breakout.
Price action showed rejection without follow-through — classic Wyckoff distribution behavior.
→ 📉 Smart money sells into retail buying.
🔴 2. SOW (Sign of Weakness)
After the UT, price dumped aggressively and broke short-term support.
This creates lower confidence in bullish continuation.
→ 📉 Weak hands shaken, structure looks heavy.
🔴 3. Bearish Structure (Waves i–ii–iii setting up)
Wave I = first drop after the UT.
Wave II = current bounce — looks corrective, not impulsive.
Expecting Wave III = the next strong sell leg.
→ 🎯 Target: revisit 3,072 → 3,040 → PML (3,010) → even 2,955.
🔴 4. Volume Profile Confirmation
Price is failing to hold the high-volume node (3,303–3,327).
Below this = thin volume zone, which price tends to drop through quickly.
→ 🚨 Liquidity vacuum below.
🔴 5. Resistance Cluster Above
Multiple key levels between 3,500–3,563 = heavy resistance.
Also aligns with the invalidation zone for the bearish count.
→ ❌ If price moves above here with strength = bias invalidated.
XAUUSD TRADE SETUPWait for retest the entry level and bearish momentum then take a trade for Sell otherwise skip this setup
Gold on upswing as expectedAs discussed throughout my yesterday's session commentary: "My position: Since #3,337.80 was neckline for upside Bull structure, I was aware if it gets invalidated to the downside, it will open doors for #3,327.80 extension (which held twice throughout late U.S. and Asian session). I don't expect much Selling action today however Bulls need another Fundamental push to invalidate wall of Resistances at #3,340's and #3,350's. I will continue Scalping as opportunity arise / no Swing orders."
I have expected Gold to test upside extension where I Bought (Scalp of course) #3,342.80 twice towards #3,348.80 and re-Sold #3,357.80 - #3,362.80 belt many times (excellent returns). I will await area to be engulfed and only then make my move.
As I am getting many Fundamental inquiries lately: Gold's current almost #2-Year perma-Bull outlook is driven by more than Fundamentals - rising Global debt, Central bank Buying (especially by China), and general declining trust in fiat currencies all play key roles in Gold's perma-Bull stance. It's considered undervalued by some part of my analysis when adjusted for Inflation and Money supply expansion (like #M2 growth). Gold acts as a Long-term hedge against currency devaluation and systemic Risk, especially during Global conflicts or financial crises. Mining costs are also on the rise while new discoveries are declining, which supports Higher future Prices. With ongoing de-Dollarization and interest in Gold-backed digital assets, the Long-term future of Gold looks structurally strong.
My position: Gold is Trading within #3,350's belt which represents crossroads for the Short-term. Either #3,362.80 - #3,368.80 break-out to the upside towards #3,377.80 strong Resistance, or #3,342.80 - #3,352.80 break-out to the downside towards #3,327.80 Support. Current Price-action is ideal for Scalping since I don't expect major movement until tomorrow's NFP numbers.
XAU/USD Chart Analysis: Price Retreats to Monthly LowXAU/USD Chart Analysis: Price Retreats to Monthly Low
In mid-June 2025, demand for gold surged following reports of exchanged strikes between Israel and Iran, along with US bombings of Iran's nuclear facilities. As a so-called safe-haven asset, gold prices climbed towards $3,430.
However, by the final day of June, the XAU/USD chart shows that gold had retreated to around $3,250, marking the lowest level in a month.
Why Is the Gold Price Falling?
On one hand, this reflects easing tensions in the Middle East, as a ceasefire—albeit fragile—between Israel and Iran remains in place.
On the other hand, the risk of trade wars is also diminishing. According to media reports:
→ President Donald Trump announced last week that the United States had signed a trade agreement with China and hinted that a “very major” deal with India would follow soon.
→ The US is also close to concluding agreements with Mexico and Vietnam, while negotiations with Japan and many other countries are ongoing.
Technical Analysis of the XAU/USD Chart
Looking at the broader picture, it is worth noting that gold prices in 2025 continue to move within a long-term upward channel (shown in blue), with the following key observations:
→ The channel’s median line acted as resistance (indicated by arrow 1);
→ The line dividing the lower half of the channel in half also showed signs of resistance (indicated by arrow 2).
Now, gold is trading near the lower boundary of the channel – a key support level within the multi-month uptrend. Demand may begin to strengthen here, with long lower wicks on candles on the lower timeframes supporting this view.
A rebound from the lower boundary is possible in early July, but how strong might it be? Note that bears have taken control of the $3,345 level (which has now flipped from support to resistance), and there are signs of a triple top pattern (A-B-C) forming near the $3,430 resistance. This raises the risk of a bearish breakout from the ascending channel.
This article represents the opinion of the Companies operating under the FXOpen brand only. It is not to be construed as an offer, solicitation, or recommendation with respect to products and services provided by the Companies operating under the FXOpen brand, nor is it to be considered financial advice.

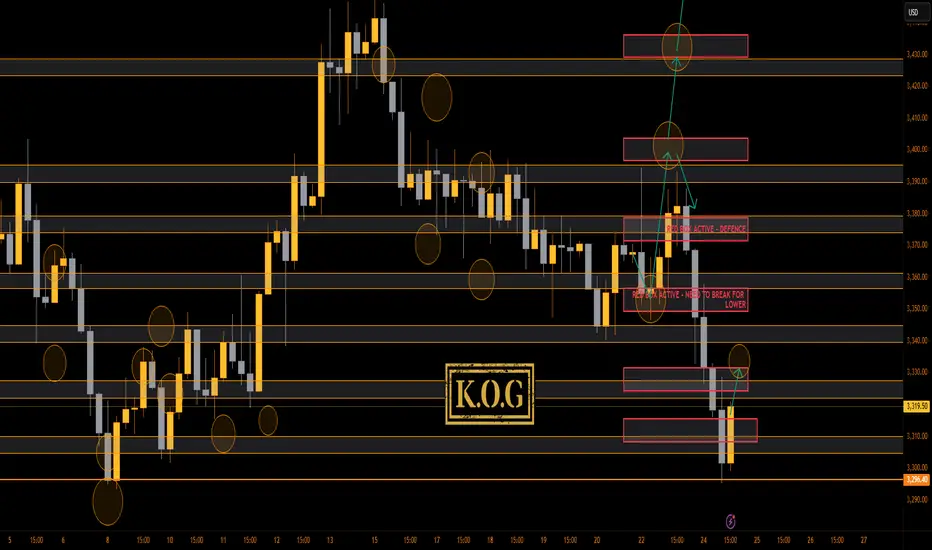
THE KOG REPORT - Update End of day update from us here at KOG:
Well, we actually did want higher but there was no break above, instead, we got the break below and then the move commenced overnight, most of which we missed. We did capture part of it on the tap and bounce, then another trade now on a RIP from lower Excalibur which was hit. Not bad, not amazing, just another day on the markets.
Now, we have support at the 3310-6 level with resistance at 3330 which could be the target over the sessions to come. As long as support holds, we'll hold as well.
As always, trade safe.
KOG
GOLD ROUTE MAP UPDATEHey Everyone,
Great start to the week with our new 1H chart playing out to perfection!!!
We started with a gap on market open clearing our Bullish target. We then got our bearish target at 3348, followed with no ema5 cross and lock confirming the rejection into our bullish target 3376.
We now have ema5 cross and lock above 3376 opening 3395.
We will see levels tested side by side until one of the weighted levels break and lock to confirm direction for the next range.
We will keep the above in mind when taking buys from dips. Our updated levels and weighted levels will allow us to track the movement down and then catch bounces up.
We will continue to buy dips using our support levels taking 20 to 40 pips. As stated before each of our level structures give 20 to 40 pip bounces, which is enough for a nice entry and exit. If you back test the levels we shared every week for the past 24 months, you can see how effectively they were used to trade with or against short/mid term swings and trends.
The swing range give bigger bounces then our weighted levels that's the difference between weighted levels and swing ranges.
BULLISH TARGET
3376 - DONE
EMA5 CROSS AND LOCK ABOVE 3376 WILL OPEN THE FOLLOWING BULLISH TARGETS
3395
EMA5 CROSS AND LOCK ABOVE 3395 WILL OPEN THE FOLLOWING BULLISH TARGET
3419
EMA5 CROSS AND LOCK ABOVE 3419 WILL OPEN THE FOLLOWING BULLISH TARGET
3440
BEARISH TARGETS
3348 - DONE
EMA5 CROSS AND LOCK BELOW 3348 WILL OPEN THE SWING RANGE
3330
3306
EMA5 CROSS AND LOCK BELOW 3306 WILL OPEN THE SECONDARY SWING RANGE
3288
3271
As always, we will keep you all updated with regular updates throughout the week and how we manage the active ideas and setups. Thank you all for your likes, comments and follows, we really appreciate it!
Mr Gold
GoldViewFX

Critical moment! Where will gold go?After rebounding for two consecutive days, gold prices consolidated in a narrow range in the Asian market on Wednesday, hovering below a one-week high. Although the US dollar rebounded slightly and the market's improved risk appetite suppressed safe-haven demand, the Fed's interest rate cut expectations and trade uncertainties limited the downside of gold prices. The market is waiting for the upcoming ADP and non-farm data to determine the timing of the Fed's interest rate cut. The key technical resistance is $3,358.
Gold received a positive cross in June. At present, the monthly line has an upper shadow for three consecutive trading months, and the shadow is long, indicating that the upper selling pressure is relatively large; in this way, for the future market, we are more optimistic about the highs and falls. In the recent stage, gold is not interested in US data, but Trump frequently calls for the Fed to cut interest rates, which we still need to pay attention to. The sharp rise in gold in the past two days is not unrelated to the Fed's expectation of a rate cut. On the other hand, it is also related to the market rumor that the US President Trump's tariff deadline on July 9 is also related. If the US dollar index bottoms out and rebounds, ushering in a phased upward trend; then, it is bound to suppress gold.
Short-term resistance is yesterday's high point 3350-3360 area. If it breaks above, it is expected to hit 3375-80, and further 3400 mark; before breaking above 3400 area, there is still a large sweep range. If it goes up, the bulls will have a wave of acceleration, and the upper 3425 and 3450 may even hit the historical high. For the day, the 5-day moving average 3315 area will form a strong support after breaking through. If it rebounds and rushes higher, it cannot break below. Once it breaks below, the market will continue to fall, further 3300~3295, and then 3275 and 3255~45 areas; that is, the rise on Monday and Tuesday means the end of the bulls. Therefore, in terms of operation, the short-term relies on the 3315-3325 area to support low longs, and if it rises, it will continue to short with reference to the resistance area.
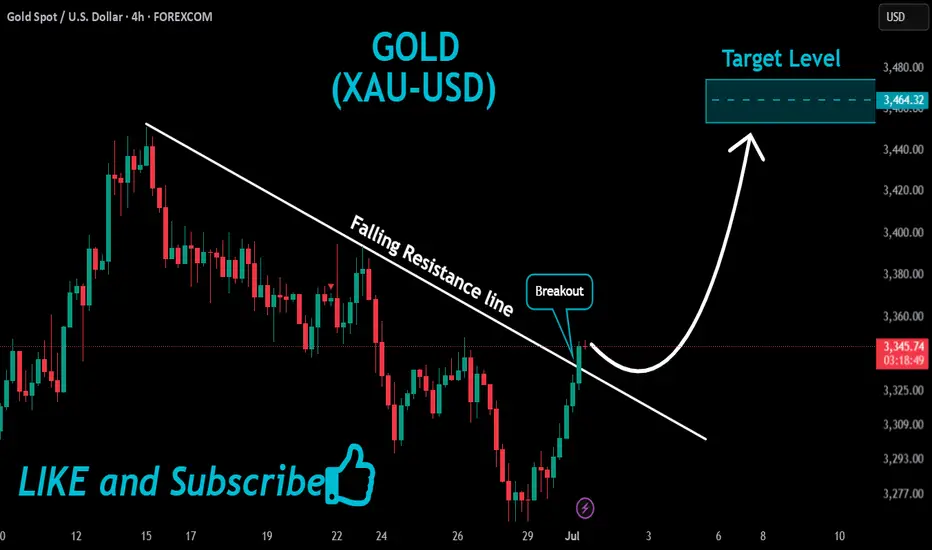
GOLD Massive Bullish Breakout!
HI,Traders !
#GOLD is trading in a strong
Uptrend and the price just
Made a massive bullish
Breakout of the falling
Resistance line and the
Breakout is confirmed
So after a potential pullback
We will be expecting a
Further bullish continuation !
Comment and subscribe to help us grow !
stable tariffs, gold price impact reduction✍️ NOVA hello everyone, Let's comment on gold price next week from 06/30/2025 - 07/04/2025
⭐️GOLDEN INFORMATION:
Gold prices plunged over 1.5% on Friday as risk appetite strengthened, fueled by a combination of positive geopolitical and economic developments. Easing tensions between Israel and Iran, the formal trade agreement between the United States and China, and continued efforts by Washington to strike new commercial deals with global partners lifted market sentiment—dampening demand for safe-haven assets like bullion.
At the time of writing, XAU/USD is trading at $3,274, having pulled back from an earlier high of $3,328. On Thursday, the White House confirmed the signing of a long-awaited trade pact with China, marking an official end to the protracted trade war. US Commerce Secretary Howard Lutnick also indicated that additional agreements may be finalized ahead of the July 9 deadline
⭐️Personal comments NOVA:
Information on tariff negotiations is gradually becoming stable and favorable. Information on inflation showing signs of increasing, dxy increase is also a temporary pressure causing gold price to return to the 3200 mark.
🔥 Technically:
Based on the resistance and support areas of the gold price according to the H4 frame, NOVA identifies the important key areas as follows:
Resistance: $3307, $3348, $3390
Support: $3248, $3202
🔥 NOTE:
Note: Nova wishes traders to manage their capital well
- take the number of lots that match your capital
- Takeprofit equal to 4-6% of capital account
- Stoplose equal to 2-3% of capital account
- The winner is the one who sticks with the market the longest