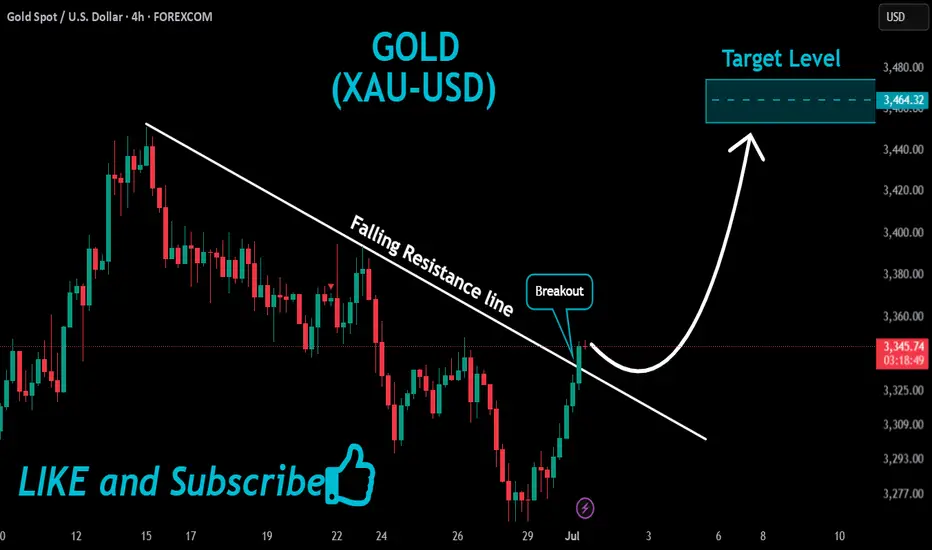
GOLD Massive Bullish Breakout!
HI,Traders !
#GOLD is trading in a strong
Uptrend and the price just
Made a massive bullish
Breakout of the falling
Resistance line and the
Breakout is confirmed
So after a potential pullback
We will be expecting a
Further bullish continuation !
Comment and subscribe to help us grow !
XAUUSD.F trade ideas
GOLD ROUTE MAP UPDATEHey Everyone,
Great start to the week with our new 1H chart playing out to perfection!!!
We started with a gap on market open clearing our Bullish target. We then got our bearish target at 3348, followed with no ema5 cross and lock confirming the rejection into our bullish target 3376.
We now have ema5 cross and lock above 3376 opening 3395.
We will see levels tested side by side until one of the weighted levels break and lock to confirm direction for the next range.
We will keep the above in mind when taking buys from dips. Our updated levels and weighted levels will allow us to track the movement down and then catch bounces up.
We will continue to buy dips using our support levels taking 20 to 40 pips. As stated before each of our level structures give 20 to 40 pip bounces, which is enough for a nice entry and exit. If you back test the levels we shared every week for the past 24 months, you can see how effectively they were used to trade with or against short/mid term swings and trends.
The swing range give bigger bounces then our weighted levels that's the difference between weighted levels and swing ranges.
BULLISH TARGET
3376 - DONE
EMA5 CROSS AND LOCK ABOVE 3376 WILL OPEN THE FOLLOWING BULLISH TARGETS
3395
EMA5 CROSS AND LOCK ABOVE 3395 WILL OPEN THE FOLLOWING BULLISH TARGET
3419
EMA5 CROSS AND LOCK ABOVE 3419 WILL OPEN THE FOLLOWING BULLISH TARGET
3440
BEARISH TARGETS
3348 - DONE
EMA5 CROSS AND LOCK BELOW 3348 WILL OPEN THE SWING RANGE
3330
3306
EMA5 CROSS AND LOCK BELOW 3306 WILL OPEN THE SECONDARY SWING RANGE
3288
3271
As always, we will keep you all updated with regular updates throughout the week and how we manage the active ideas and setups. Thank you all for your likes, comments and follows, we really appreciate it!
Mr Gold
GoldViewFX

XAUUSD has been in a strong free fall following the sell strategXAUUSD has dropped sharply in a free fall, perfectly following the sell strategy from 3348–3350.
We have won.
Trading Strategy for XAUUSD OANDA:XAUUSD
Based on the current price structure and short-term bias, here are two tactical trade setups:
Sell Setup – If Price Rejects Resistance
Entry: 3,348 – 3,350 USD
Stop-loss: 3,357 USD
Take-Profit 1: 3,340 USD
Take-Profit 2: 3,335 USD
Take-Profit 3: 3,330 USD
Buy Setup – If Price Holds Support
Entry: 3,328 – 3,330 USD
Stop-loss: 3,320 USD
Take-Profit 1: 3,338 USD
Take-Profit 2: 3,340 USD
Take-Profit 3: 3,348 USD
Important: Always set a stop-loss in every trade to manage risk effectively.
stable tariffs, gold price impact reduction✍️ NOVA hello everyone, Let's comment on gold price next week from 06/30/2025 - 07/04/2025
⭐️GOLDEN INFORMATION:
Gold prices plunged over 1.5% on Friday as risk appetite strengthened, fueled by a combination of positive geopolitical and economic developments. Easing tensions between Israel and Iran, the formal trade agreement between the United States and China, and continued efforts by Washington to strike new commercial deals with global partners lifted market sentiment—dampening demand for safe-haven assets like bullion.
At the time of writing, XAU/USD is trading at $3,274, having pulled back from an earlier high of $3,328. On Thursday, the White House confirmed the signing of a long-awaited trade pact with China, marking an official end to the protracted trade war. US Commerce Secretary Howard Lutnick also indicated that additional agreements may be finalized ahead of the July 9 deadline
⭐️Personal comments NOVA:
Information on tariff negotiations is gradually becoming stable and favorable. Information on inflation showing signs of increasing, dxy increase is also a temporary pressure causing gold price to return to the 3200 mark.
🔥 Technically:
Based on the resistance and support areas of the gold price according to the H4 frame, NOVA identifies the important key areas as follows:
Resistance: $3307, $3348, $3390
Support: $3248, $3202
🔥 NOTE:
Note: Nova wishes traders to manage their capital well
- take the number of lots that match your capital
- Takeprofit equal to 4-6% of capital account
- Stoplose equal to 2-3% of capital account
- The winner is the one who sticks with the market the longest
XAUUSD 30/6 – 4/7/2025: Selling Pressure Builds - In the past week, gold OANDA:XAUUSD has been under consistent selling pressure due to the following key macro factors:
- The U.S. Dollar Index (DXY) TVC:DXY surged, raising the opportunity cost of holding gold and leading to widespread sell-offs.
- 10-year U.S. Treasury yields hovered around 4.30%–4.35% , reinforcing expectations that the Fed will keep rates higher for longer.
- Core PCE data for June indicated that inflation remains elevated, reducing the likelihood of imminent rate cuts by the Federal Reserve.
- Geopolitical tensions in the Middle East have temporarily eased, diminishing gold’s safe-haven appeal in the short term.
➤ As a result, these combined factors are applying downward pressure on XAUUSD, especially after price decisively broke the 3,300 USD support zone.
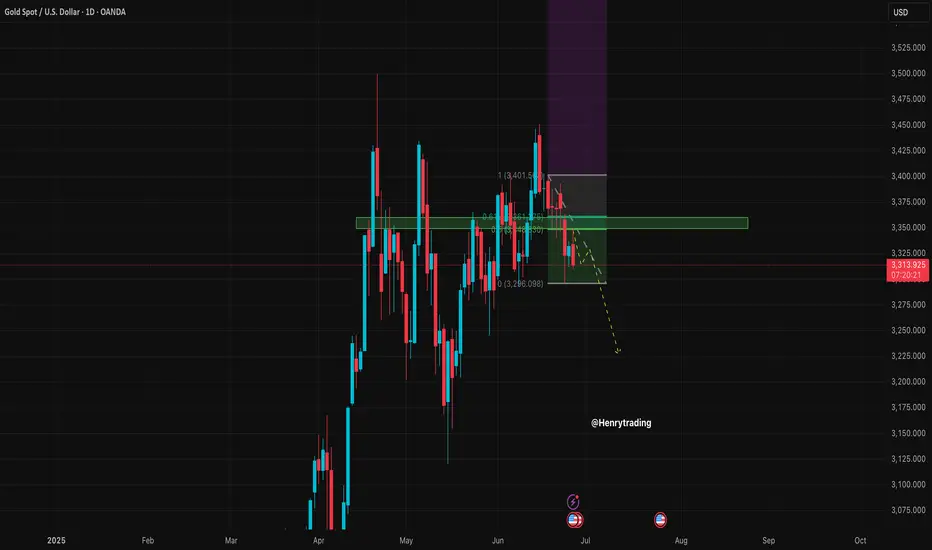
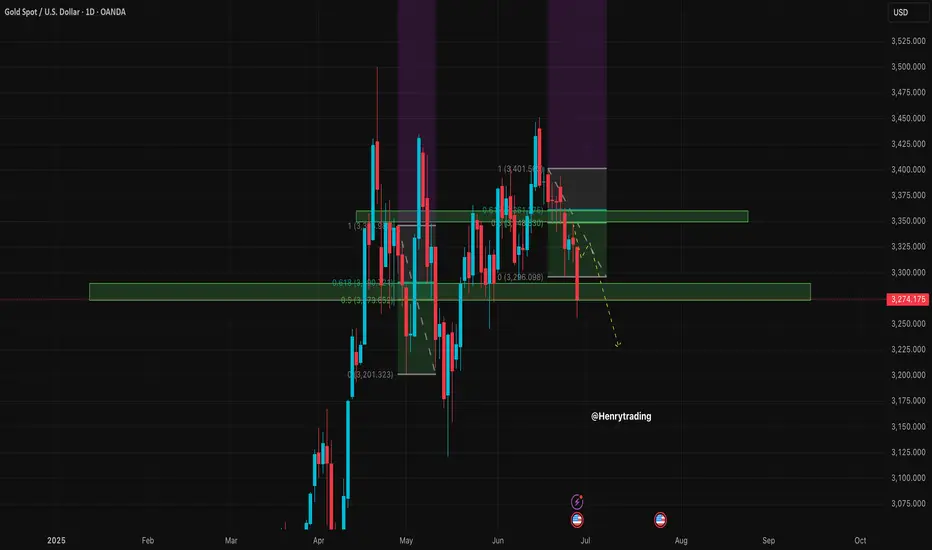
1. Technical Analysis of XAUUSD – Daily Timeframe
On the D1 chart:
- Price has broken below the key support zone 3,300 – 3,331 USD, confirming a short-term bearish structure.
- The Fibonacci retracement from the 3,399 peak to the 3,295 low has completed its pullback to the 0.5–0.618 zone (3,345 – 3,359 ) but was strongly rejected by sellers.
- Price is now trading below both EMA20 and EMA50, indicating strong bearish momentum.
- RSI has turned back under 50 and has not yet reached oversold territory, suggesting further downside potential exists.
2. Key Resistance and Support Zones for XAUUSD
Technical Role ( 3,345 – 3,359 )
- Major confluence resistance (Fibonacci 0.618 + supply) ( 3,295 – 3,300 )
- Immediate resistance zone (post-breakdown retest) ( 3,260 – 3,235 )
- Short-term support and potential buy interest ( 3,223 – 3,205 )
- Strong medium-term support (Fibonacci 1.0 + April lows)
3. Trading Strategy for XAUUSD This Week (30/6 – 4/7/2025)
Strategy 1 – Favor Short Positions Aligned with Bearish Momentum
Entry: Sell near 3,295 – 3,300 (anticipating resistance retest)
Stop Loss: 3,304
Take Profit 1: 3,290
Take Profit 2: 3,285
Take Profit 3: 3,275
Strategy 2 – Countertrend Buy at Key Support with Confirmation
Entry: Buy near 3,235 – 3,240 only if bullish reversal candles (pin bar or bullish engulfing) appear on H4 or D1
Stop Loss: 3,230
Take Profit 1: 3,245
Take Profit 2: 3,250
Take Profit 3: 3,260
Ps : XAUUSD is currently in a downward correction phase, with the next target zone lying between 3,235 – 3,260 USD. The inability to hold above 3,300 confirms that sellers remain in control. The most favorable approach this week is to sell on rallies, especially near former support-turned-resistance zones.
Stay vigilant, follow updated price action closely, and strictly manage risk to protect your capital.
Follow for more high-probability strategies throughout the week – and save this idea if you find it valuable to your trading journey.
Analysis by @Henrybillion
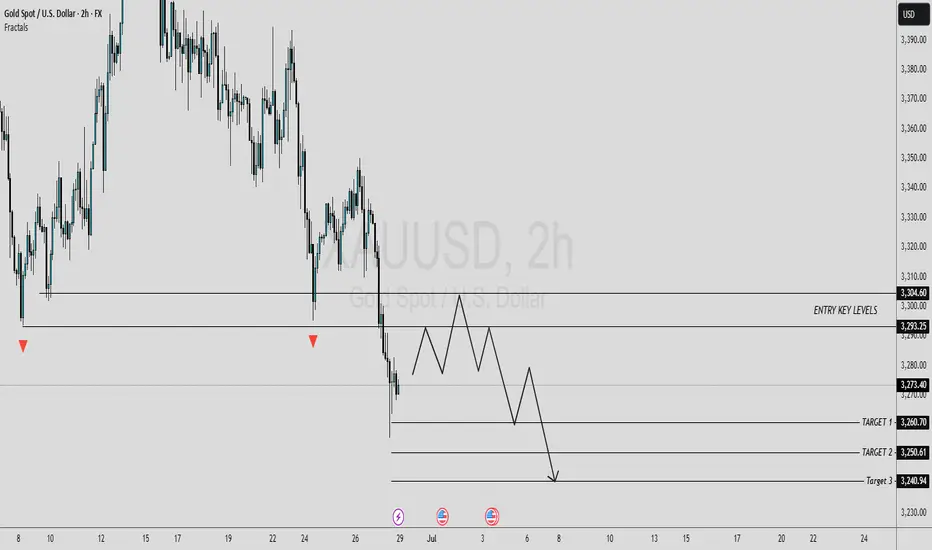
#XAU/USD SELL TRADE SETUP [SHORT]In this analysis we're focusing on 2H timeframe. As we know, Gold is moving in a strong bearish trend. The best selling zone is 3295 - 3305 key levels area. If gold encounters rejection from this zone, we can anticipate a potential decline in price towards its targeted levels.
Target 1:3260
Target 2:3250
Target 3:3240
Wait for a retracement to sell with strong confirmation and proper risk management.
#GOLD 2H Technical Analysis Expected Move.
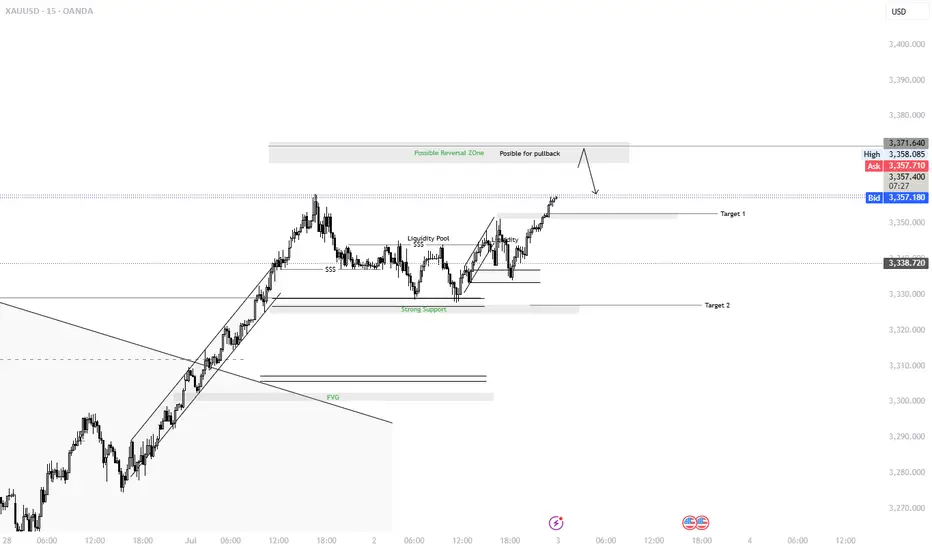
XAUUSD: Possible Pullback Before Major Reaction🟨 XAUUSD: Possible Pullback Before Major Reaction – Eyes on Reversal Zone
FaithDrivenTrades | July 2, 2025
Gold continues its bullish climb toward a possible intraday reversal zone (3371–3380). Technicals show a clean sweep of previous liquidity + bullish candle confirmation on H1. However, the broader fundamental backdrop now tilts toward short-term USD strength due to:
🔻 ADP NFP Miss:
ADP: 33K vs 99K forecast
Indicates weaker labor market, but Gold's reaction muted due to anticipation of Friday’s NFP and mixed inflation fears.
📊 Oil Inventory Surplus:
Crude: +3.845M vs -2.7M expected
Suggests soft demand → deflationary pressure → less urgency for Fed rate cuts.
📰 Trump Tariff Headlines:
Trump announces new 20%-40% tariffs with Vietnam.
Short-term USD pressure on trade uncertainty, but market sees longer-term USD safe-haven appeal.
📉 Fed Cuts Still Priced In (Sept, Dec):
CME Fed Futures show 2 rate cuts expected → supports bullish gold structure long-term
However, dollar’s resilience from ISM rebound + JOLTS adds near-term volatility
🧠 Market Sentiment Summary:
Macro: Mixed → USD Strengthening Short-Term
Risk: Sentiment cautious, NFP Friday key
Bias: Intraday Bearish Correction Possible, bigger trend still bullish
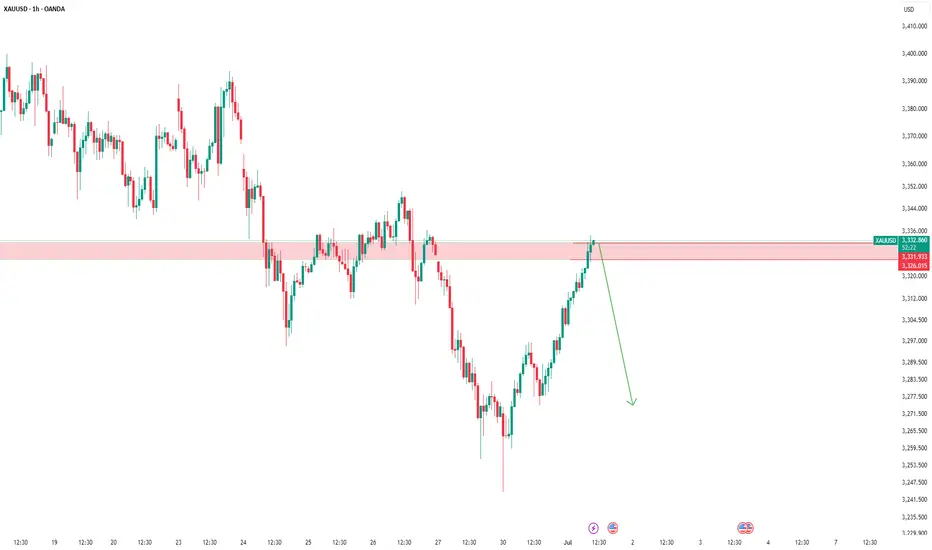
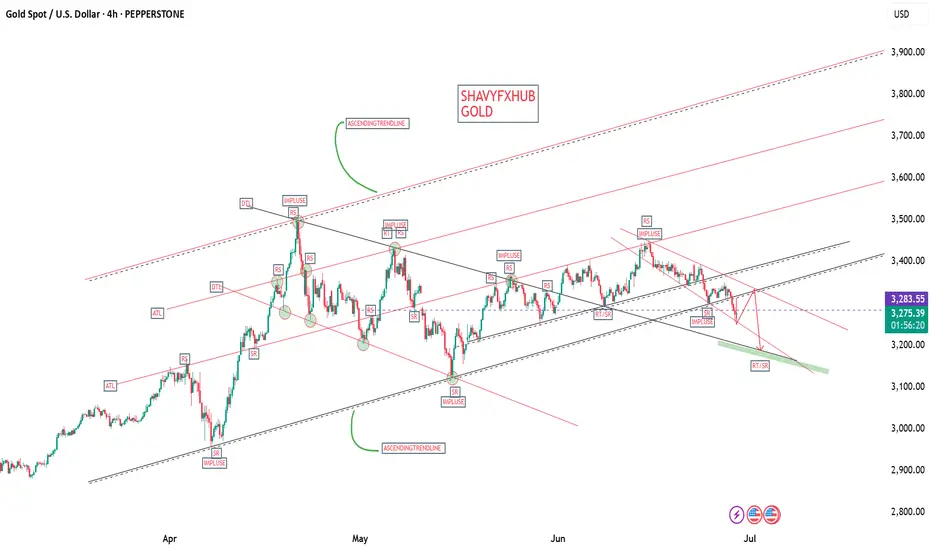
XAUUSD Weekly Analysis 30 June 4 July 2025Gold has formed a Head and Shoulders (H&S) pattern on the H4 timeframe. While the pattern is not perfectly symmetrical, it is still valid and clearly recognizable. The price has broken below the neckline, confirming a potential shift in market structure to the downside.
Analysis Insight:
The 3340–3350 area, previously a support zone, is now acting as resistance following the neckline break. A pullback to this zone may present a high-probability short opportunity for swing traders, especially if price shows rejection or bearish structure in that zone.
Trade Type: Swing
Trade Setup – Sell on Retracement:
Bias: Bearish on confirmation of retracement rejection
Entry Zone: 3340 – 3350
Stop Loss: 3376 (above right shoulder/high)
Take Profit: 3320/3300/3285/3260
Risk-Reward Ratio: Approximately 1:2
Kindly follow, share, like, support and comment.

A new golden week, grasp it with the best condition
Good weekend everyone, this week's trading time is over, and next week's trading time will also enter the countdown. No matter how you grasp the market this week, whether happy or sad, Theo hopes that everyone will not bring your mood to the trading environment next week.
After all, next week is also a new beginning of the week. In the new week, everyone should be prepared for a new state. A good state should be persevered, and a bad state should be adjusted. With a good state to grasp the market trend of next week, I believe you can also be invincible and grasp the market better!
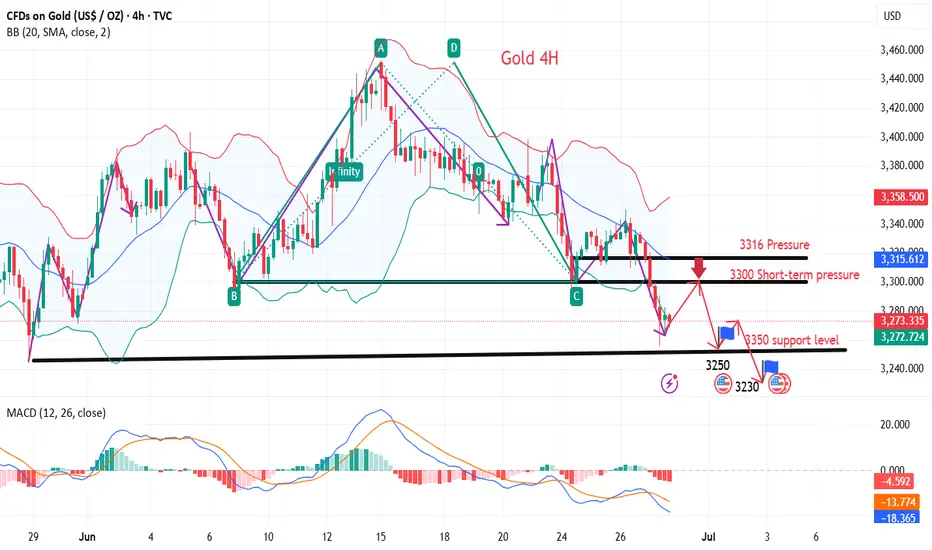
📊Technical aspects
Gold did not break through the upper pressure at midnight on Friday. Gold fell directly after opening in the morning on Friday. The bears broke through the previous 3295 support line, and the lowest level in the evening was 3255, closing at around 3274.
The daily line also closed in the form of a big negative line, with an obvious downward trend, and all the previous support will also turn into pressure. The short-term moving average system crossed downward to accumulate energy for the bears. Since the closing did not break through the upper 3300 pressure level, we will continue to rebound and short next week. After all, the technical side is still short, and only by following the trend can we keep up with the rhythm of eating meat.
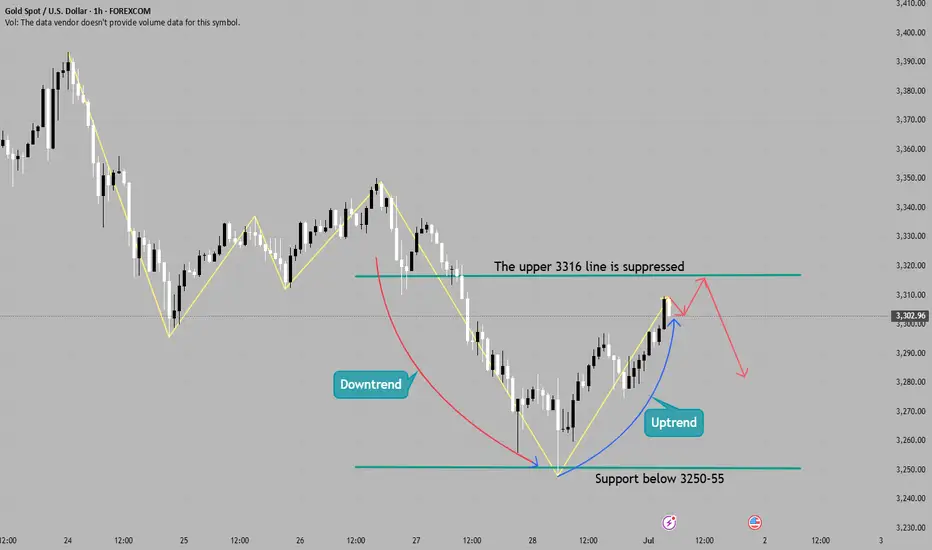
From the 4-hour analysis, the upper short-term resistance is around 3295-3301, with special attention paid to the suppression at 3316. In terms of operation, the rebound continues to be the main short and the trend looks down. The lower short-term support is around 3250-3255. The overall main tone of high-altitude participation remains unchanged relying on this range.
💰Strategy Package
Short Position:3290-3300,SL:3315,Target: 3240-3250
Who will be the winner in the battle between bulls and bears?From the analysis point of view, the short-term resistance above is around 3295-3301, and the pressure at 3315-3316. Focus on the pressure at 3324, the long-short watershed. In terms of operation, the rebound will continue to be the main short and look for a decline. The short-term support below is around 3250-3255. Relying on this range, the main tone of high-altitude participation remains unchanged.
XAUUSD – Gold at a Key AreaGold is now in a crucial zone with short potential.
If the market provides a valid bearish signal, I’ll take the short.
But if this zone breaks and confirms with a pullback, I’ll switch bias and go long.
💡 Remember:
We don’t control the market — we just try to profit using structure, setups, and solid risk management.
📌 Always risk max 1% per trade.
If the market goes against your bias, you only lose 1% — not your whole account.
🧠 One trade won’t make you rich,
But one reckless trade can destroy everything.
No gambling.
Just discipline, structure, and smart execution.
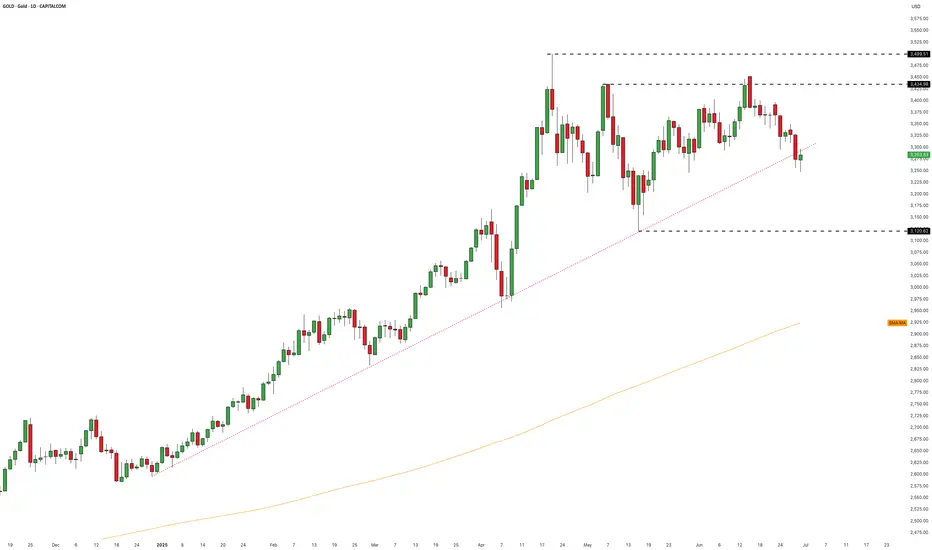
Gold Retests Ascending TrendlineGold has pulled back to a key technical level, despite a mix of conditions that would usually support higher prices. This signals a potential shift in how investors are positioning for risk, inflation, and growth.
Gold Ignores the Playbook
You’d be forgiven for expecting gold to be higher. The past week saw softer US dollar action, rising bets on interest rate cuts, and inflation numbers that nudged uncomfortably higher. On paper, these are the sort of developments that traditionally give gold a boost. But the metal barely blinked.
The May core PCE figure, the Fed’s preferred inflation gauge, rose more than expected to 2.7%. Yet bond markets took it in their stride, with rate futures continuing to price in a strong chance of easing by September. At the same time, the US dollar lost ground, with the dollar index down over 1% on the week. That sort of move would usually feed straight through into dollar-denominated commodities like gold. This time, it didn’t.
Part of the answer lies in geopolitics. The ceasefire between Israel and Iran has cooled tensions that previously underpinned gold’s safe-haven appeal. Meanwhile, equity markets keep printing new highs, led by tech and growth stocks. Investors are shifting from protection to participation, favouring assets that benefit from improving trade flows and global demand. The latest US-China trade deal, focused on rare earth exports, only adds to that narrative. For now, risk-on is winning.
All Eyes on the Trendline
While the macro backdrop has turned more complex, the technical picture for gold remains clearly defined. After a strong rally into April, the market has entered a period of consolidation. A lower swing high formed in May, which was retested and rejected in June. That rejection triggered the most recent two-week slide, bringing the precious metal back to its rising trendline.
This trendline, in place since December 2024, has guided the broader uptrend and held firm on three previous tests. Once again, it finds itself under pressure. Whether it holds this time is an open question. Trendlines are only as good as the demand that supports them, and in a consolidation phase, that support can often be patchy.
The nature of consolidation is a kind of controlled drift, plenty of movement, but not much commitment. If the trendline does give way, that doesn’t necessarily spell the end of gold’s bull cycle. But it would likely open the door to a deeper correction, with the May swing lows in play. That area also aligns with the volume-weighted average price anchored to the December 2024 lows which is a key reference point for longer-term participants.
For now, gold is in wait-and-see mode. It is still above support, but no longer behaving like a market in control. If the broader risk-on mood continues, we may see further rotation away from safe havens. But if the growth narrative starts to wobble, don’t be surprised if gold finds its voice again.
Gold Daily Candle Chart
Past performance is not a reliable indicator of future results
Disclaimer: This is for information and learning purposes only. The information provided does not constitute investment advice nor take into account the individual financial circumstances or objectives of any investor. Any information that may be provided relating to past performance is not a reliable indicator of future results or performance. Social media channels are not relevant for UK residents.
Spread bets and CFDs are complex instruments and come with a high risk of losing money rapidly due to leverage. 85.24% of retail investor accounts lose money when trading spread bets and CFDs with this provider. You should consider whether you understand how spread bets and CFDs work and whether you can afford to take the high risk of losing your money.
XAU / USD 1 Hour ChartHello traders. I still have my runner running from yesterday's trade. Saying that, I am waiting to see if we move up , stay in the consolidation range, or push down some more. It is mid week, and I am in no hurry to rush or force a trade. Just need to wait to see what Pre NY volume brings in an hour from now. 3 hours until the NY open. BIg G gets a shout out. Be well and trade the trend. Let's see how the current 1 hour and 4 hour candle close, I will update or post another chart in a bit. Thank you so much for checking out my chart.
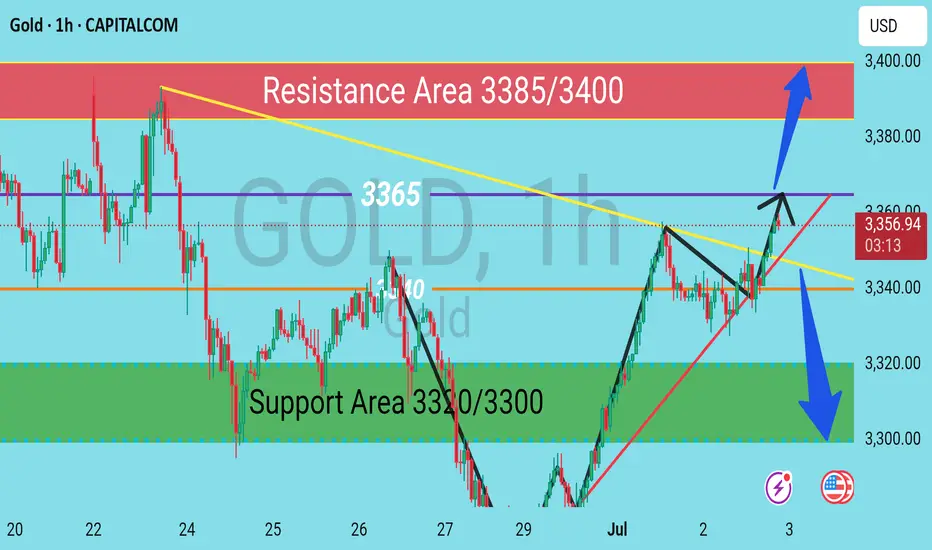
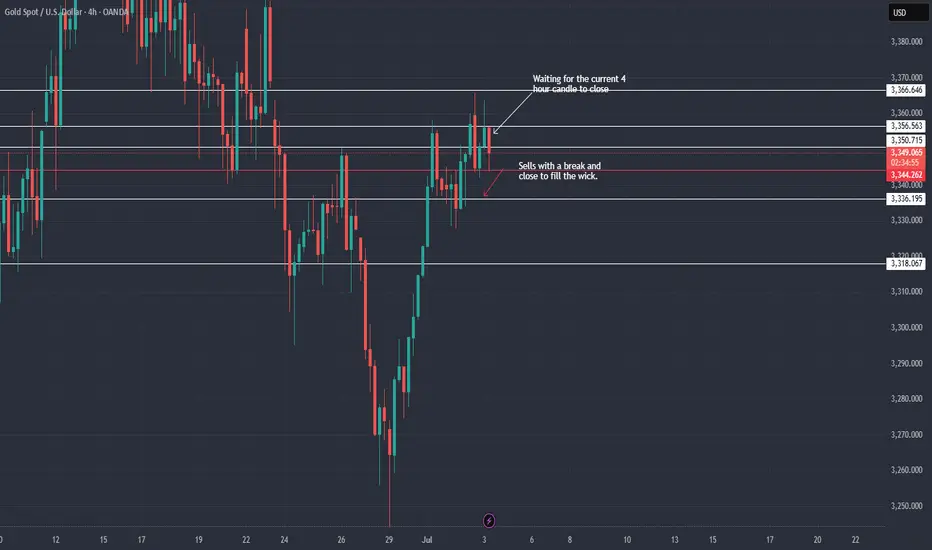
XAU/USD (GOLD) H1 Chart Outlook – Supply & Demand PerspectiveGold is currently consolidating in a tight range near the 3355–3358 zone, showing indecision ahead of a potential breakout. Based on supply and demand dynamics, here’s what to watch:
---
🔼 Bullish Scenario
If the H4 candle closes above 3365, this would confirm a bullish breakout above the immediate supply zone. In that case, expect upside momentum to target key resistance levels:
🎯 3385 – Minor resistance
🎯 3400 – Major resistance and potential reversal zone
A confirmed breakout with strong volume could open room for a short-term bullish rally.
---
🔽 Bearish Scenario
On the flip side, if the H4 candle closes below 3340, it would signal weakness and a possible rejection from the current range. This breakdown could shift the momentum to the downside, targeting the following support levels:
🛑 3320 – Near-term support
🛑 3300 – Critical demand zone
Failure to hold 3300 could indicate further bearish pressure in the coming sessions.
XAUUSD/GOLD Geopolitical conflicts have escalated again. Next week is a week of heavy news. How will the gold price focus next week? How to trade? Look at the news preview first.
1. Geopolitics, Russia-Ukraine conflict, Palestine-Israel conflict, Iran-Israel conflict.
2. ADP data, NFP data.
3. Tariff deadline.
The above three news are enough to cause drastic fluctuations in the gold price.
On Friday, the New York market followed my expectations. After rebounding around 3282, it fell back. Finally closed around 3274.
The impact of the weekend news is huge. From the news perspective, the opening price of next Monday will be higher than the closing price on Friday. In terms of operation, you can pay attention to buying at a low price after the market opens.
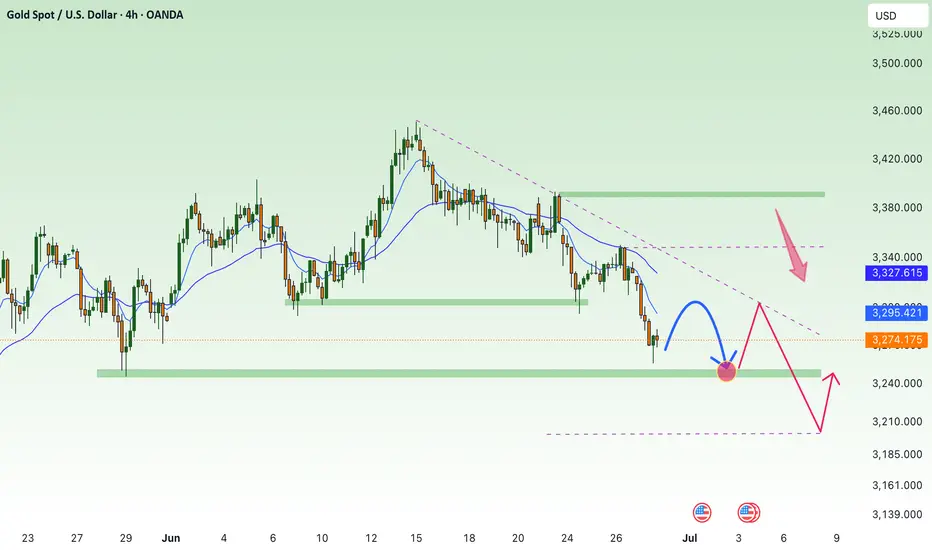
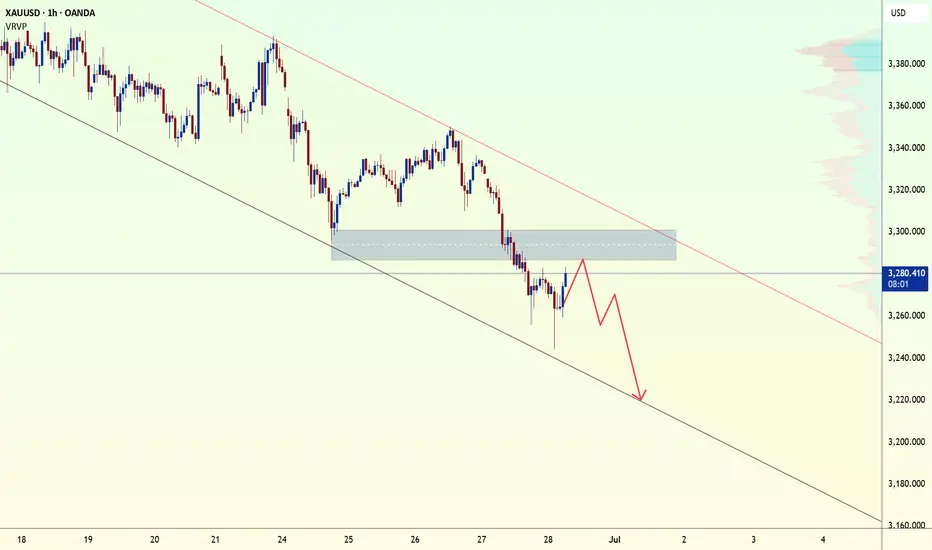
XAUUSD Nears Key Rejection ZoneHello all dear traders!
Currently, XAUUSD is still in a clear downtrend, with lower highs and lower lows – a characteristic of a market controlled by sellers. Now the price is rebounding to an important resistance zone – which was previously a demand zone but was broken. It coincides with the EMA cluster and falls right into a technical confluence area. This is a very typical "retest" before the price continues to fall.
If you have experience, you will know: there is nothing more dangerous than buying in a downtrend, just because the price is recovering.
On the macro side, the current context is not favorable for gold: Middle East tensions have temporarily subsided, the USD is recovering slightly, US bond yields are still high, and US inflation data is showing signs of cooling down. That is: gold is losing its role as a haven and a hedge against risks – money will gradually withdraw from gold if there are no more unexpected fluctuations.
Given the convergence of these technical and fundamental factors, I am leaning strongly towards a continuation of the downside, with the possibility of a further decline towards the lower boundary of the channel. Traders should wait for a clear price reaction at the resistance zone – if they see a strong rejection signal (e.g. pinbar, engulfing candle, or exhausted volume), it is a very good opportunity to enter a position.
The rebound short-selling trend remains unchangedFrom the 4-hour analysis, the upper short-term resistance is around 3297-3301, and the pressure at 3315-3316 is paid attention to. The pressure at 3324 is focused on. In terms of operation, the rebound continues to be the main short and the trend is downward. The short-term support below is around 3250-3255. The overall main tone of high-altitude participation remains unchanged relying on this range.

GOLD FREE STRUCTUREChina Hong Kong gold vault hints at a geopolitical shift, as the Shanghai Gold Exchange's expansion, aims to enhance China's gold trading infrastructure and challenge Western dominance, potentially impacting demand and supply of physical gold need.
3380-3385 triggered but be cautious
buy zone 3250-3255 reacted and instant buy rejection on the descending trendline.
the Core PCE Price Index (month-over-month): rose by 0.2%, above the forecast of 0.1% and the previous 0.1% reading. This indicates a slight acceleration in the Federal Reserve’s preferred inflation gauge, with the annual core PCE inflation rising to about 2.7% year-over-year, above expectations of 2.6%.
Personal Income (month-over-month): declined by 0.4%, worse than the forecasted 0.3% increase and down from the previous 0.8% rise. This drop suggests a weakening in household income growth.
Market and Policy Implications:
The uptick in core PCE inflation signals that underlying price pressures remain somewhat persistent, complicating the Fed’s path toward its 2% inflation target.
The decline in personal income could weigh on consumer spending going forward, potentially slowing economic growth.
The US Dollar Index reacted by edging lower, reflecting market caution amid mixed inflation and income data.
Fed officials, including Chair Powell, have emphasized a cautious approach, suggesting no immediate rate cuts until inflation dynamics become clearer.
Summary:
Core inflation is ticking up slightly, reinforcing inflation concerns, while personal income weakness points to potential softening in consumer demand. This mixed data supports a Fed stance of patience, with markets pricing in a moderate chance of rate cuts later in 2025 but expecting continued vigilance.
stay cautious on #gold
XAU / USD 4 Hour ChartHello traders. We have the 4th of July holiday tomorrow, so today is the last day open for the NY market. Saying that, we have bing (red flag) news today here in the US in about 2 hours from now. I am just posting a quick 4 hour chart with the areas / candle I am currently watching. I will most likely wait to see what the news brings. I will post a lower time frame chart. Let's see how things play out. Big G gets all my thanks. Be well and trade the trend.
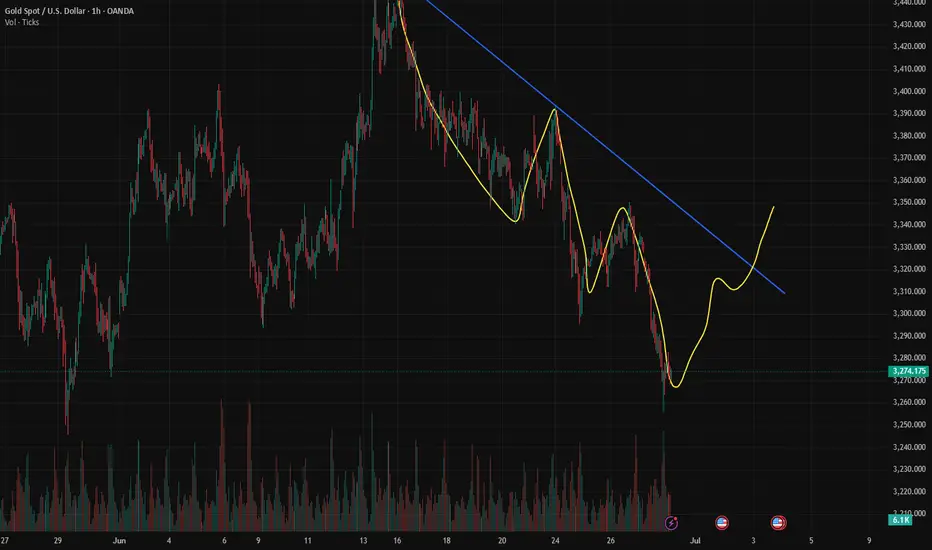
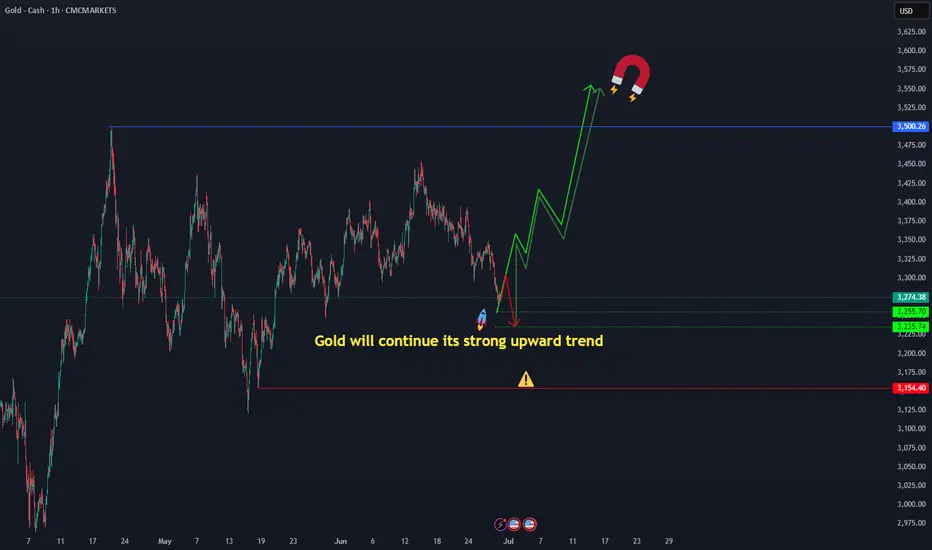
gold strong upwardGold will continue its strong upward trend, the corrections seem to have come to an end, the gold price is certain to reach above $3500, if the current price and the price of 3235 break down, you should not panic, the direction of the gold price movement is still towards the ceiling ( ATH ) CMCMARKETS:GOLD
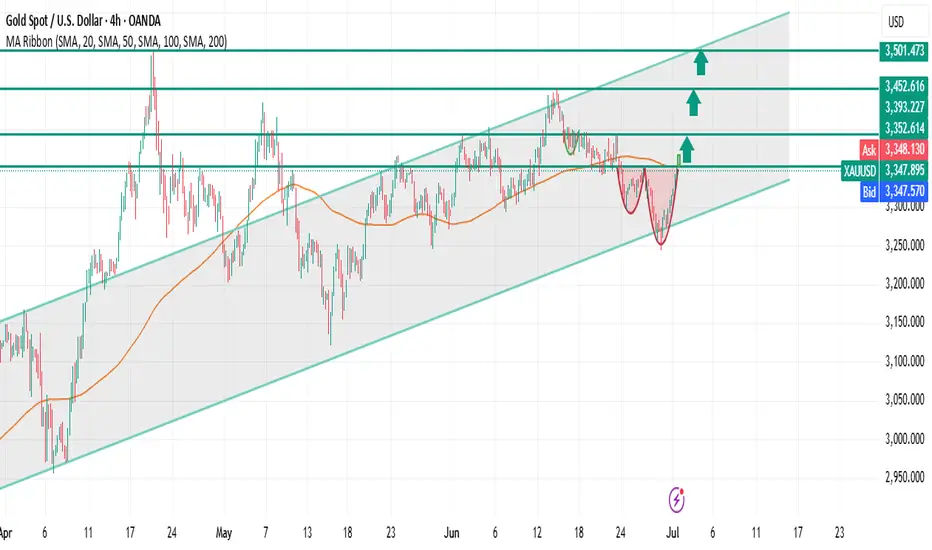
Gold (XAUUSD) – FRL Classic Double Bottom After CorrectionGold forms a clean double bottom after a correction within an upward channel.
The neckline aligns precisely with the 100 MA – a classic Fractal Reversal Law (FRL) setup, indicating a phase shift back into the bullish structure.
Why This Setup:
✅ Trend Structure:
Gold remains inside its upward channel, respecting each phase with corrective trends that end with clear reversal patterns.
✅ FRL Double Bottom:
• The corrective downtrend completes with a double bottom.
• The neckline is strictly horizontal, matching the start of the last impulse (FRL principle).
• Alignment with the 100 MA confirms the phase and scale.
✅ Confirmation:
We wait for a full H4 candle close above the neckline for entry confirmation.
Trade Plan:
📈 Entry:
After H4 confirmation above the neckline or on a retest of the neckline.
🎯 Targets:
Take Profits are aligned with the key levels from the chart:
• TP1: First resistance in the mid-channel zone.
• TP2: Next resistance level within the channel.
• TP3: Upper channel boundary.
🛑 Stop Loss:
Placed just below the smaller low of the double bottom, maintaining a clean and logical risk structure.
FRL Key Notes:
Every correction is also a trend that ends with a reversal pattern.
The neckline = the beginning of the last impulse, always horizontal.
The 100 MA is used to align the timeframe with the market phase.
XAU / USD 4 Hour ChartHello traders. Just a quick post with a revised area of interest on the 4 hour chart. I will check to see how the overnight charts do for gold's direction. I will post during the end of the London session or when the Pre NY volume comes in tomorrow morning. Be well and trade the trend. Big G gets a shout out and all my thanks. Thank you so much and don't get caught trading in the range, wait for a break and close and if the lower time frames match up, see if the set up plays out. DYOR and never try to force or rush a trade. I did all that years ago and just lost money and / or blew threw the account.

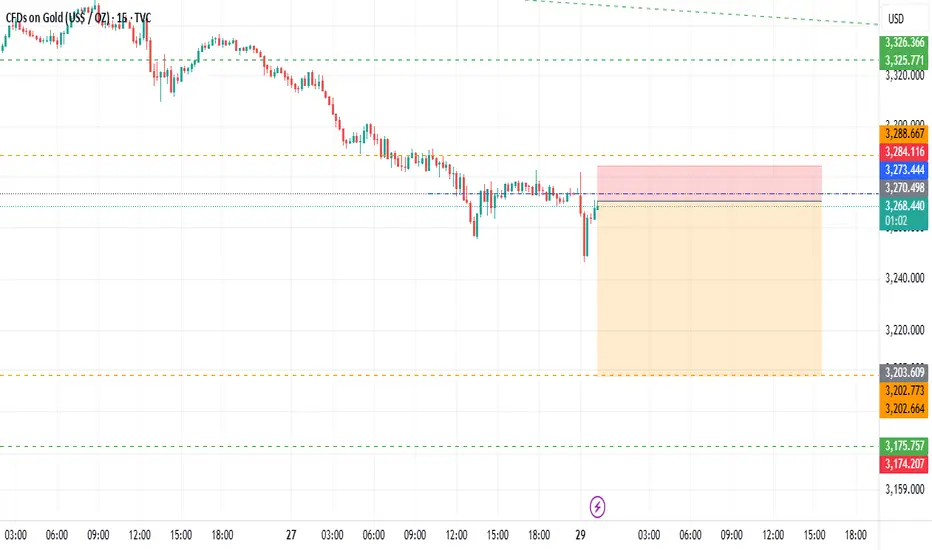
GOLD ANOTHER 15M SELL OPPORTUNITYHope all well, GOLD look to cover the bottom side earlier this week before we go back up again
I can see 3203 first before we BUY
If this plays out its good risk reward trade