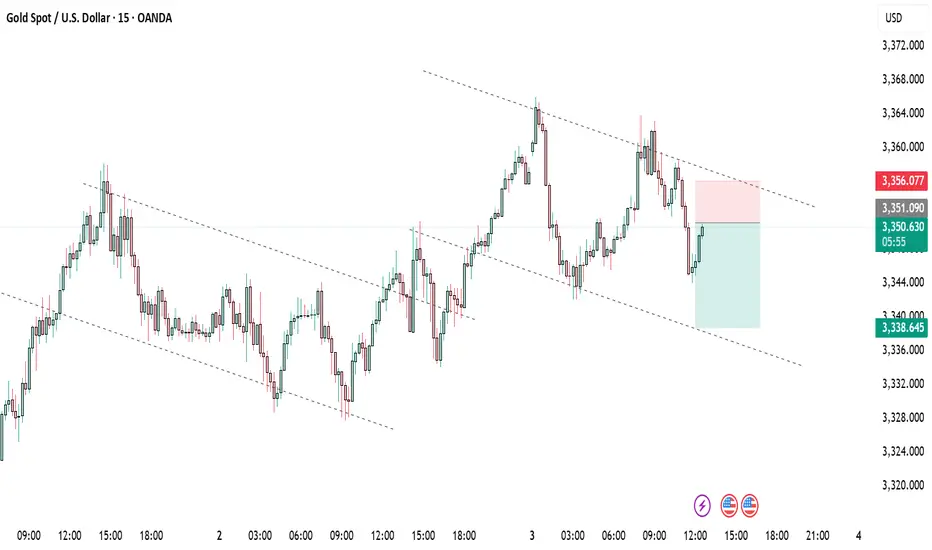
Sell XAUUSDGold signal until the news release, price should decline from this pivot 3352 towards 3338. The uptrend will likely continue from 3338
XAUUSD.F trade ideas
Geopolitical Spike Fades Fast – Gold Eyes 3300As highlighted in Friday’s analysis, the daily and short-term charts remain messy, but the weekly chart is leaning clearly bearish – with a potential Dark Cloud Cover candlestick formation now confirmed.
🌍 Geopolitical Gap Up... and Quick Rejection
Monday’s Asian open brought a gap up, triggered by renewed tensions in the Middle East. But price failed to break above 3400 and quickly reversed – a textbook sign of weakness, not strength.
🧭 Technical View:
- The weekly candle closed as a Dark Cloud Cover, a strong bearish reversal signal
- The lack of follow-through after the gap up further confirms sellers are still in control
- Price remains below the key 3400 level, showing no bullish momentum behind recent spikes
📌 Trading Plan:
I continue to sell rallies, with an initial target near 3300. If bearish momentum builds, lower levels are in play.
Let the chart lead – don’t get distracted by the noise.
Disclosure: I am part of TradeNation's Influencer program and receive a monthly fee for using their TradingView charts in my analyses and educational articles.
Daily live trade with XAUUSD in 15m/30m/1h 20250702Daily live trade with XAUUSD in 15m/30m/1h 20250702
GOLD WATCH buy floor at 3200-3214 and the sell zone which will retest the broken ascending trendline is 3330-3345 zone

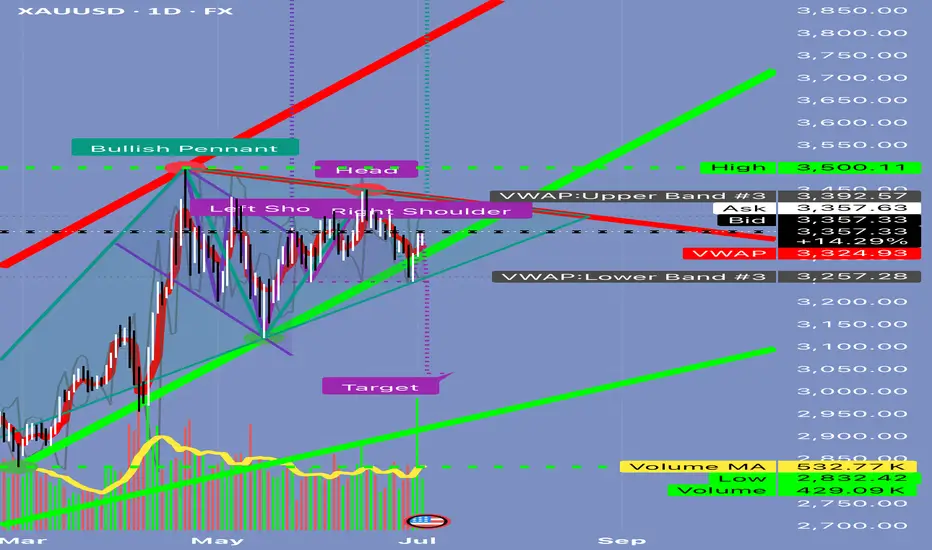
Can Gold Really Drop 10% in a Day?📘 EDUCATIONAL POST: Can Gold Really Drop 10% in a Day? Let’s Break It Down
Alright, traders—before you start thinking the sky is falling, let’s look this chart straight in the face and get real.
⸻
🔍 The Setup Right Now
Here’s what’s showing up:
✅ A bullish pennant forming up top (potential continuation higher).
✅ A big head and shoulders pattern in the middle (bearish).
✅ VWAP bands ranging from ~3,257 to ~3,392.
✅ Volume is underwhelming—426k vs 582k average.
✅ A big target line all the way down near 3,000.
This mix of signals can be confusing. Let’s separate the hype from what’s actually possible.
⸻
🎯 Q: Can the market collapse to 3,000 tomorrow?
Short Answer:
No.
Here’s Why:
1️⃣ Move Size:
• Current price is ~3,357.
• Target is ~3,000.
• That’s a -357 point drop (~10.6%) in one session.
• For gold CFDs, this would be an extreme event only seen in major crises (think 2008 or March 2020).
2️⃣ Volume Context:
• Today’s volume is below average.
• Big crashes are usually preceded by heavy distribution—this isn’t showing yet.
3️⃣ VWAP Anchors:
• The lower VWAP band sits at 3,257.
• Reaching 3,000 would require breaking through 3,257 support, 3,100, and months of prior buying interest.
4️⃣ Market Environment:
• It’s the July 4th holiday in the U.S.—liquidity is thin.
• Thin markets can gap lower but rarely hold a massive drop without a big catalyst (e.g., credit crisis, war headlines).
5️⃣ Pattern Confirmation:
• Yes, the head and shoulders pattern is visible.
• But to confirm it, you need:
🔹 A clear break of the neckline with double average volume.
🔹 Follow-through that pushes below 3,257.
• None of this has happened yet.
⸻
✅ What’s Realistically Possible Tomorrow?
If sellers show up, here’s what a big bearish day might look like:
1️⃣ First Move:
• Rejection at 3,357–3,392 resistance.
• Pullback toward ~3,324 (mid VWAP).
2️⃣ Continuation:
• Drop down to ~3,257 (VWAP lower band).
3️⃣ Extreme Scenario:
• Retest of 3,200–3,150 zone.
But a flush all the way to 3,000?
👉 Highly unlikely unless there’s a major global shock.
⸻
💡 Trading Tip: Stay Tactical
If you want to position short:
✅ Wait for rejection at 3,357–3,392.
✅ Short targeting 3,324 first.
✅ Scale profits there.
✅ Only hold runners for 3,200–3,150 if momentum accelerates.
⸻
🔑 Key Takeaway
3,000 is a structural target—this means it’s a price objective that might play out over weeks, not hours.
Trying to catch that in one day is chasing a black swan.
Stay patient. Trade levels, not headlines.
⸻
⚠️ Disclaimer:
This post is for educational purposes only. Always do your own research before trading.
⸻
✅ If you found this helpful, share it with someone who panics every time a red candle shows up.
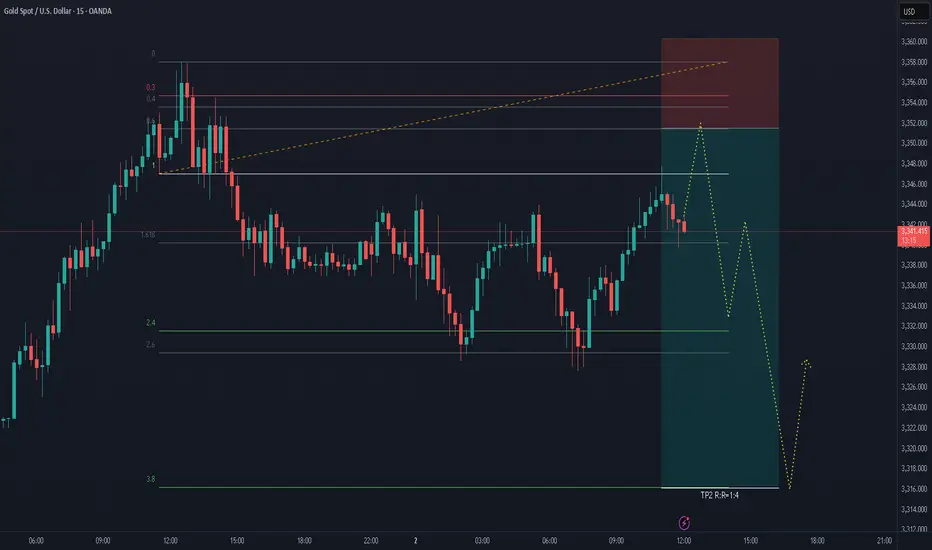
Gold sell ideaGold is rebounding after sweeping Friday's low liquidity, driven by a weak dollar. Despite the upside move, the 1-hour structure remains bearish. We anticipate a potential false breakout above $3,307.00 followed by a sell-off back to the $3,271.00 lows. If the bulls can regain control, gold may bounce back and resume its growth. However, failure to do so could lead to a decline towards the $3,245 support level
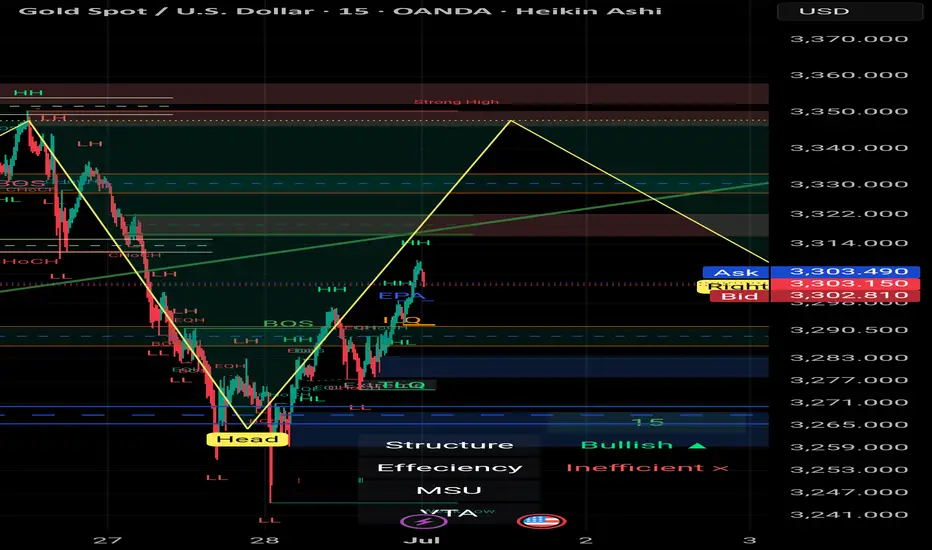
Gold Market Outlook – 1st of July | XAU/USD | 30min | by Mohsen # Gold Market Outlook – 1st of July | XAU/USD | 30min | by Mohsen Mozafari Nejad
🔸 **Instrument:** Gold Spot / USD (XAU/USD)
🔸 **Timeframe:** 30min
🔸 **Methodology:** Smart Money Concepts (SMC) + Liquidity + OB + Market Structure
🔸 **Focus:** New Monthly Open Setup
---
## 🔍 Market Context:
- **Structure:** Bullish on LTF (MSU)
- **Efficiency:** ✅ Clean & Efficient Delivery
- **Recent Activity:** Reverse H&S completed + double BOS + CHoCH confirmed
- **Price Level:** Trading near key Supply zone (3300–3315)
- **Monthly Context:** July begins with bullish momentum & previous session showed aggressive buy-side pressure
---
## 🧠 Technical Breakdown:
1. **Strong recovery** after clearing deep liquidity sweep (Head zone)
2. **Bullish BOS** structure confirmed on LTF → Multiple HH and HL formed
3. Price now testing **Key Supply/OB zone at 3300–3315**
4. Above this zone lies a **Strong High (SH) around 3,350**, a potential liquidity magnet
5. Overall bias is bullish unless strong rejection appears from upper OB
---
## 📌 Trade Plan:
| Position | Entry Confirmation Zone | Stop Loss (SL) | Take Profit (TP) |
|----------|--------------------------|----------------|------------------|
| Long | Above 3,303–3,310 (structure hold) | Below 3,294 | TP1: 3,325 / TP2: 3,340 / TP3: 3,348 |
| Short (scalp only) | Bearish reaction from 3,345–3,350 | Above 3,353 | TP1: 3,310 / TP2: 3,290 |
---
## ⚠️ Risk Factors to Watch:
- 🔺 High-impact USD news (July 1st releases: Manufacturing PMI / employment preview)
- 🔺 Overextension above supply zone without support → trap risk
- 🔺 Bull trap risk if price spikes above 3,340 then sharply reverses
---
## ✅ Summary:
> **Start of July** could fuel volatility and directional momentum.
> The structure is clearly bullish short-term, but upper liquidity zones remain **highly reactive**.
> Smart traders will wait for reaction at the 3,340–3,350 SH zone before overcommitting.
**Structure:** 🟢 Bullish
**Trend:** 📈 MSU
**Efficiency:** ✅ Clean
**Liquidity:** 🔺 Above SH & Below recent HL
---
📊 Prepared by: **Mohsen Mozafari Nejad**
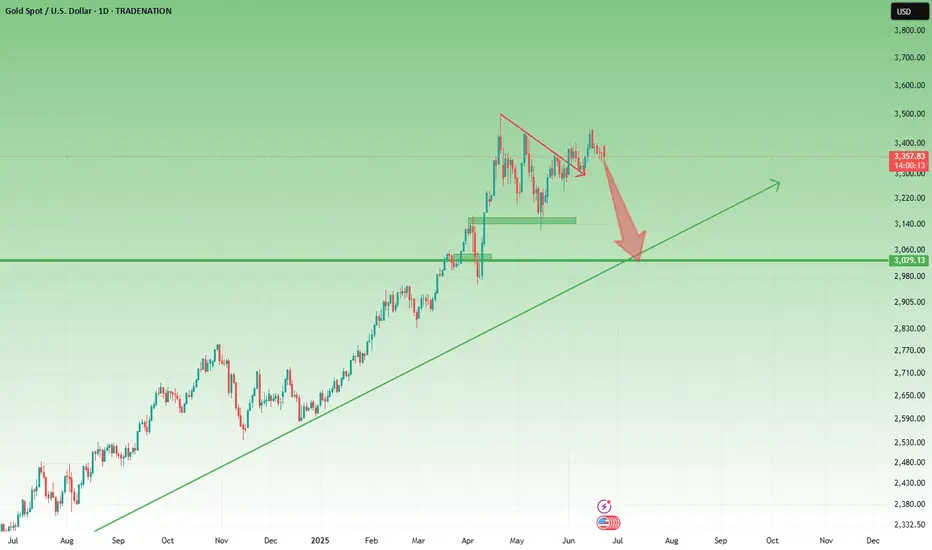
Goes to 3400 and drop to 3000It can reach 3400 and then it will be rejected and come to 3000 dollars
So if you are thinking of investing this is not a good place. Let it come lower then enter at a better price
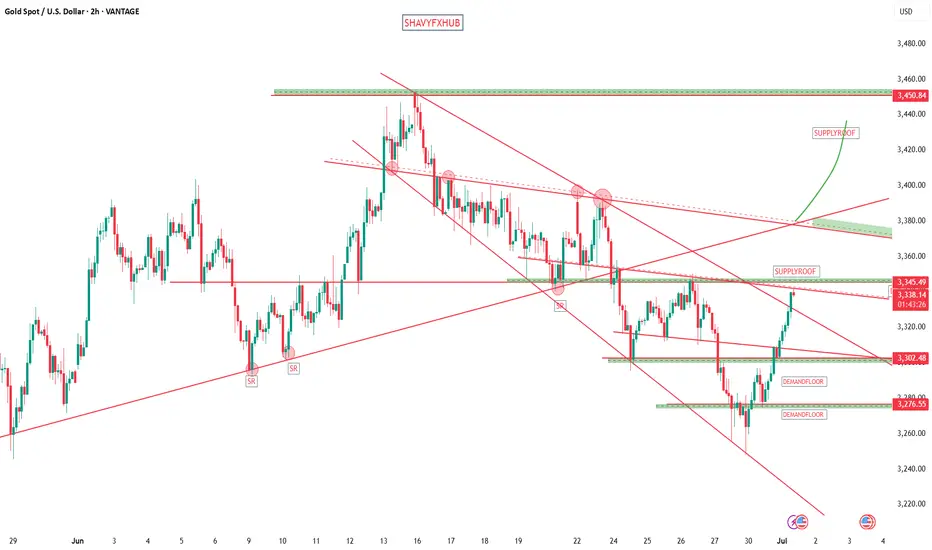
GOLD GOLD ,EARLY SELL signal 3341-3345 2hr supply roof a previous neckline of a broken double top in the form of a descending trendline ,the restest is 3341-3345.
my goal is 3378-3380 supply zone
7.1 London gold rebounds and rises, gold market trend analysis aGold rose to 3295 in the Asian session on Monday and was blocked. It fell in the European session as we expected, but the decline was not strong. After the lowest price of 3274.57, it rose again in the US session and stood firmly at the 3300 mark. The monthly line closed with a cross Yang K. The gold price continued to rise at the opening today. After the market on Monday, the 3247 below can be used as a reference for the bottom rebound position. Now the short-term trend belongs to the bulls, so we will continue this trend today and look at the upward trend first, wait for the European session to see the strength of the decline and then formulate the idea of the US session.
From the market point of view, after the gold price stood above the 3300 mark again, it is used as a short-term support level reference for the bulls. The Asian session can rely on this position to arrange long orders to see the continuation of the upward trend; the initial pressure on the upper side focuses on the 3328 position, followed by 3345. Now that the idea is established, the idea for intraday operations is: wait for the gold price to pull back to around 3308 in the Asian session and then go long and bullish, protect the 3300 mark, and target around 3328; if there is pressure at 3328 in the European session, you can arrange short positions with a downward trend, wait for the US session, and then decide whether to go long again based on the pullback position and target around 3345.

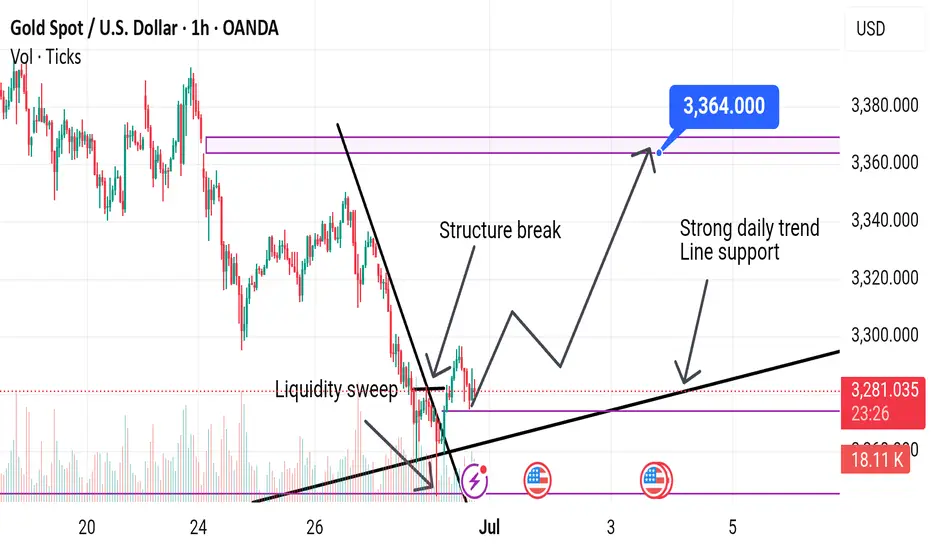
Bullish in H1 time frame inside the D1 range Liquidity has been taken from the downside of the current daily timeframe range, and the price is likely to rise.
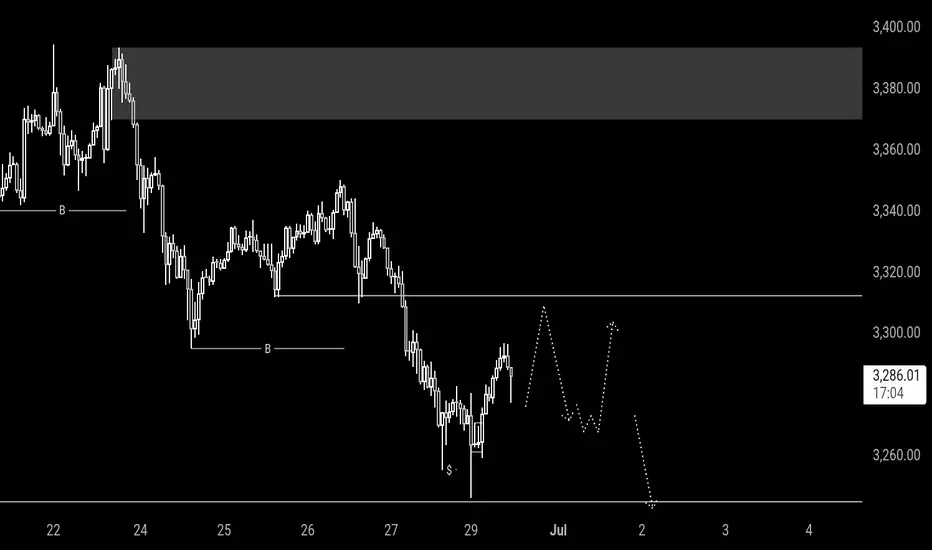
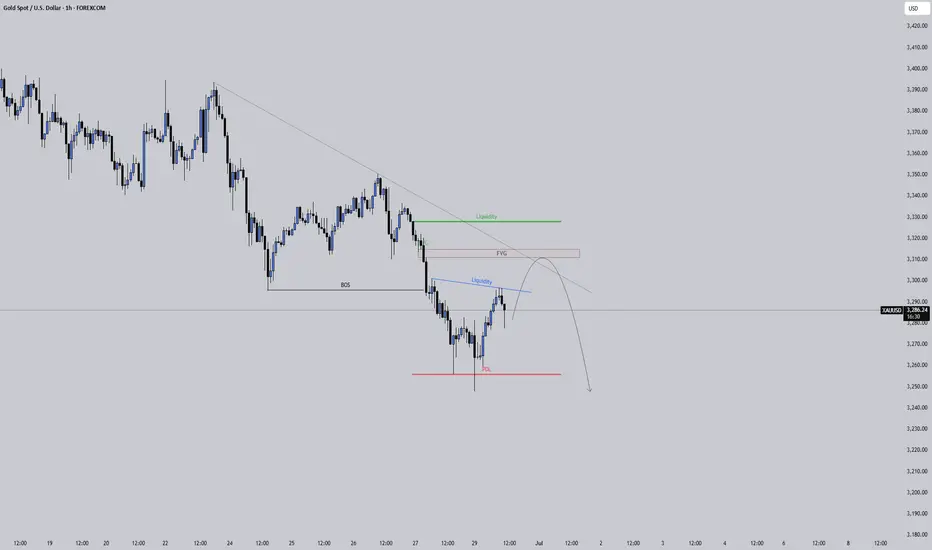
Watching Gold Tap Liquidity Before the Next DropGold is still clearly in a bearish structure on the 1 hour chart. We’ve seen a solid break of structure to the downside and price is now retracing.
What stands out is how price is pushing back up into multiple areas of interest. There’s liquidity resting just above this minor high along with a fair value gap and the underside of a bearish trendline. This cluster makes it a likely spot for sellers to step back in.
If price fills the imbalance around that FVG, it could set up the next leg lower. I’ll be watching closely for signs of rejection in this zone to see if the market is ready to continue the move down.
No reason to rush in early. Let price come to the levels that matter and confirm with a reaction. Staying patient pays.
GOLD: The Market Is Looking Down! Short!
My dear friends,
Today we will analyse GOLD together☺️
The in-trend continuation seems likely as the current long-term trend appears to be strong, and price is holding below a key level of 3,295.36 So a bearish continuation seems plausible, targeting the next low. We should enter on confirmation, and place a stop-loss beyond the recent swing level.
❤️Sending you lots of Love and Hugs❤️
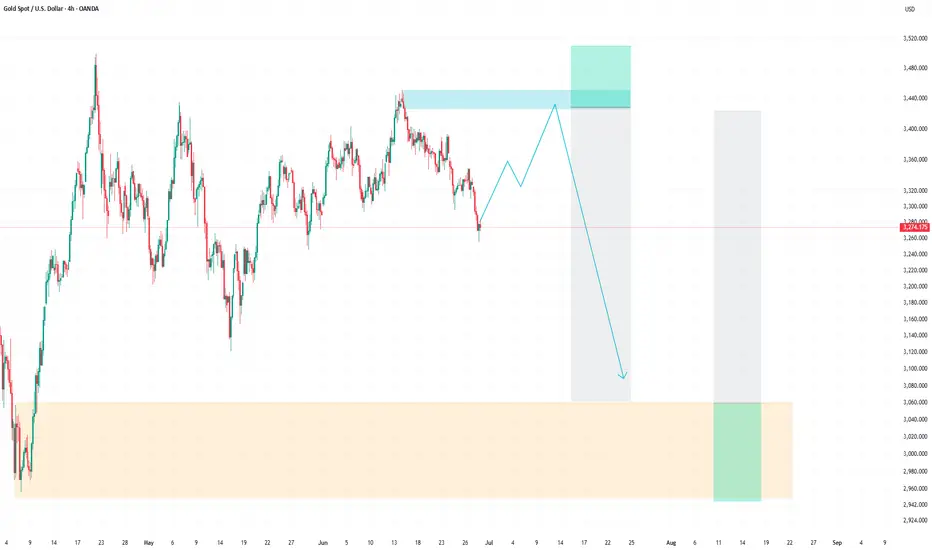
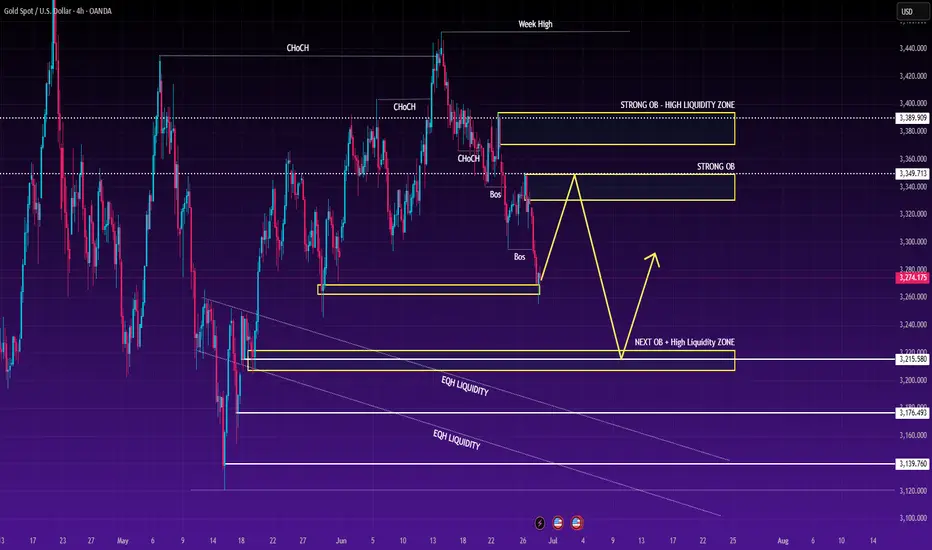
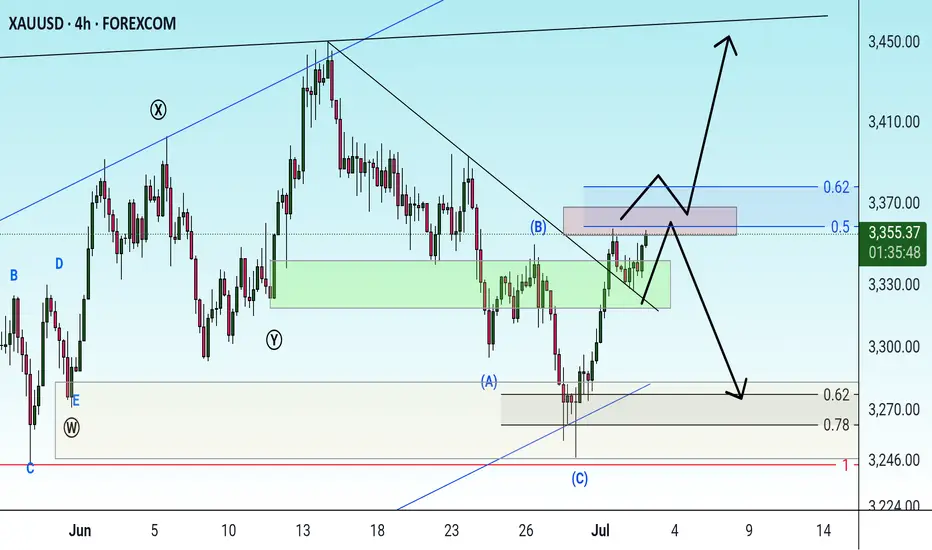
XAUUSD – Smart Money Flow & Weekly OutlookGold reacted precisely at the key OB zone near 3270. Following a clear Break of Structure (BOS) on the H4, Smart Money may be redistributing positions.
🔍 Main scenario:
Price is expected to retrace to the 3349–3360 OB zone, where strong sell-side reactions may occur.
If that fails, the next likely move is a drop toward the high-liquidity demand zone at 3215, where buyers could re-enter.
📰 Key macro drivers:
Final GDP and PCE data show slight economic cooling in the US, reinforcing expectations that the Fed will maintain higher-for-longer rates.
Trump’s recent comments stir political uncertainty, increasing safe-haven demand for gold.
🎯 Strategy:
Look for confirmed short setups near 3349–3360.
Consider longs at 3215 if strong bullish reaction forms.
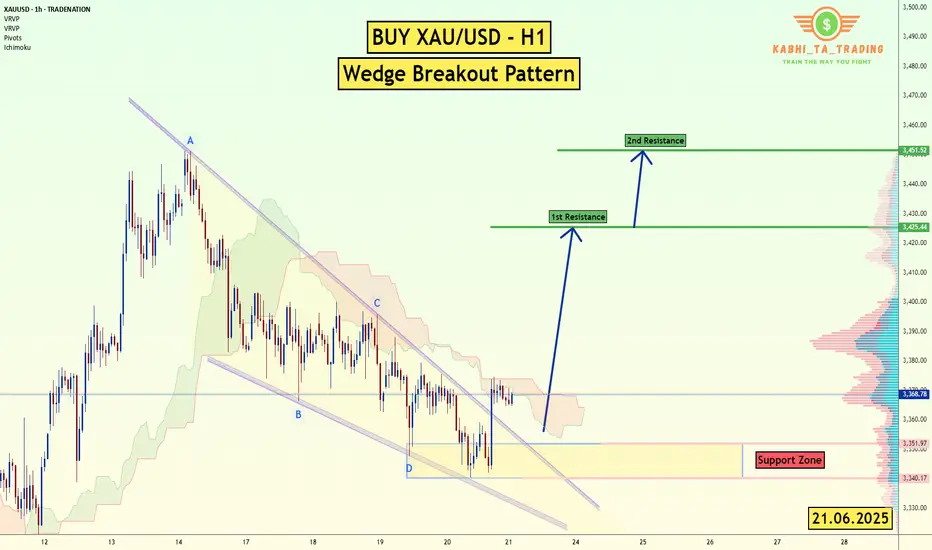
XAU/USD (Gold) - H1 - Wedge Breakout (21.06.2025)The XAU/USD pair on the H1 timeframe presents a Potential Buying Opportunity due to a recent Formation of a Wedge Breakout Pattern. This suggests a shift in momentum towards the upside and a higher likelihood of further advances in the coming Days.
Possible Long Trade:
Entry: Consider Entering A Long Position around Trendline Of The Pattern.
Target Levels:
1st Resistance – 3425
2nd Resistance – 3451
🎁 Please hit the like button and
🎁 Leave a comment to support for My Post !
Your likes and comments are incredibly motivating and will encourage me to share more analysis with you.
Best Regards, KABHI_TA_TRADING
Thank you.
Disclosure: I am part of Trade Nation's Influencer program and receive a monthly fee for using their TradingView charts in my analysis.
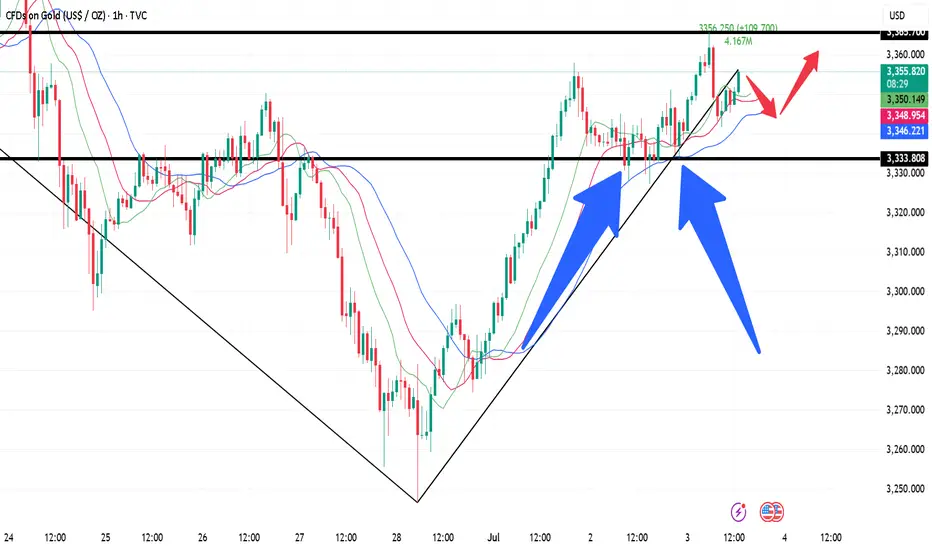
7.3 Prediction of gold price fluctuation before non-agriculturalAfter the release of ADP data last night, gold prices resumed their rise and crossed the high of 3357.88 this week and closed near this position. Today, gold prices opened high and then fell back. Pay attention to the strength of the correction in the morning session and choose the opportunity to go long and bullish. From the current market perspective, the support below can focus on the low point of yesterday's US session near 3333, followed by 3327; before the release of non-agricultural data, the upper pressure will focus on the early trading start point 3366, followed by 3375. The operation in the Asian and European sessions is mainly to go long on the correction, and the high-altitude thinking is abandoned. Specific operation ideas: Go long and bullish when the gold price falls back to around 3338, protect the position of 3330, and the target is to see whether the early trading high of 3365 can break!
Daily live trade with XAUUSD in 15m/30m/1h 20250703Daily live trade with XAUUSD in 15m/30m/1h 20250703
Gold BullishAfter exiting a correction, the first impulse (Wave 1) appears. I expect a retracement of at least 50% of the Fibonacci.
Today's gold trading strategy, I hope it will be helpful to youThe current gold price stands at $3,288. The gold market was volatile in the early session: after the opening, prices plunged all the way, hitting a low of $3,247 at one point. However, it quickly rebounded, climbing back above $3,280. It was quite a roller-coaster ride, full of thrills.
**Influencing Factors**
- **Geopolitical Situation**: While the Middle East (situation) had eased earlier—such as the ceasefire agreement between Israel and Iran, which weakened gold’s appeal as a safe-haven asset (COMEX gold futures fell over 2% on the day the ceasefire was reached)—Trump stated today that he would consider bombing Iran again and abandon plans to lift sanctions. This reignited market safe-haven sentiment, attracting some bargain-hunting buying to support gold prices.
- **Monetary Policy**: Market expectations for Federal Reserve rate cuts have been fluctuating. The CME FedWatch Tool shows an 81.9% probability of rates remaining unchanged in July, and a 76% probability of a cumulative 25-basis-point rate cut by September. The previously released U.S. PCE data exceeded expectations, and coupled with the impact of tariff policies on the pace of rate cuts, these factors are swaying gold’s trend.
- **Capital Flows**: Global gold ETF demand turned negative in May, with funds in North America and Asia leading the outflows. This put pressure on the gold market—it’s like the water flowing into the gold market has dwindled, or even started to flow out, pulling prices downward.
**Technical Analysis**
Last week, gold’s overall trend leaned toward a pullback, with the lowest price touching around $3,255, and the weekly chart closing with two consecutive. Gold even breached $3,250 last Friday, but rebounded slightly at the start of this week supported by that level. However, there is significant pressure in the $3,300–$3,310 range above. If gold can stand firmly above $3,300 this week, the short-term trend may shift. But if it continues to trade below $3,300, it will likely keep falling, possibly testing around $3,200.
Moreover, the non-farm payroll data will be released this Thursday (due to the U.S. market closure on Friday, the data is being released early). This timing quirk could also trigger unusual volatility in market sentiment this week.
On the daily chart, moving averages are in a bearish alignment; the MACD lines are below the zero axis with a death cross formed, and the green energy bars are expanding—indicating that bearish momentum is dominant. However, the RSI is around 39, near the oversold zone, suggesting a potential short-term rebound for a correction.
*Trading Strategy**
Wait for gold to rebound to the $3,310–$3,305 range to short. This level is a key resistance zone mentioned earlier; if prices can reach here, it will signal persistent bearish pressure. Set a stop-loss around $3,320 to guard against a breakout above resistance and a sustained rally. The initial target can be the $3,290–$3,280 range, where you can gradually close positions for profits based on price movements and market sentiment. If prices continue to fall, adjust the target accordingly—for example, toward around $3,250.
Today's gold trading strategy, I hope it will be helpful to you
XAUUSD sell@3310~3305
SL:3320
TP:3290~3280

XAUUSD Analysis todayHello traders, this is a complete multiple timeframe analysis of this pair. We see could find significant trading opportunities as per analysis upon price action confirmation we may take this trade. Smash the like button if you find value in this analysis and drop a comment if you have any questions or let me know which pair to cover in my next analysis.

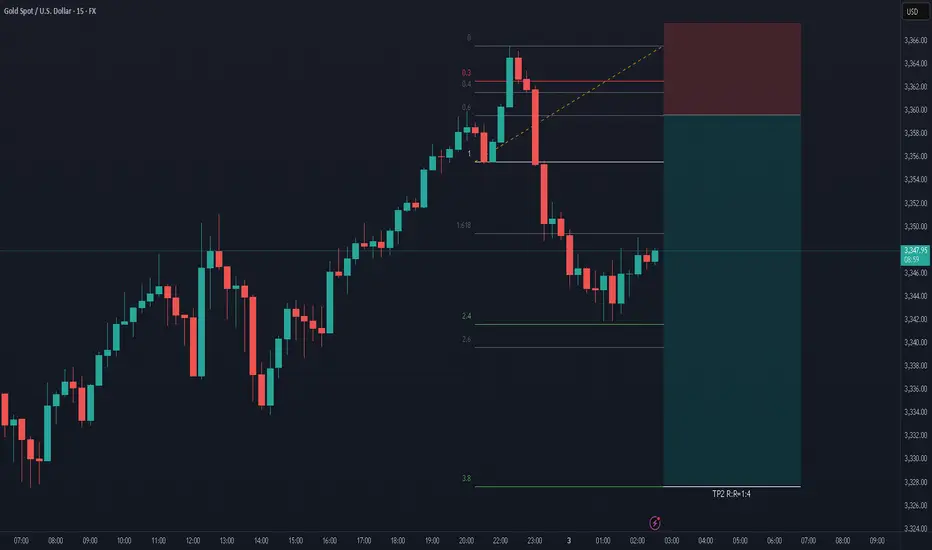
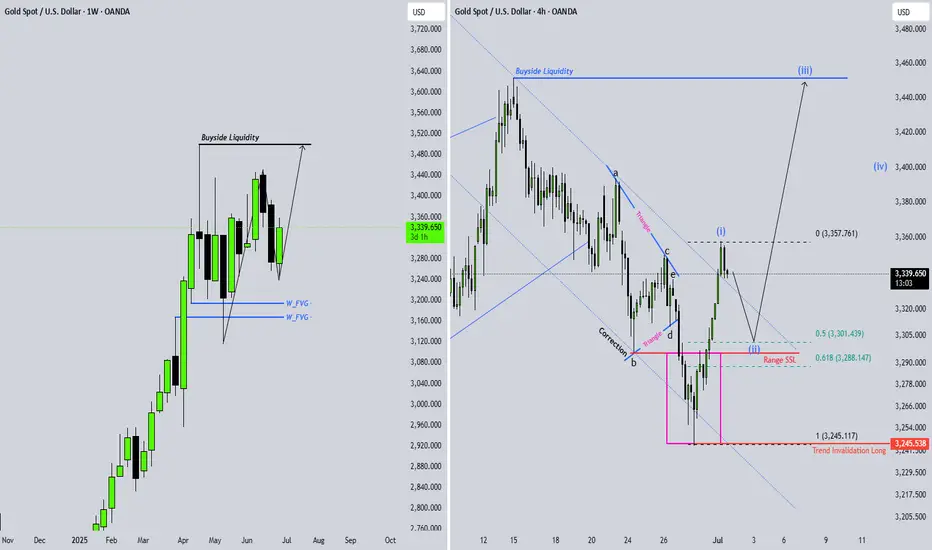
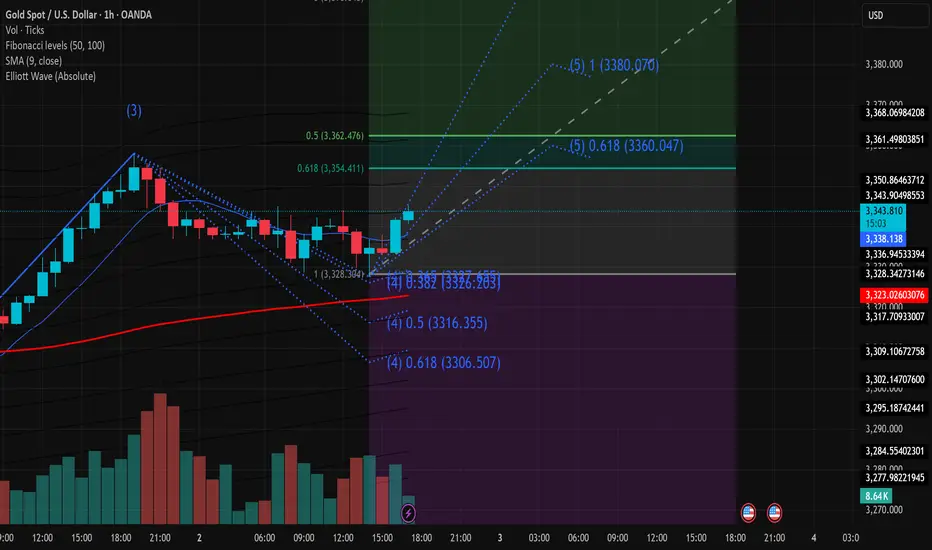
XAUUSD Technical Analysis – 02/07/2025On the 1-hour chart, Gold (XAUUSD) has just confirmed the completion of corrective wave (4) around the 3,328.3 zone, which aligns with the 1.0 Fibonacci level and EMA9 support. Currently, price is rebounding with increasing volume, signaling that buying momentum is returning.
Key Technical Highlights:
Elliott Wave Structure:
Wave (4) found support at 3,328.3.
Wave (5) targets are forming, with Fibonacci extensions pointing to:
0.618: 3,360.05
1.0: 3,380.07
=> These are critical resistance zones to watch.
Fibonacci Retracement Zones:
The current rebound is heading toward the 0.5 and 0.618 retracement levels of the previous down leg, located at 3,362.4 and 3,354.4 – short-term upside targets.
Volume Analysis:
Rising volume on bullish candles confirms a legitimate buying interest, supporting the upward movement.
EMA9 Breakout:
Price has broken above the EMA9 at 3,338.2, shifting short-term trend bias to bullish.
Suggested Trading Strategy:
Favor Buy on Dip entries near the 3,340–3,342 zone if a minor pullback occurs.
Short-term targets: 3,354 – 3,362
Extended target: 3,380
Suggested stop loss below 3,328.0 to manage risk.
Conclusion:
A bullish impulse is forming following the end of wave (4). If price holds above 3,340 and breaks through the nearby Fibonacci resistance levels, wave (5) could extend towards the 3,380 area. This is a pivotal moment to watch for a confirmed short-term uptrend.
Check the trend Given the price behavior within the current resistance range, possible scenarios have been identified. It is expected that after some fluctuation within the current resistance range, a trend change will take place and we will witness the beginning of a downtrend. With consolidation above the resistance range, an uptrend will be likely.
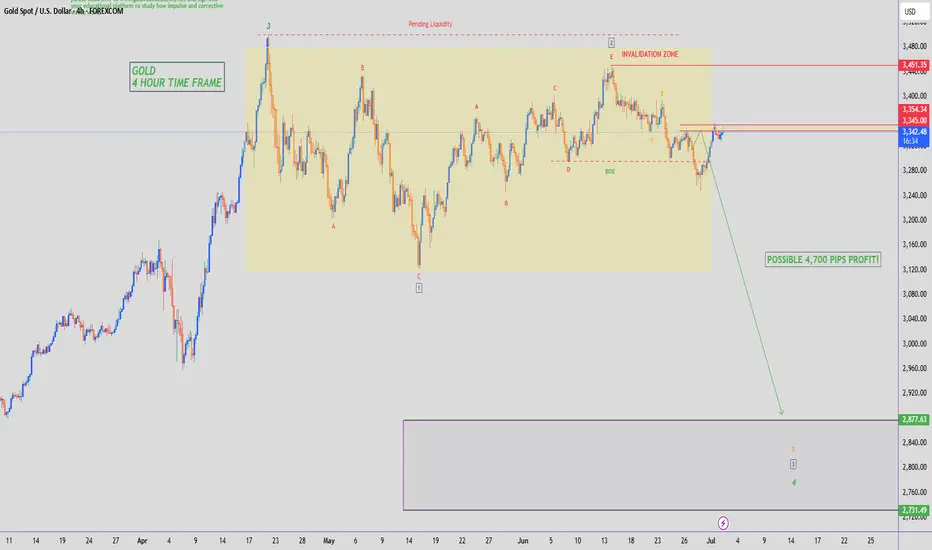
GOLD - SHORT TO $2,800 (UPDATE)Another beautiful, bearish rejection from our resistance zone on Gold. Our 1st resistance zone of $3,350 is still holding.
If buyers take out this level, another zone to watch out for is the $4,006 - $4,022 zone as there is a lot of pending liquidity sitting around that zone.