Excellent start of E.U. sessionAs discussed throughout my yesterday's session commentary: "My position: I am Highly satisfied with my Profit and will take early weekend break, not catching a Falling knife."
I have monitored the Price-action from sidelines throughout Friday's session as explained above however mid E.U. session I have engaged two #100 Lot Buying orders on #3,278.80 few moments ago and closed both of my Scalps on #3,285.80 with excellent Profit.
Quick update: No Swing orders today, only aggressive Scalps similar to Scalp orders I mentioned above from my key re-Buy points. If #3,300.80 is recovered, newly formed Bullish structure will push for #3,313.80 and #3,327.80 test. If #3,300.80 benchmark is preserved, I will still keep Buying (Scalp only however). I will have Gold's major move revealed after today's session.
XAUUSD.F trade ideas
Gold continues to be weak, but be careful about operations
📣Gold prices fell 2% last Friday, hitting a near one-month low. Optimistic trade-related agreements boosted risk appetite and weakened the attractiveness of gold as a safe-haven asset. This week, the market will usher in a group meeting of major central bank governors around the world (Fed Chairman Powell, European Central Bank President Lagarde, Bank of England Governor Bailey, Bank of Japan Governor Kazuo Ueda, and Bank of Korea Governor Lee Chang-yong). The market will also usher in non-agricultural data. In addition, Powell's remarks on whether to resign may ignite the market this week. Gold prices may fluctuate more around the lower track of the Bollinger Band at $3,270/ounce this week.
Technical analysis:
Last Friday, the K-line had a lower shadow, and the Bollinger Band did not diverge. It is not easy to go short directly in operation, but wait for the rebound to confirm 3295 and the key resistance of ma5 to be short.
💰 Operation strategy: Rebound to 3280-3283 to go short, target 3270-3265, stop loss 3288-3290
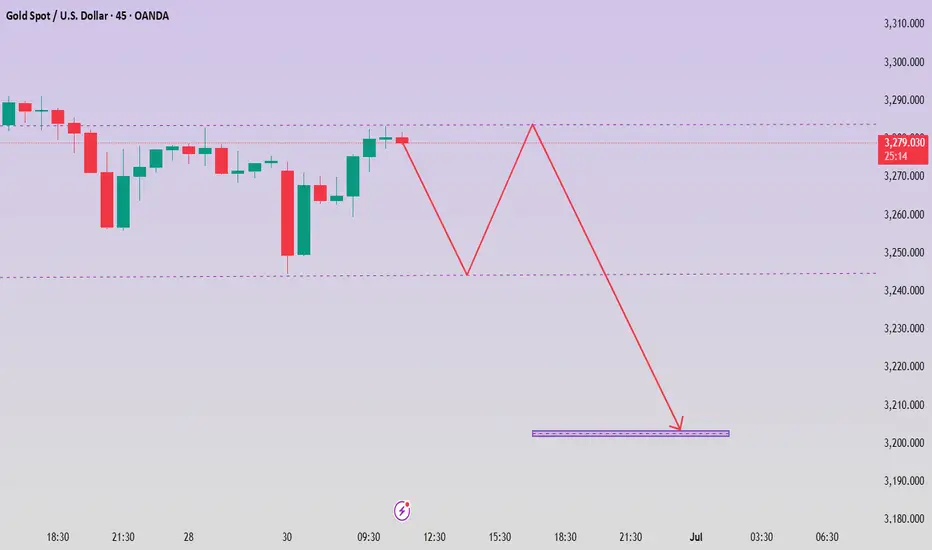
Gold trend next week: shorts are dominant, longs are secondaryGold trend next week: shorts are dominant, longs are secondary
(June 29, 2025)
Analysis of current market situation and key price levels:
The gold market has completely entered the short-dominated stage, and the technical pattern shows a typical step-down trend.
This week, the market rebounded to only $3,321 before continuing to fall, breaking through the 3,300 psychological barrier, the 3,280 technical support level and the daily level trend line, forming a standard downward channel.
The current price is testing the key support area of 3,250-3,270.
Moving average system: The 50-day moving average (3,325) and the 200-day moving average (3,288) formed a death cross, and the price continued to fall below all major moving averages.
Trading volume characteristics: When COMEX gold futures fell below 3,300 points, the trading volume increased to 180% of the daily average, indicating an increase in short positions.
Position structure: CFTC data showed that speculative net long positions fell to the lowest level in 12 months.
A single buy order of more than 5,000 lots (about 160 million US dollars) appeared in the 3270 area.
Operation strategy for next week:
Scenario 1: 3270 support level is effective (probability 40%)
Rebound target: 3295 points (intraday) → 3313 points (intraweek)
Operation suggestion:
Radicals can try to go long with a light position at 3268-3272 points. (Stop loss 3258)
Conservatives wait for a breakout of 3285, then fall back to 3278 for follow-up
All long orders are closed in batches above 3310
Scenario 2: Direct break down (probability 55%)
Downward target: 3250→3232 (April low)→3200 psychological barrier
Operation strategy:
Current price short orders can be held to 3250 to close half of the position
Rebound to 3285-3290 to increase short positions (stop loss 3303)
After breaking 3250, be cautious in chasing shorts (to prevent short-term short covering)
Scenario 3: Range oscillation (probability 5%)
Volatility range: 3270-3295
Event-driven strategy:
Focus on July 1 ISM manufacturing PMI (North 22:00 Beijing time)
Fed officials' speeches (especially Williams' speech at 09:30 on July 2)
Institutional order flow analysis:
There are stop-loss orders worth about $320 million below 3270
Above 3300, there are about $280 million of sell orders (mainly from CTA strategies)
Special tips for risk control
Liquidity risk: Market liquidity may drop sharply before the July 4th Independence Day holiday in the United States
Risk of sudden policy changes: There may be changes in the ceasefire agreement between Russia and Ukraine
Technical traps:
Beware of the "false breakthrough" that may appear in the 3270 area
Note the weakening of the short-term correlation between US Treasury yields and gold
In the current market environment, it is recommended to adopt the "main short and secondary long" trading strategy.
For short-term traders, the rebound opportunity in the 3270 area is worth participating in with a light position;
Mid-term investors should remain patient and wait for clearer reversal signals or lower safety margins.
A panoramic analysis of the gold market in June: an in-depth interpretation of geopolitics, monetary policy and price trends.
The current gold market is at a critical turning point, with multiple factors interweaving to affect the short-term fluctuations and long-term trends of gold prices.
As of June 29, 2025, the international gold price has experienced violent fluctuations, falling from the high point at the beginning of the month to a low point in the past four weeks, and market sentiment has shifted from optimism to caution.
This article will comprehensively sort out the latest gold market dynamics, deeply analyze the impact of geopolitical risks, the direction of the Federal Reserve's monetary policy, the global economic situation and technical factors on gold prices, and look forward to the possible trend of the gold market in the future, providing investors with a comprehensive market perspective and strategic recommendations.
The latest gold price trends and market overview:
In June 2025, the international gold market experienced significant price fluctuations, showing a trend of "first rise and then fall". As of the close of June 28, the spot gold price was $3273.11/ounce, down 1.64% from the previous trading day, hitting the lowest level since December 2024;
The multiple factors that led to the plunge in gold prices include:
The strengthening of the Federal Reserve's hawkish signals, the easing of geopolitical risks, and the intensification of technical selling.
The US core PCE price index released on June 27 rose 2.8% year-on-year, higher than market expectations. Several Fed officials publicly stated that "interest rates may be raised by another 50 basis points this year", causing the US dollar index to soar to 107.5, which strongly suppressed gold.
At the same time, the two sides of the Russian-Ukrainian conflict reached a phased ceasefire agreement on June 25, and the market's risk aversion demand dropped sharply, and the gold ETF holdings decreased by 42 tons in a single week.
Technically, the gold price fell below the key point of $3,400, triggering a large-scale liquidation of algorithmic trading. The trading volume of gold futures on the New York Mercantile Exchange (COMEX) surged to three times the usual day, further exacerbating the downward momentum.
From the perspective of market structure, the current gold market shows obvious differentiation characteristics:
On the one hand, institutional investors such as hedge fund giant Bridgewater Fund were exposed to reduce their holdings of gold ETF shares by more than 30% and increase their holdings of US Treasury bonds;
On the other hand, Goldman Sachs lowered its three-month gold target price from $3,600 to $3,100 on the grounds that "the upward cycle of real interest rates has not ended." This shift in institutional behavior reflects the market's pessimistic expectations for gold's short-term prospects.
It is worth noting that despite the short-term weakness, long-term support factors for gold still exist.
Global central bank demand for gold purchases increased by 18% year-on-year in the first quarter of 2025. Central banks in emerging markets such as China and India continued to increase their holdings of gold to diversify foreign exchange reserve risks.
In terms of physical demand, the China-India wedding season (June-August) and the expected "October" consumption peak season, gold jewelry demand accounted for more than 45% of global total demand, and China's gold consumption in 2025 may exceed 1,200 tons (an increase of 8% year-on-year).
This resilience of supply and demand fundamentals provides potential support for gold prices.
The impact of geopolitical risks on the gold market
Geopolitical factors have always been an important variable affecting gold prices. Changes in the global geopolitical pattern in June 2025 have had a significant impact on the gold market.
The sharp fluctuations in gold prices this month are closely related to the evolution of geopolitical events such as the situation in the Middle East and the Russia-Ukraine conflict. These events directly affect the demand intensity of gold as a "safe haven asset" by changing the market's risk aversion sentiment.
The situation in the Middle East has experienced a transition from tension to relaxation this month, becoming a key driver of the rise and fall of gold prices.
In early June, concerns about the escalation of the conflict between Israel and Iran pushed the price of gold to $3,415 per ounce.
Market data shows that for every 10 points increase in the historical geo-risk index, the price of gold has risen by an average of 2.3%.
However, as Israel revised the hostage negotiation plan, direct conflict between Iran and Israel was temporarily suspended, and tensions in the Middle East showed obvious signs of easing.
In late June, Trump publicly declared that "the Israel-Iran conflict is over", further weakening the market's risk aversion demand.
The fading of this geo-risk premium directly led to a decline in the attractiveness of gold as a safe haven asset, becoming one of the important factors for the decline in gold prices.
The development of the Russia-Ukraine conflict also had a significant impact on the gold market.
On June 25, Russia and Ukraine reached a phased ceasefire agreement. This breakthrough has significantly boosted market risk appetite and further weakened the safe-haven demand for gold.
Prior to this, the market had generally worried that if the ceasefire negotiations broke down or the scope of the conflict expanded, it might push up the volatility of gold prices. The conclusion of the ceasefire agreement eliminated this uncertainty, resulting in a 42-ton decrease in gold ETF holdings in a single week, reflecting the rapid cooling of investors' risk aversion.
It is worth noting that although geopolitical risks have eased recently, potential risk factors still exist.
The "proxy war" in the Middle East (such as the attack on Red Sea merchant ships by the Houthi armed forces in Yemen) is still ongoing, and the security risks of global energy transportation channels (such as the Suez Canal) have not been completely eliminated.
In addition, geopolitical variables such as the 2025 US election (November) and the expected winter offensive of the Russia-Ukraine conflict may still push up safe-haven demand in the future. The "safe-haven attribute" of gold as an important safety cushion for its price has not completely disappeared.
From historical experience, the impact of geopolitical events on gold often presents the characteristics of "buy expectations, sell facts".
When a geopolitical crisis first appears or escalates, the price of gold usually rises rapidly; once the situation eases or the solution becomes clear, the price of gold will fall back.
The market performance in June 2025 once again verified this rule.
However, our team believes that the current easing of the geopolitical situation may only be temporary, and the structural contradictions in the Middle East and Eastern Europe have not been fundamentally resolved. New conflicts may still break out in the future, which will provide potential support for gold prices.
In terms of the interactive relationship between geopolitics and gold prices, the market needs to pay attention to several key nodes: First, whether the situation in the Middle East will be repeated, especially the direction of relations between Iran and the United States and Israel;
Second, whether the ceasefire agreement between Russia and Ukraine can continue, and whether large-scale military operations will be restarted in winter;
Third, the uncertainty of geopolitical policies in the US election year, especially the policy statements on key regions such as the Middle East and Asia-Pacific.
These factors may rekindle the market's risk aversion in the future and drive the gold price to rebound.
Analysis of the Federal Reserve's monetary policy and the trend of the US dollar:
The Federal Reserve's monetary policy trends and the trend of the US dollar have always been the core factors affecting the price of gold. The changes in the market's expectations of the Federal Reserve's policies in June 2025 directly led to the sharp fluctuations in the price of gold. As an interest-free asset, the price of gold is negatively correlated with the actual interest rate level, and the Federal Reserve's interest rate policy has a profound impact on the trend of the US dollar index and global capital flows, which makes the Federal Reserve's every move affect the nerves of the gold market.
In June, the Federal Reserve's policy stance showed a clear hawkish turn, which put heavy pressure on the gold market.
The US core PCE price index released on June 27 rose 2.8% year-on-year, higher than market expectations. This data strengthened the reason for the Federal Reserve to maintain high interest rates.
Several Federal Reserve officials subsequently publicly stated that "another 50 basis points of interest rate hikes may be made this year", causing the US dollar index to soar to 107.5, a recent high.
According to the CME "Fed Watch" tool, as of June 27, traders bet on a 79.3% probability of keeping interest rates unchanged in July, and only 20.7% expected a single rate cut of 25 basis points; in the forecast for September, the probability of cumulative rate cuts of 25 or 50 basis points reached 74.9% and 19.1%, respectively.
This change in interest rate expectations directly pushed up the US dollar and suppressed the price of gold denominated in US dollars.
There are obvious differences within the Federal Open Market Committee (FOMC) on the timing of rate cuts, and this policy uncertainty has exacerbated the volatility of the gold market.
Some officials emphasized the resilience of the job market and the potential upside risks of inflation, and believed that it was necessary to wait for more economic data observations after the implementation of tariff policies;
Other views tended to take preventive easing measures in the fall.
In his speech after the June interest rate meeting, Fed Chairman Powell emphasized that "there is no rush to cut interest rates", further dampening the market's expectations for a shift in monetary policy in the short term.
This inconsistency in policy signals has caused gold investors to wait and see, and some funds have chosen to temporarily withdraw from the gold market.
The strong rebound of the US dollar index is a direct factor suppressing gold prices.
As the market's expectations for the Fed to maintain high interest rates heat up, the US dollar index has rebounded significantly from its annual low and has broken through the 107 mark as of June 28.
The strengthening of the US dollar makes gold denominated in US dollars more expensive for holders of other currencies, suppressing international demand.
Technical analysis shows that the cyclical (monthly) turning point of the US dollar index is coming. Due to its recent obvious downward trend, the impact of this turning point is obviously biased towards the US dollar, which may further suppress gold prices.
It is worth noting that there is a dual mechanism for the impact of the Fed's policy on gold.
In the short term, the hawkish stance pushes up the US dollar and real interest rates, directly suppressing gold prices; but in the medium and long term, maintaining high interest rates may increase the risk of economic recession, which may enhance the safe-haven appeal of gold in the future.
The current market is in a stage of game between these two forces, which is also an important reason for the intensified volatility of gold prices.
The Fed's balance between suppressing inflation and avoiding a hard landing of the economy will determine the future direction of gold.
In the coming period, the market needs to pay close attention to several key data points to judge the direction of the Fed's policy:
First, the change in inflation data around the deadline for tariff suspension on July 9;
Second, employment and GDP data before the Fed's interest rate meeting in September;
Third, the impact of global supply chain conditions on core inflation.
These factors will jointly determine the Fed's policy path, and thus affect the medium-term trend of gold prices.
If the US economic data shows obvious signs of slowing down, it may restart the market's expectations for interest rate cuts, which will provide upward momentum for gold;
On the contrary, if the economy remains resilient and inflation remains high, gold may continue to be under pressure.
Analysis of the global economic situation and gold demand:
Changes in the global macroeconomic environment have a profound impact on the gold market. The complex situation of the global economy in June 2025 has created a structural differentiation in gold demand.
On the one hand, trade policy uncertainty and concerns about slowing growth support the safe-haven demand for gold;
On the other hand, the inhibitory effect of high gold prices on physical consumption and the adjustment of the pace of gold purchases by some central banks put pressure on gold prices. This interweaving of long and short factors puts the gold market in a delicate balance.
The uncertainty of tariff policy has become an important variable affecting the gold market.
The US government has made it clear that it will not extend the suspension period of import tariffs, which will expire on July 9. This decision will directly affect the global supply chain costs and inflation levels.
Although the specific adjustment plan has not yet been announced, the market is generally worried that if the new tariff measures are implemented, it may push up the price pressure on the production side, thereby indirectly supporting the demand for gold as a safe-haven asset.
At present, the United States has not reached an agreement framework with its major trading partners (including the European Union), and policy uncertainty may continue to provide support for gold prices.
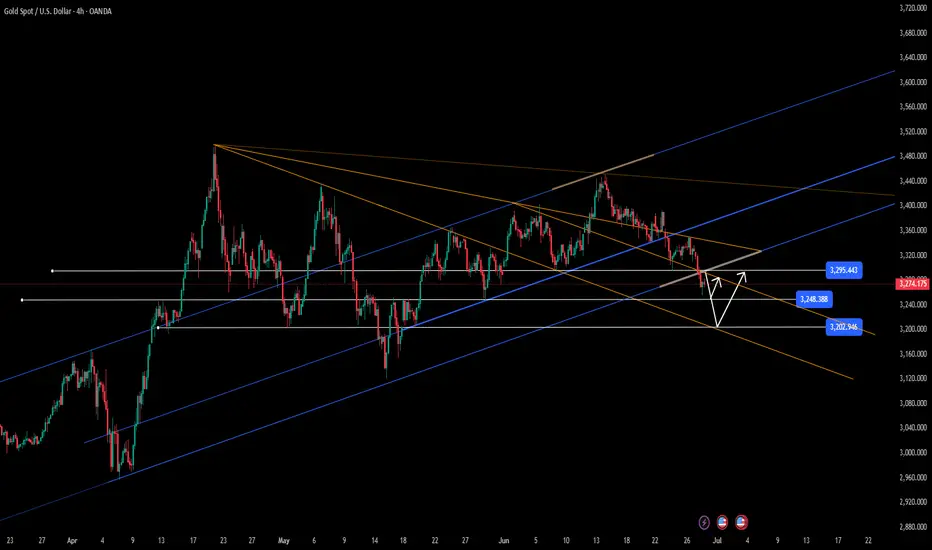
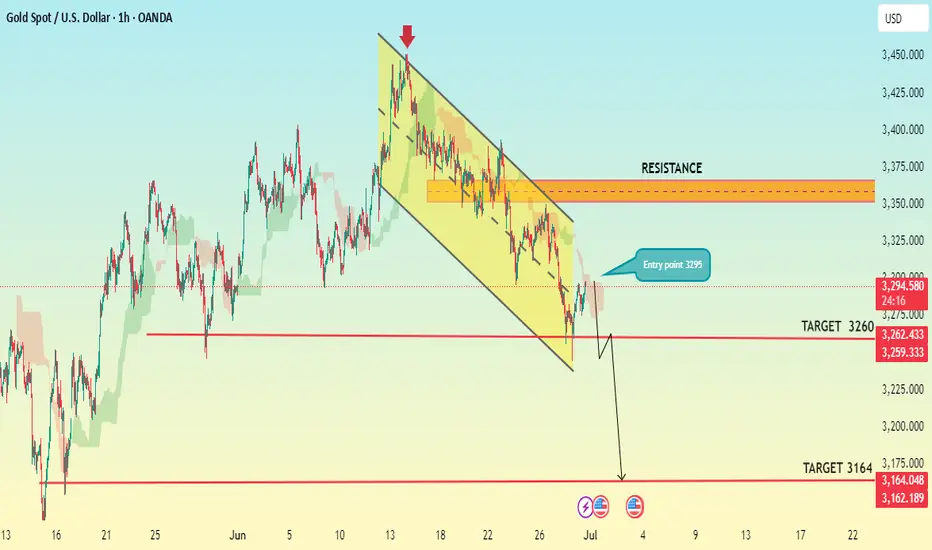
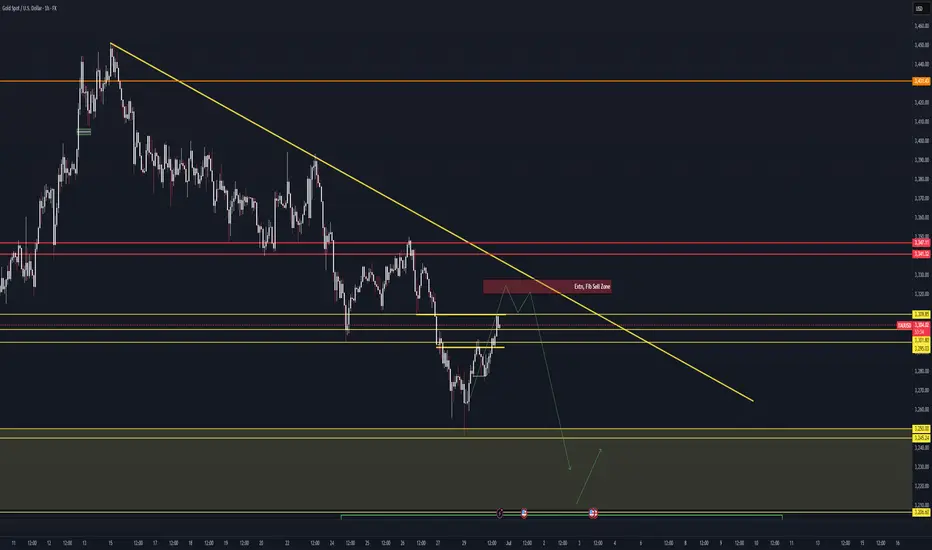
XAUUSD H-1 CHART PATTERNSell Setup (Bearish Bias)
Support: 3360
Entry Point (Sell): 3295
Target 1: 3260
Target 2: 3164
Suggested Stop Loss:
Above 3360, e.g., 3380 depending on market structure.
Summary:
Price is expected to break below the 3360 support zone.
Selling from 3295 aims to capture momentum down toward 3260 and 3164.
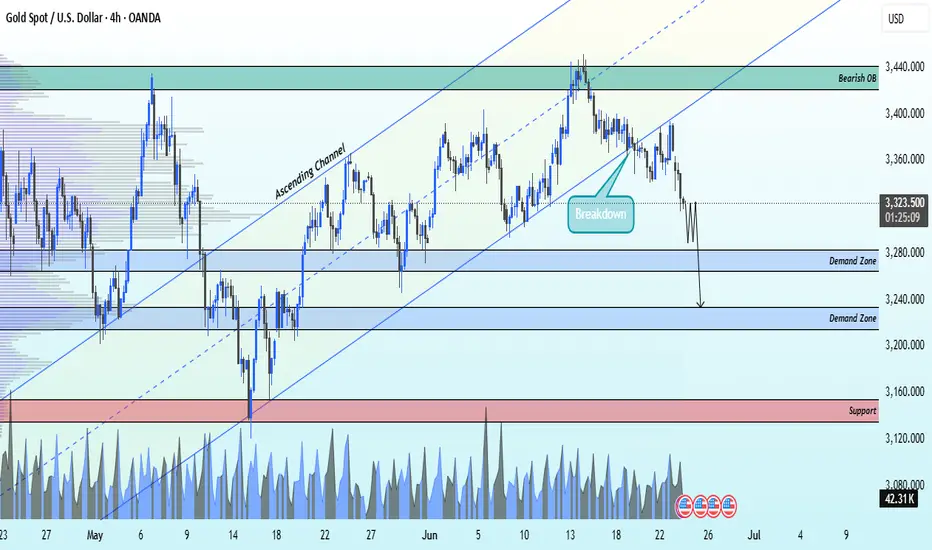
XAUUSD Has Ascending channel breakdown selling strong now🔔 XAUUSD Update – 4H Breakdown Alert!
Gold (XAUUSD) has officially broken down from the ascending channel, signaling strong bearish momentum starting from 3322.
📉 Technical Targets Ahead: 1️⃣ 3280 – First demand zone
2️⃣ 3240 – Next key demand zone
3️⃣ 3160 – Major support level
We're seeing solid selling pressure, and the 4H timeframe confirms the structure shift. Keep an eye on price action around these zones for potential reaction or continuation.
💬 Drop your thoughts in the comments!
👍 Like | 🔁 Share | ✅ Follow for live insights and real-time market updates.
Join the team for more smart trades & updates 💼
— Livia 😜
GOLD China Hong Kong gold vault hints at a geopolitical shift, as the Shanghai Gold Exchange's expansion, aims to enhance China's gold trading infrastructure and challenge Western dominance, potentially impacting demand and supply of physical gold need.
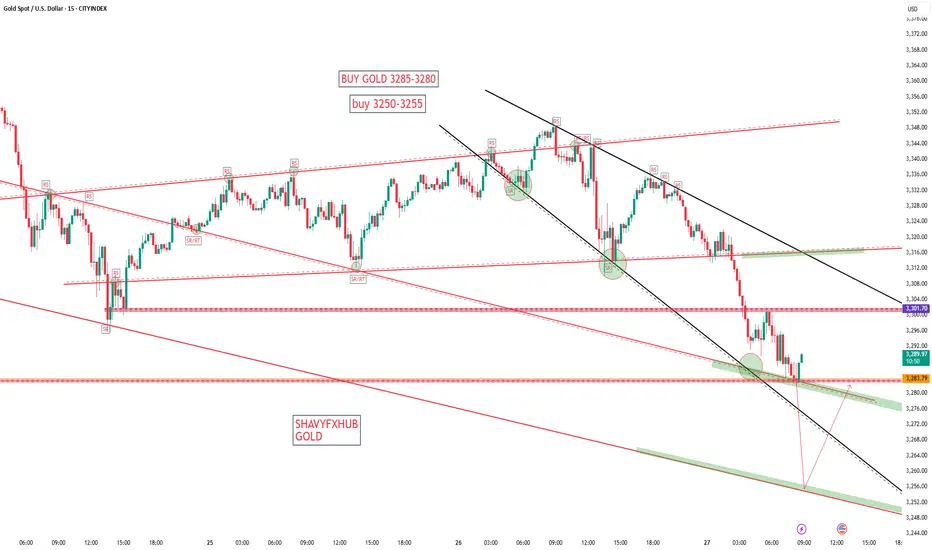
3380-3385 triggered but be cautious
wait at 3350-3355 as next demand zone for 70pips or more
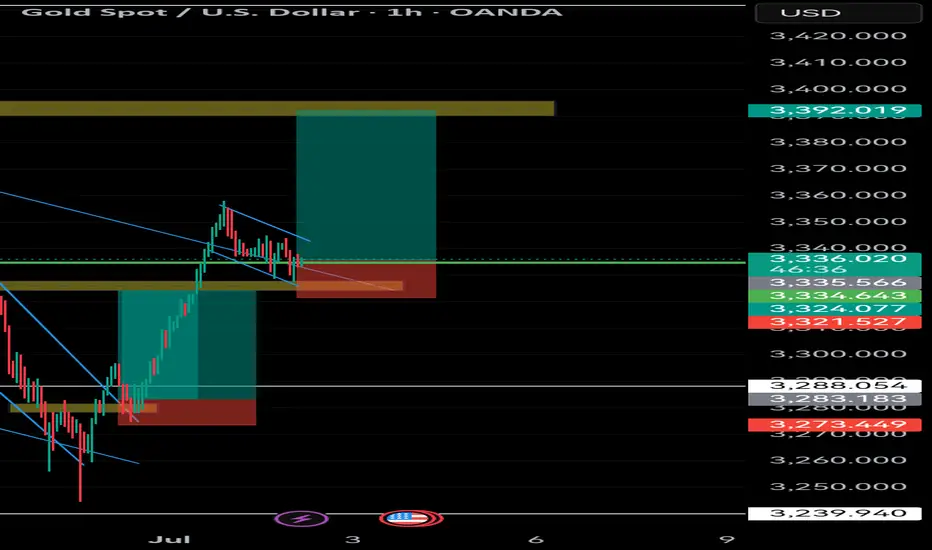
XAUUSD – High-Precision Sell Setup with 1:2.70 R/RGreetings, traders.
After a brief tactical pause, we’ve identified a **high-conviction short setup** on **XAUUSD**.
Despite the U.S. Independence Day holiday, structural momentum suggests there’s still room for meaningful movement in gold during today’s session. The risk-to-reward profile on this setup is exceptional — clocking in at **1:8.70**, it meets our highest-tier execution standards.
If momentum stalls or price consolidates excessively, the trade will be manually closed by **23:00 (UTC+4)**, regardless of outcome.
🧠 Trade Parameters:
• **Timeframe:** 1-Hour (H1)
• **Direction:** Sell
• **Entry:** 3337.09
• **Take Profit:** 3312.16
• **Stop Loss:** 3345.63
• **Risk/Reward Ratio:** 1:2,70
• **Trade Management Note:** Will be closed manually by 23:00 (UTC+4) if momentum conditions are not met.
🔗 Signal Source
All trade setups are published directly by Velatrix Capital — a high-discipline trading desk focused on FX, crypto, and global indices.
No opinions. No hype. Just statistically-grounded execution.
All signals are posted via our TradingView desk:
👉 (tradingview.sweetlogin.com)
📈 **We don’t chase hype. We build edge.**
🔔 **Subscribe for future setups and institutional-grade trade intelligence.**
**Velatrix Capital**
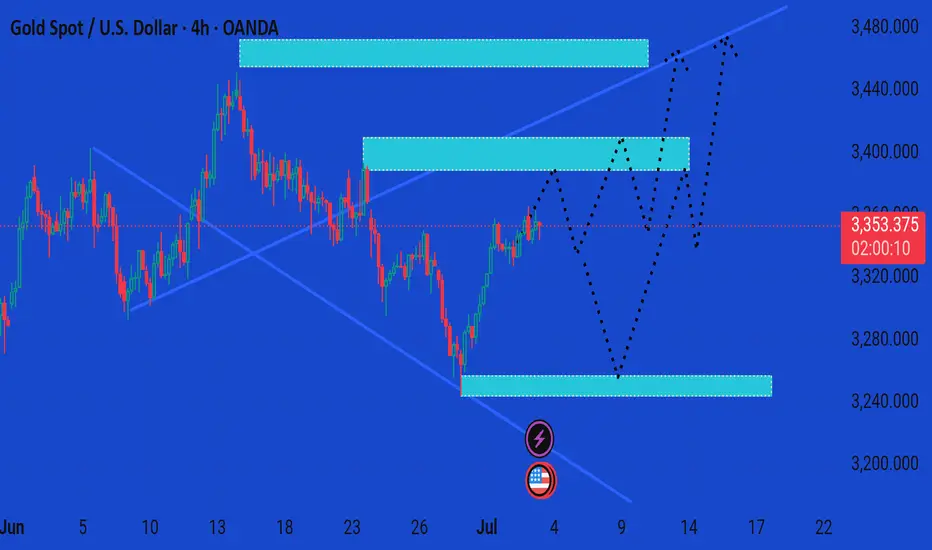
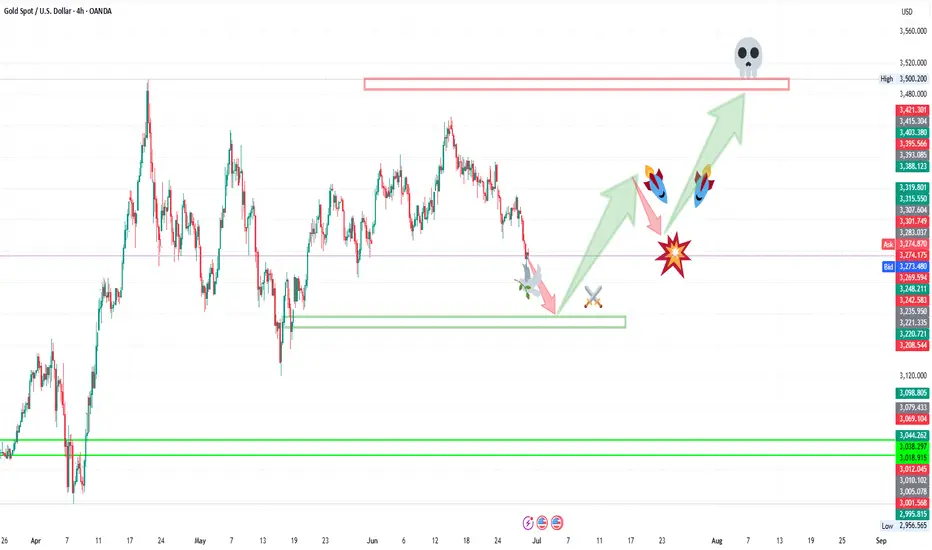
Xauusd market update This chart presents a 4-hour analysis of Gold Spot (XAU/USD) against the US Dollar, showing potential bullish scenarios based on price zones and market reactions.
Key Insights:
Current Price:
$3,353.31, slightly down 0.11%.
---
Highlighted Zones:
1. Resistance Zone (~$3,420–$3,455):
Price reacted here previously.
Marked as a potential final target for bullish momentum.
2. Mid Supply/Resistance Zone (~$3,370–$3,405):
Critical decision area.
Price might face consolidation or rejection.
3. Demand Zone (~$3,240–$3,270):
Previously respected support.
Ideal area for a bullish reversal if price dips.
---
Projected Price Paths (Black Dotted Lines):
Scenario A (Immediate Bullish):
Price consolidates above $3,350.
Breaks into the mid-zone, then pushes to $3,450 resistance.
Scenario B (Pullback Then Rally):
Declines to the $3,250 demand zone.
Rebounds strongly, breaks mid-zone, and heads for $3,450.
Scenario C (Range-bound):
Multiple bounces between $3,250 and $3,405 before a decisive breakout.
---
Conclusion:
The chart suggests a bullish bias as long as price holds above the $3,250 support zone. Breakout confirmation above $3,405 could pave the way toward $3,450+. However, a drop below the demand zone would invalidate the bullish outlook short-term.
Would you like a trading plan based on these scenarios?
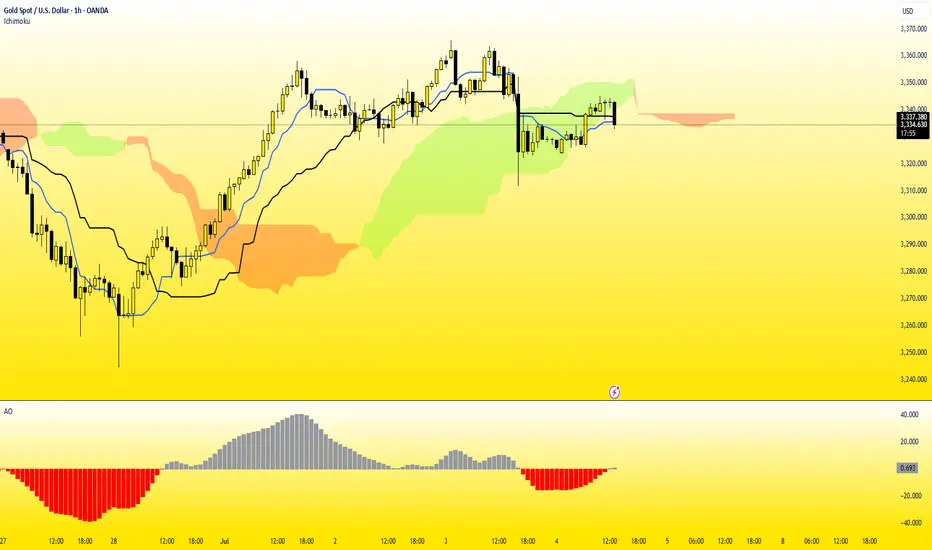
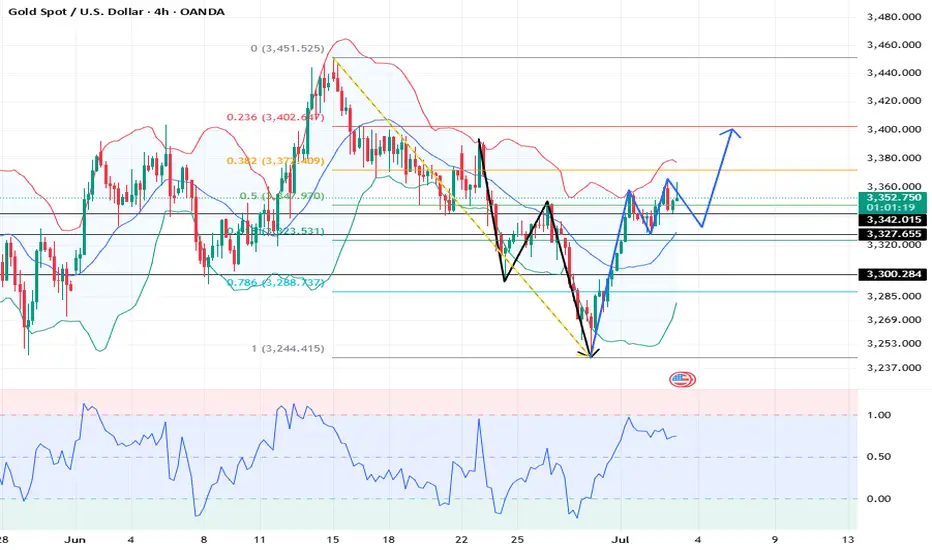
XAUUSD: Market analysis and strategy on July 3Gold technical analysis
Daily chart resistance level 3400, support level 3300
4-hour chart resistance level 3382, support level 3327
1-hour chart resistance level 3364, support level 3341
After bottoming out, the lowest point of yesterday's correction, 3327, has become an important support. Today's gold is still a strategy of buying at a low level. This idea can be maintained before the release of NFP employment data. Tomorrow, the US Independence Day will be closed for one day. The NFP data will be released in advance today, and the trading market will be closed in advance.
Judging from the current market trend, today it broke through the previous high of 3357. Today's Asian session slightly rose to 3365 and then quickly fell back to 3341. The low point of the Asian session retracement of 3341 is a small support. The second is the low point of 3333 in the US session yesterday. The support point of 3333/41 can be bought when the European session falls back. The possibility of a unilateral rise in the high point of today before the NFP data is small. I expect it to fluctuate and wait patiently for a pullback to buy. Today's NY market risk is relatively high. Please try to avoid trading during news time!
Buy: 3341near
Buy: 3333near
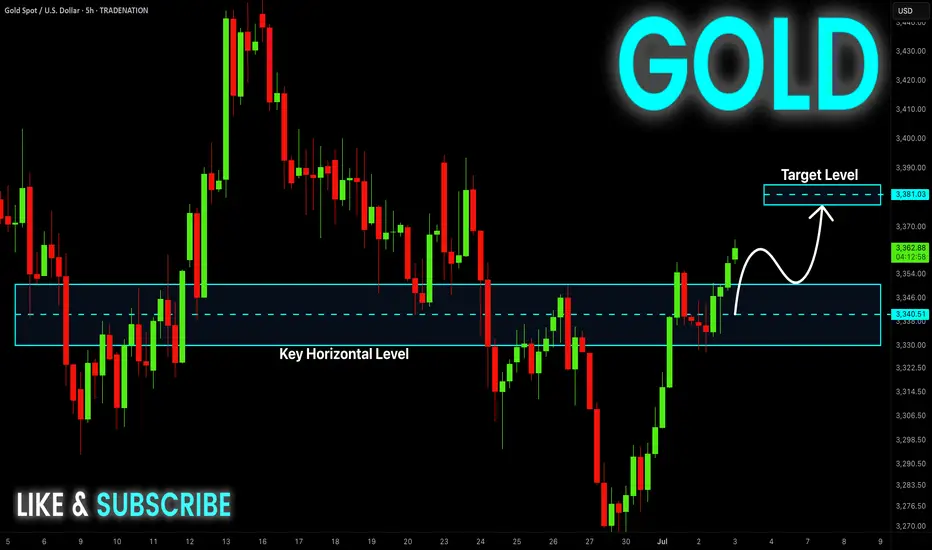
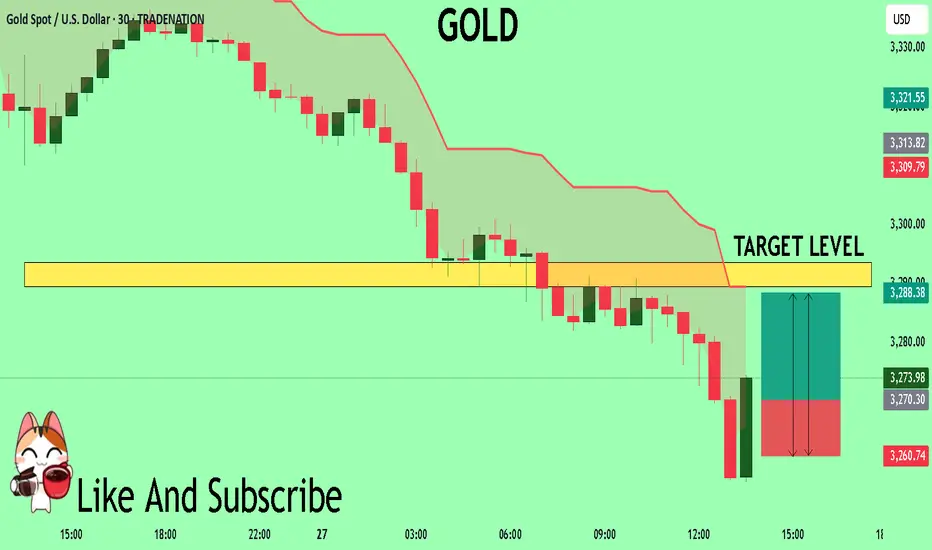
GOLD Bullish Breakout! Buy!
Hello,Traders!
GOLD is going up now
And the price broke the
Key horizontal level
Around 3,346$ and
The breakout is confimred
So we are bullish biased
And we will be expecting
A further bullish move up
Buy!
Comment and subscribe to help us grow!
Check out other forecasts below too!
Disclosure: I am part of Trade Nation's Influencer program and receive a monthly fee for using their TradingView charts in my analysis.
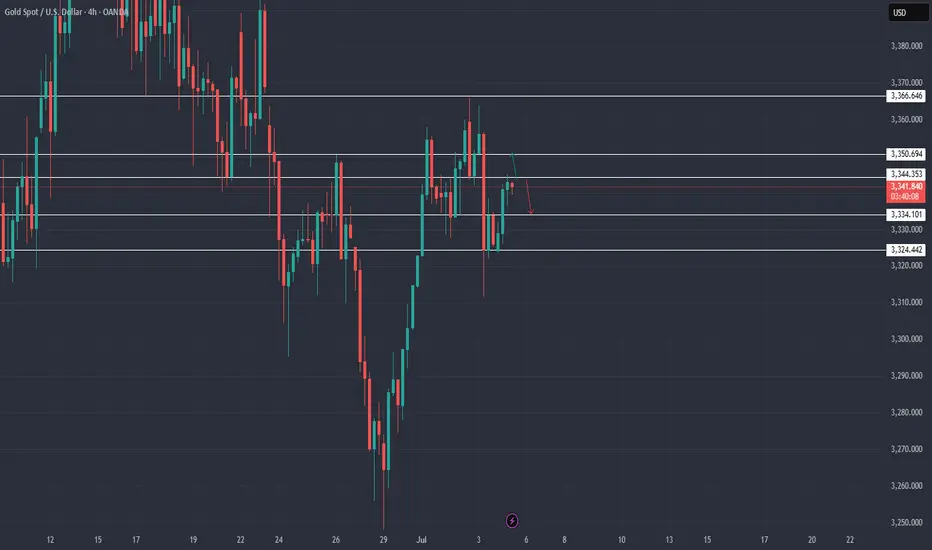
GOLD LONG TERMGold made a good push from 3250 and back up over 1000 pips.
Additionally, a break above 3340 failed, making a lower low below, opening up opportunity for further drops.
Also a perfect equal lows at 3250. Let's see if price sets up retracement sells from 3360-70 zone.
XAUUSD - Breakdown: - RISK ON/Gold Pullback to Continue ?✅ All 3 pullback zones tagged:
1️⃣ 3295
2️⃣ 3301
3️⃣ 3310
Next:
🔁 If price sustains above 3300, next key sell zone = 3320
🔼 Hold above that? Likely move into 3340s
Still eyeing 3319–3340 Fib zone for next play
#XAUUSD #Gold #Trump #DXY #Optimism #GoldLevels #Commodities
July 1, 2025 - XAUUSD GOLD Analysis and Potential OpportunityAnalysis:
The monthly close suggests a reduction in bullish momentum, raising the possibility of stronger bearish pressure ahead.
However, yesterday’s daily close above 3300 indicates bulls still have some control.
Watch 3312 carefully — if price breaks above it, it will confirm a shift towards a stronger bullish trend.
Summary:
Above 3300, the strategy is buying on pullbacks to support.
Below 3300, the plan is selling on pullbacks to resistance.
If price breaks below 3275, bearish strength could accelerate, and future longs will need clearer confirmation.
🔍 Key Levels to Watch:
• 3350 – Bullish target
• 3338 – Resistance
• 3325 – Key resistance
• 3310–3312 – Intraday key resistance zone
• 3300 – Psychological level
• 3283 – Key support
• 3275 – Intraday key support
• 3263 – Support
📈 Intraday Strategy:
• SELL if price breaks below 3298 → target 3292, then 3288, 3283, 3275
• BUY if price holds above 3312 → target 3318, then 3325, 3333, 3340
👉 If you want to know how I time entries and set stop-losses, hit the like button so I know there’s interest — I may publish a detailed post by the weekend if support continues!
Disclaimer: This is my personal opinion, not financial advice. Always trade with caution and manage your risk.
As long as chaos reigns in the Middle East, buy gold!As long as this Middle East ceasefire nonsense holds, gold prices are gonna keep slumping. But, oh, there’s this cursed support at $3,200 that’ll probably shove prices back up like an annoying boomerang. If tensions flare up, gold’s gonna soar even higher. And if it blasts past $3,500, well, I’m outta here—bidding you farewell. May your soul rest in peace and your memory be a treasure.
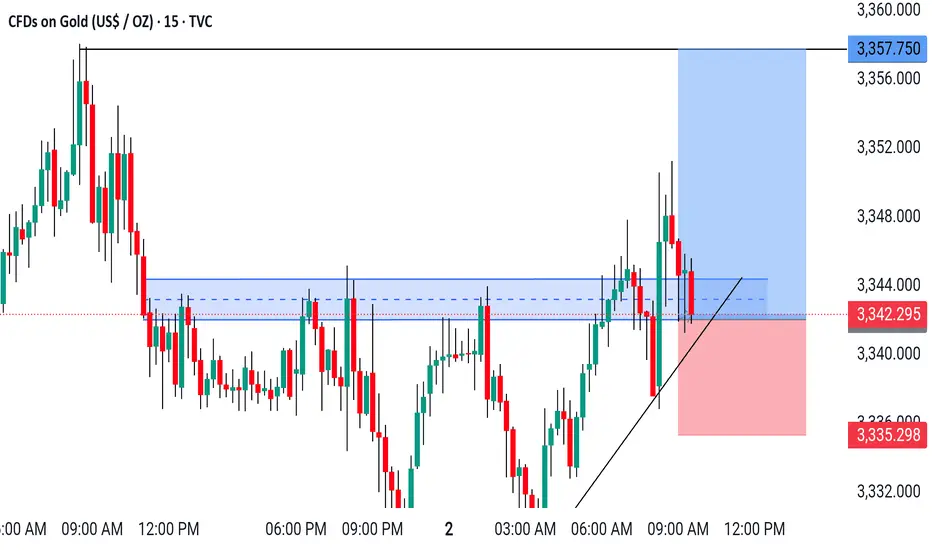
XAUUSD /GOLD M15 Chart Gold buy 🚀💯
* Entry: ~3342 📊
* Take Profit: ~3348
* Take Profit: ~3357
* Stop Loss: ~3335
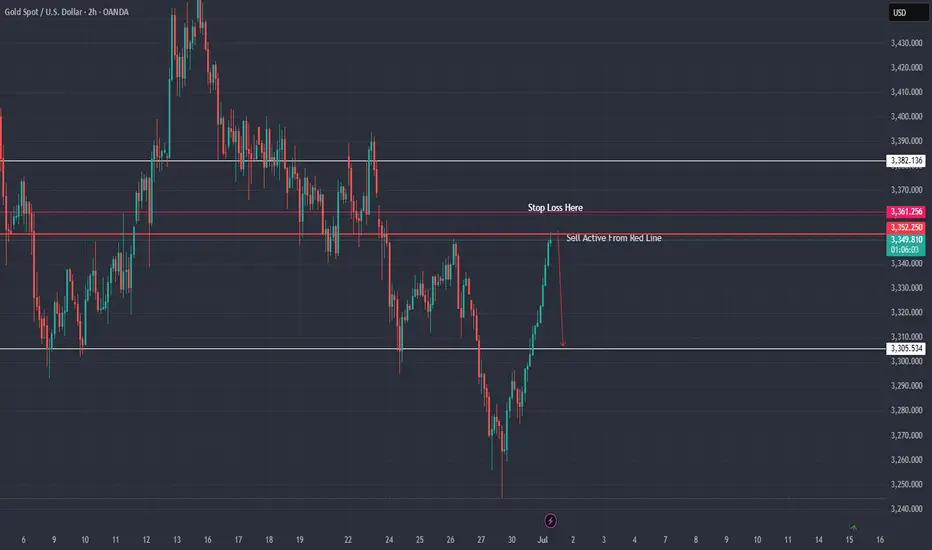
XAU / USD 2 Hour Chart Hello traders. I decided to take a small Sell position marked by the red line on the chart. My stop loss is also set. I am using a micro lot size so nothing crazy in case is does not go my way. Let's see if the NY open corrects the overnight's move up. Big G gets a shout out. Be well and thanks for checking out my trade.
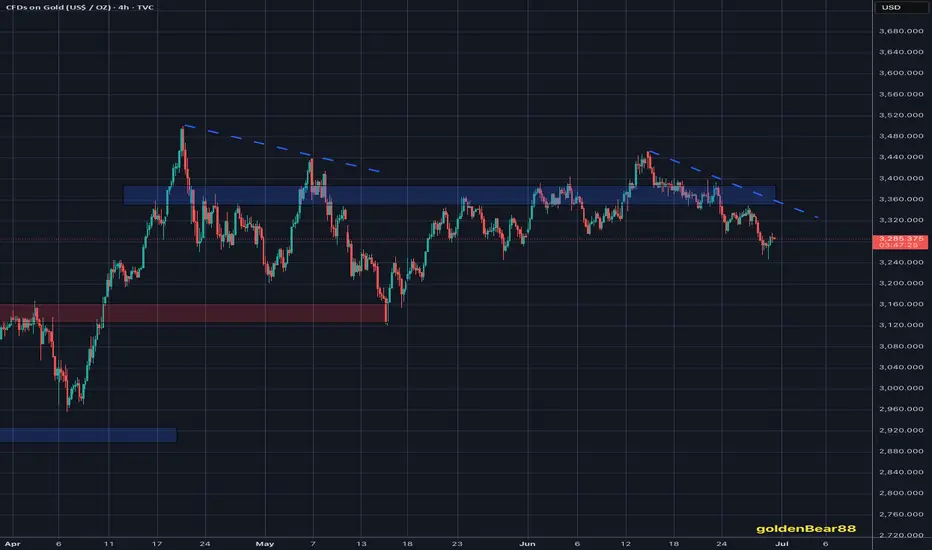
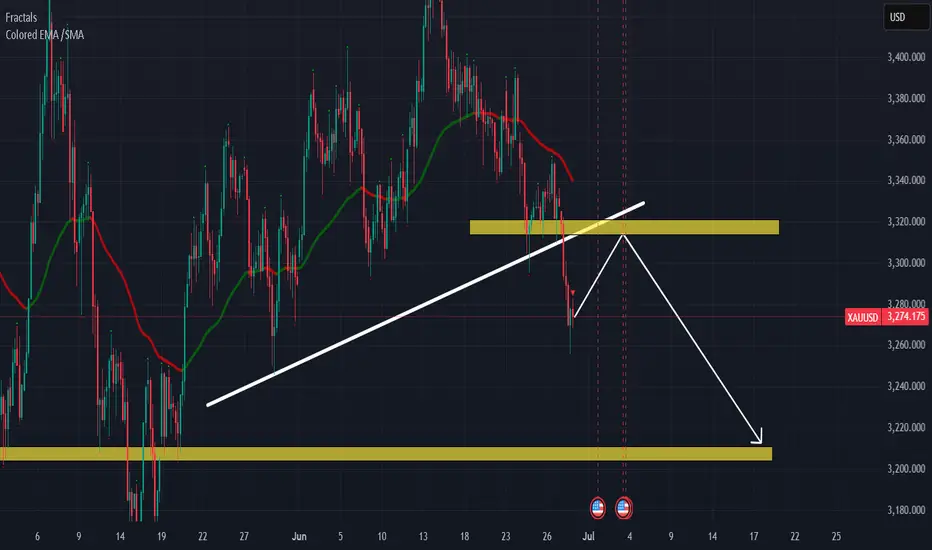
XAUUSD / Technical AnalysisThe overall trend for gold is bearish, in the coming week it seems that gold has the potential to return to the price range of 3310-3320 and continue its downward trend again.
Anyway, the target for gold after the correction will be the $3200 range.
I recommend that you do not forget risk management when entering any trade.
Thanks to @forex_onliner
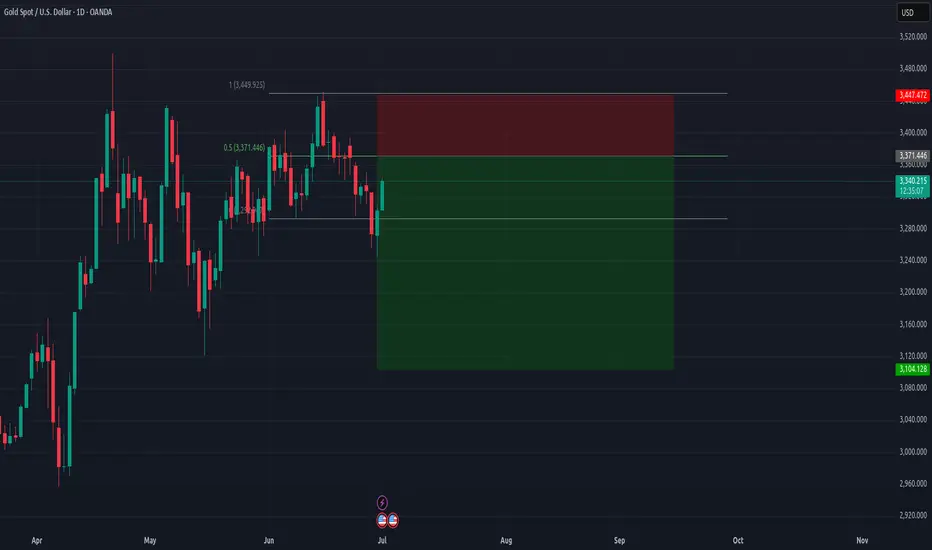
XAU/USD (Gold) Breakout or Breakdown Setup – Key Decision ZoneThe Gold Spot (XAU/USD) price action is currently at a crucial inflection point after consolidating in a rising wedge pattern between ascending support and horizontal resistance. This type of structure typically indicates a strong directional breakout is likely, and the current daily candle shows a close below the ascending support, signaling a potential bearish breakdown confirmation.
🔽 Bearish Breakdown Scenario (Confirmed Below 3250)
If price sustains below the 3250 support breakdown level, it confirms a bearish breakdown from the wedge. The height of the wedge (distance between the base of the move and the resistance) is used to project the downside target, giving us key levels to monitor:
Breakdown Confirmation: Below 3250.00
Target 1: 3111.67
Target 2: 2990.31
Projected Downside Target: 2861.24
This move suggests that gold could enter a deeper correction if buyers fail to reclaim the ascending structure quickly.
🔼 Bullish Breakout Scenario (Above 3500)
On the flip side, if bulls manage to push price back above the 3500 level, it would invalidate the current bearish momentum and confirm a bullish breakout. The projected upside targets are based on the same measured move logic:
Breakout Confirmation: Above 3500.00
Target 1: 3621.90
Target 2: 3741.84
Projected Upside Target: 3855.78
A close above 3500 with volume would set the tone for a fresh rally toward new highs.
🧭 Strategy Outlook
Short Bias (active): Entry below 3250; SL above 3300; TP at 3110 / 2990 / 2860
Long Bias (if reversal): Entry above 3500; SL below 3460; TP at 3620 / 3740 / 3850
Always wait for a strong daily candle close beyond the breakout/breakdown levels before initiating any trades
=================================================================
Disclosure: I am part of Trade Nation's Influencer program and receive a monthly fee for using their TradingView charts in my analysis.
=================================================================

GOLD Trading Opportunity! BUY!
My dear subscribers,
GOLD looks like it will make a good move, and here are the details:
The market is trading on 3270.6 pivot level.
Bias - Bullish
My Stop Loss - 3260.7
Technical Indicators: Both Super Trend & Pivot HL indicate a highly probable Bullish continuation.
Target - 3289.4
About Used Indicators:
The average true range (ATR) plays an important role in 'Supertrend' as the indicator uses ATR to calculate its value. The ATR indicator signals the degree of price volatility.
Disclosure: I am part of Trade Nation's Influencer program and receive a monthly fee for using their TradingView charts in my analysis.
———————————
WISH YOU ALL LUCK
XAU / USD 4 Hour ChartHello traders. Taking a look at the 4 hour chart, I have marked the potential scalp sell / buy trade set ups. Lower time frame confirmation is a must. I am not trading today as the NY market is closed. I am not trying to do any range trading. Be well and have a great weekend. Today is a holiday here in the USA. We are celebrating breaking away from England, which we see today is George Orwell's 1984. Shout out for freedom and to Big G. Be well and trade the trend.
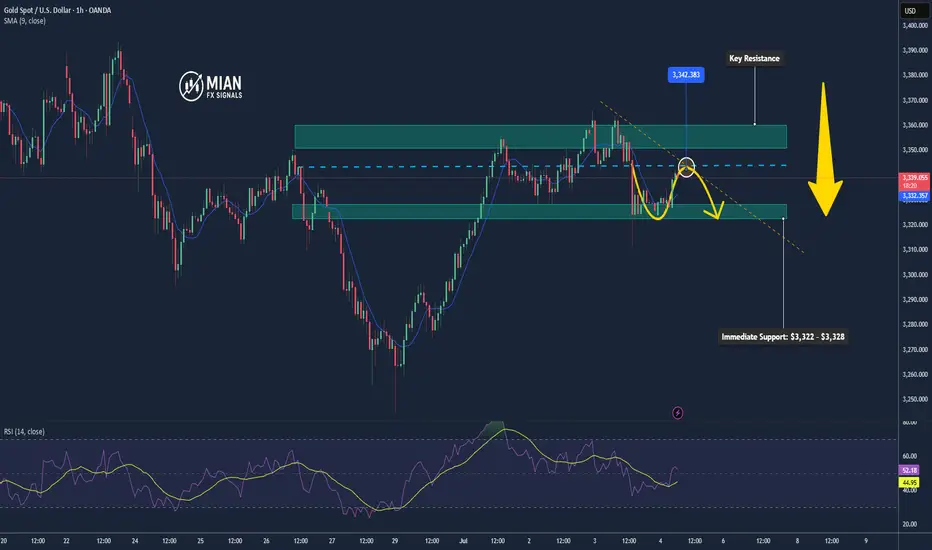
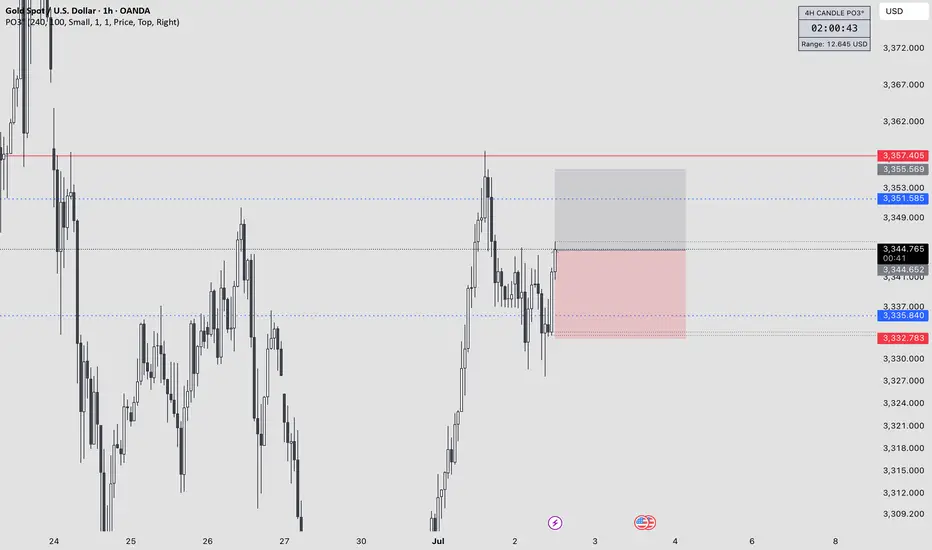
Gold Pulls Back After Strong US NFP Data📊 Market Overview:
U.S. June Non-Farm Payrolls came in at 147,000 vs. 110,000 expected, strengthening the dollar and reducing expectations for a July Fed rate cut. As a result, gold dropped nearly 1%, trading in the $3,328–3,332 zone
📉 Technical Analysis:
• Key Resistance: $3,350 – $3,360
• Immediate Support: $3,322 – $3,328
• EMA: Price has fallen below the 09 EMA, indicating a bearish short-term trend.
• Candle/Volume/Momentum: A strong bearish candle with increased volume shows significant selling pressure post-NFP
📌 Outlook:
Gold may continue its downtrend in the short term if the dollar remains strong and no fresh bullish triggers emerge. A drop toward $3,322–$3,328 is possible.
💡 Trade Ideas:
🔻 SELL XAU/USD at: $3,342 – $3,345
🎯 TP: $3,322
❌ SL: $3,348
🔺 BUY XAU/USD at: $3,322 – $3,325
🎯 TP: $3,345
❌ SL: $3,316