XAUUSD 01.07.2025-Formation of the market:
On the background of general cooling of geopolitical situation gold continues its fall to the levels of 3250. The main preference of market participants is now given to less "conservative" assets, which is clearly reflected in the record values of cryptocurrency and stock market.
-Forecast:
In the medium term, capital outflows are likely to continue and the asset will again test the 3250 level as support.
-News Background:
There will be many "strong" news releases this week that could be a strong driver of movement for the asset:
Today:
-ISM Manufacturing PMI and JOLTS Job openings.
Thursday:
Unemployment rate, and Non-Farm Payrolls.
XAUUSD.F trade ideas
Gold Trendline Breakout: Momentum Building or Fakeout Risk?Gold has just snapped a key trendline that’s been holding price in check. This breakout could signal a shift in market structure and possibly open the door for a bullish continuation. I'm eyeing confirmation above the breakout zone with volume expansion to validate the move. Short-term targets are aligned with previous resistance levels, while support has shifted upward.
Happy Trading :)
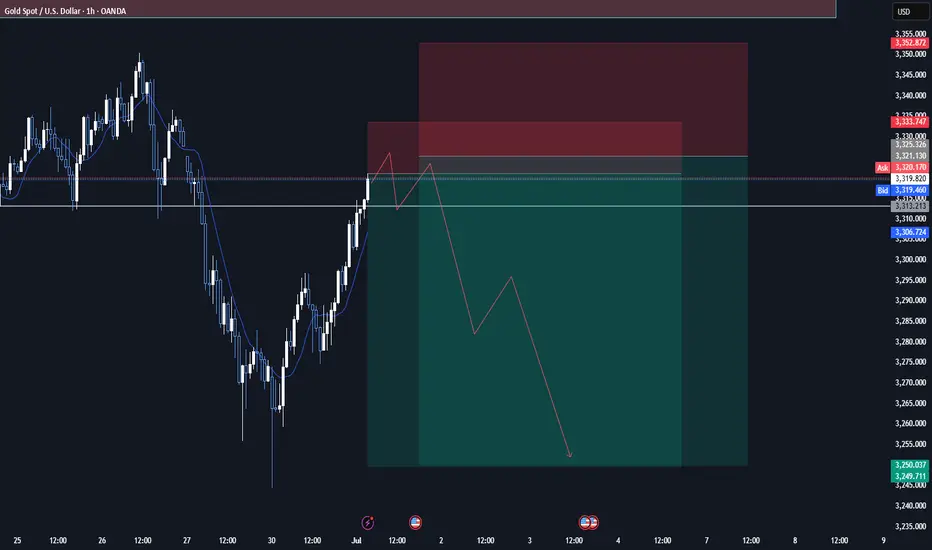
GOLD - SELL TO $3,288 (1H VIEW)Still looking for a move lower into the $2,787 - $3,276 zone, to take out the June low, like I mentioned to you all a few days ago.
Tomorrow is Friday so be careful as price action could be choppy & use strict risk management.
⭕️Imbalance Left Below $3,300 Psychological Number.
⭕️Either Wave 2 or Wave C Not Complete of Major Impulse Move Down.
⭕️Sellers Holding Below Resistance Zone.
TP: $3,288
Gold Intraday Trading Plan 7/4/2025Yesterday Gold did move up from 3350 to 3365 local high and quickly dropped under 3330. But I see this drop as correction not trend reverse. Right now it has entered a consolidation zone.
Therefore, I am looking to buy from 3300 and sell from 3330. Will trade between these two levels.
XAUUSD/ GOLD M45 OUTLOOK XAUUSD 45M 🚀
Trendline broken — bulls in control!
Above 3317, aiming for 3349+
SL: 3296 🔒 | TP: 3349 🎯
Stay sharp, lock profits! ⚡️✨
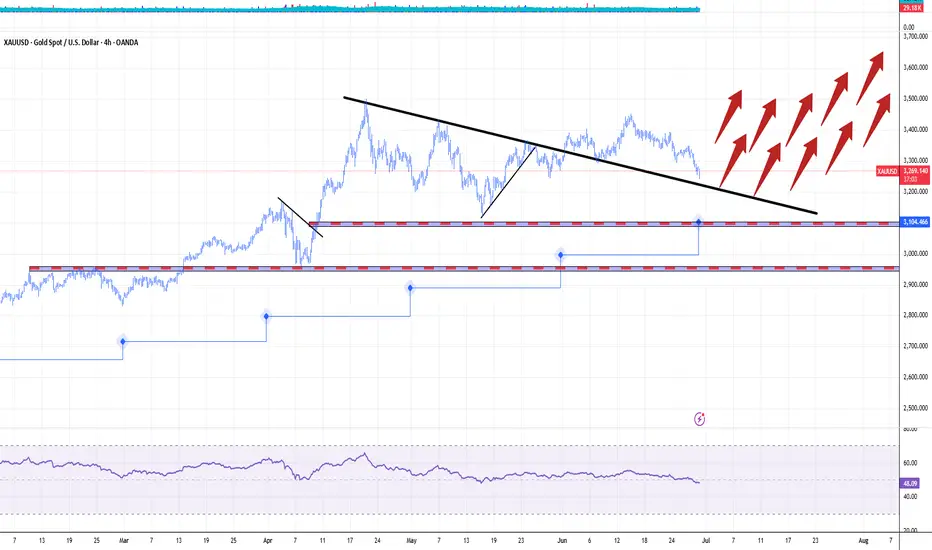
GOLD GOES 'PREPARING FOR SCORCHING-HOT JULY'. UPSHOT OF 1H 2025Gold market shines bright in first half of 2025, with nearly 25 percent year-to-date gain, which becomes one of the best start of the year in history ever following 1H 2016 (became a launching pad for Gold to more than Triple in price over next decade) and 1H 1973 (where Gold bugs sharply skyrocketed to infinity and beyond, printed more than 10x over next decade).
The gold spot market in July 2025 is shaped by both fundamental and technical factors supporting a cautiously bullish outlook.
Fundamental perspectives
Were you ready or not, Gold prices have surged significantly in 2025, driven by persistent global uncertainties including geopolitical conflicts (e.g., Middle East tensions), trade disputes, and inflation concerns.
Central banks, notably the Federal Reserve, are expected to cut interest rates later in 2025, reducing the opportunity cost of holding gold, a non-yielding asset. This monetary easing alongside continued inflation worries and safe-haven demand underpins strong gold fundamentals.
Major financial institutions like J.P. Morgan and UBS forecast gold prices averaging around $3,500–$3,675 per ounce in late 2025, with potential to reach $4,000/oz by mid-2026.
Central bank gold purchases and diversification away from US dollar assets also support demand.
Technical perspectives
Technically, gold has experienced volatile but mostly sideways trading in a roughly $300 range around $3,200–$3,500 since mid-2025, reflecting consolidation after a strong rally earlier in the year.
Key support lies near $3,000 and $3,200 levels (125-Day, or 6-Month SMA), with resistance around $3,500 to $3,800. Indicators such as moving averages and RSI suggest an upward trend with possible short-term corrections.
A breakout above $3,500 could trigger further gains toward $3,800, while a drop below $3,200 may lead to testing $3,000 support.
Overall, July is expected to see continued range-bound trading amid new external uncertainties, with bullish momentum intact.
In summary, gold’s fundamentals remain robust due to macroeconomic and geopolitical drivers, while technicals point to consolidation with potential for renewed upward moves in the July 2025 spot market.
--
Best #GODL wishes,
@PandorraResearch Team 😎
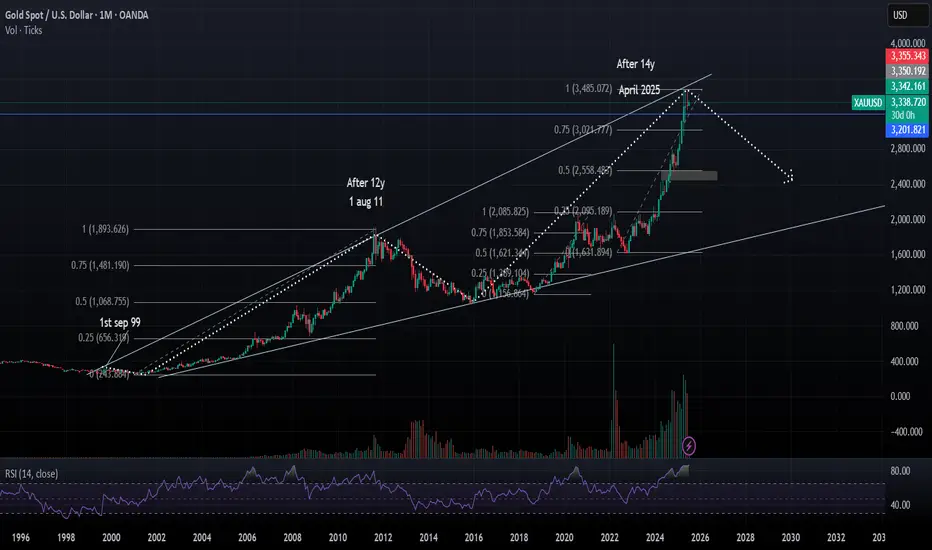
Major Reversal Ahead?14-Years Cycle complete in April2025Description:
Gold (XAUUSD) has completed a significant 14-year cycle with the recent peak near $3,485 in April 2025, following a similar 12-year rally pattern that previously ended in August 2011.
The price is now showing signs of exhaustion:
RSI on the monthly chart is extremely overbought (85.91), matching historical reversal levels.
Strong Fibonacci confluence at 1.0 extension ($3,485) suggests a possible cycle top.
Historical symmetry: Prior major top in 2011 came 12 years after the breakout in 1999 — this move mirrors that with a 14-year cycle.
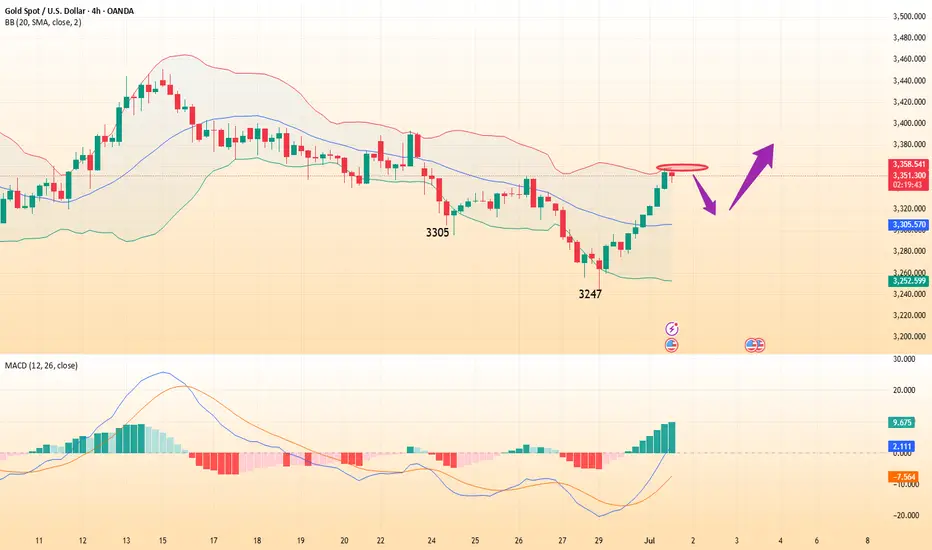
International gold prices rise slowly and reach new highsAnalysis of gold trend:
Gold fell sharply near 3247 at the opening of Monday, then stopped falling and began to fluctuate and rise slowly. It rose to a high of 3297 before the European session, then fell back after being blocked. After dropping to 3274, it stabilized again and began to rise slowly. The US session continued to rise. Another key point in the market that everyone needs to pay attention to is that the US dollar index has now hit a new low, and the current price is 96.3. This wave of US dollar decline is extremely weak, and there is basically no sign of rebound. According to this trend, the US dollar index may continue to fall, and it is possible to go to 88. In the case of such a weak US dollar index, it is natural for gold to be supported by the market. Moreover, gold has not yet walked out of the bullish trend. Gold has turned from weakness in the early stage to strength. Next, it depends on the strength of the rise. This wave of rise is expected to see 3350-3400.
From a technical point of view, gold closed positive at a low level on Monday, and the K line was above the lower Bollinger track, turning from weak to strong. Under the bullish trend, the rise can be seen to be continuous, so the high points of the middle and upper Bollinger tracks can be seen above. In the 4-hour chart, the K-line stands firmly above the middle rail of Bollinger, and the moving average system diverges upward, showing a very obvious strong performance. Therefore, the basic idea this week is to continue to do more on the decline. In the short term, first look at the upper rail of Bollinger in the 4-hour chart at 3350. There are two points to pay attention to in the decline of the small cycle within the day, one is 3300, and the other is 3285 support. Although bullish, do not chase high. After the decline, make sure to stop the decline and continue to be bullish. Operation strategy: Go long when gold falls back to around 3320, stop loss at 3210, and target 3330-3340.
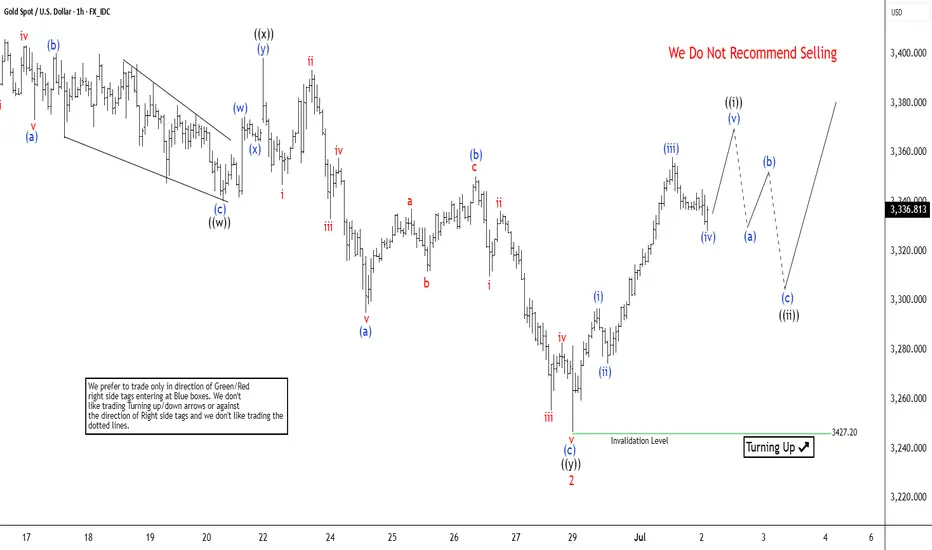
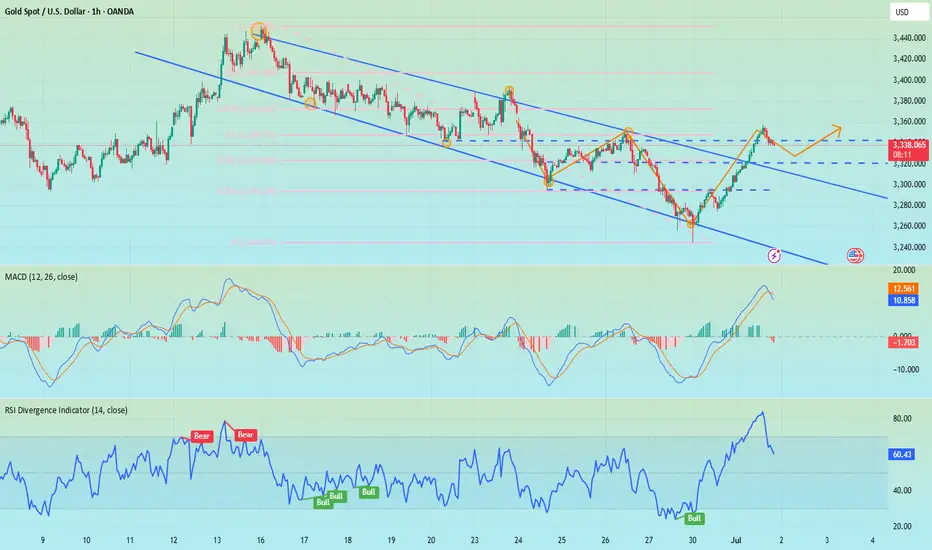
Gold (XAUUSD) Signals Bullish Trend ResumptionGold (XAUUSD) has exhibited a robust rally since its low on May 15, 2025. The metal formed a five-swing motive sequence that culminated in wave 1 at 3452.50 on June 16, 2025. This five-swing structure, characteristic of an impulsive Elliott Wave pattern, signals potential for further upside. The subsequent pullback in wave 2 appears to have completed at 3246.15, as illustrated in the accompanying 1-hour chart. The internal structure of wave 2 unfolded as a double-three Elliott Wave corrective pattern. Specifically, from the wave 1 peak, wave ((w)) declined to 3340.18. A corrective rally in wave ((x)) followed to 3398.35. The final leg, wave ((y)), concluded at 3246.15, marking the completion of wave 2 in the higher-degree structure.
Gold has since resumed its upward trajectory in wave 3. However, to confirm the bullish outlook and eliminate the possibility of a double correction, the price must decisively break above the wave 1 high at 3452.50. From the wave 2 low, wave (i) advanced to 3296.85. A shallow pullback in wave (ii) followed to 3274.41. Wave (iii) then propelled the metal to 3358.02. Based on the current structure, gold is expected to rally further in wave (v) to complete wave ((i)). Subsequently, a corrective pullback in wave ((ii)), likely unfolding in a 3, 7, or 11-swing structure, is anticipated from the June 30 low before the metal resumes its upward trend. In the near term, as long as the pivot low at 3246.15 remains intact, gold is poised to extend higher, supported by the impulsive momentum of the ongoing wave 3.
Gold Prices Retreat, Short-term Bearish Trend PrevailsOn Friday, gold prices rebounded to $3,328 at the start of Asian trading but were resisted, followed by a sustained decline. Influenced by the U.S. May PCE price index data during the U.S. session, prices hit a low of $3,255 and closed at around $3,274, forming a large bearish candlestick with a long lower shadow on the daily chart.
Influencing Factors: Optimistic expectations on trade agreements boosted market risk appetite, weakening gold's safe-haven appeal.
Technical Analysis:
- Daily chart: Gold has broken below the 5-day moving average, with short-term moving averages in a bearish arrangement.
- 4-hour chart: The Bollinger Bands have widened, and prices are trending lower along the lower band. The key resistance level at $3,310 is critical—failure to reclaim this level may intensify short-term selling pressure.
Outlook for Next Week: Events such as the global central bank governors' meeting, non-farm payroll data release, and discussions on Powell's potential resignation will disrupt the market. Gold is expected to fluctuate sharply around $3,270, with caution advised for a secondary bottoming.
Comprehensive Judgment: The bearish probability is high:
- Upper Resistance: Focus on the $3,310–$3,300 range, a key bull-bear dividing line. A breakthrough here could reverse the trend.
- Lower Support: Watch the $3,250 level—breaking below it may open further downside.
Indicator Signals:
- MACD: Bearish crossover below the zero line with expanding green bars, indicating accelerating downward momentum.
- RSI: At 39 in the oversold zone, showing potential for a short-term bottom, but bearish momentum remains dominant.
XAUUSD
sell@3290~3280
sl:3310
tp:3260~3250
I am committed to sharing trading signals every day. Among them, real-time signals will be flexibly pushed according to market dynamics. All the signals sent out last week accurately matched the market trends, helping numerous traders achieve substantial profits. Regardless of your previous investment performance, I believe that with the support of my professional strategies and timely signals, I will surely be able to assist you in breaking through investment bottlenecks and achieving new breakthroughs in the trading field.
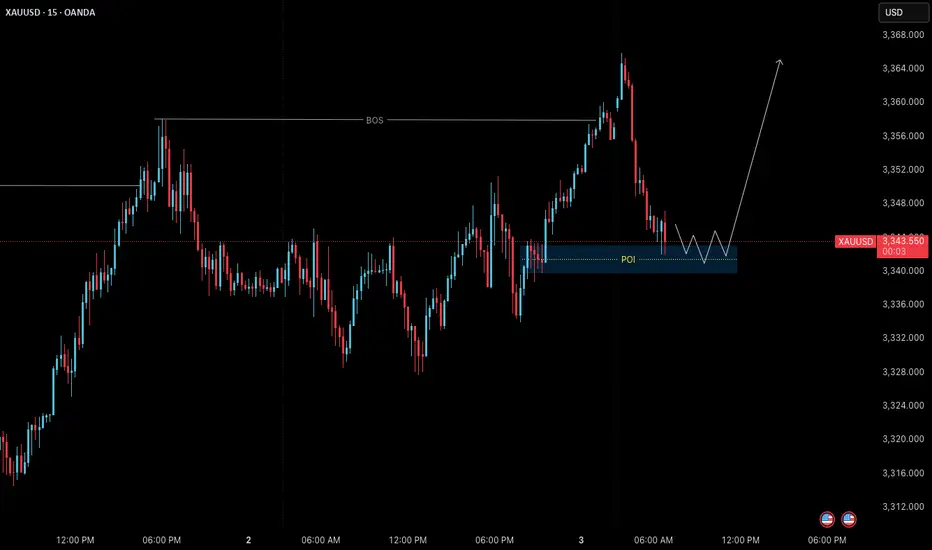
XAUUSD – July 3 Live Setup | Price at M15 POIGold has been moving in line with our bullish bias over the past few sessions.
Yesterday’s break above the 3358 M15 level gave us a clean Break of Structure (BoS) — confirming short-term bullish momentum within the larger framework.
After this strong push upward, the market is now retracing.
Price is currently entering a high-probability pullback zone: 3340–3342 (M15 POI).
This is a textbook base structure setup — where we wait for price to return to a valid zone after structure shift, and only act after confirmation on the lower timeframe.
🔍 Setup in Play:
Current Bias:
• M15 Trend: Bullish
• H4 Context: Bullish (after recent HTF shift)
• Market State: Pullback phase after BoS
Key Zone in Focus:
• 3340–3342 – M15 POI (zone of interest for continuation)
We are not entering blindly .
We are waiting for confirmation on M1 — specifically:
✅ ChoCh (Change of Character)
✅ Followed by a micro BoS
Only then do we consider a long entry — and even then, risk must be managed through proper R:R and structure anchoring.
🎯 Target:
If M1 confirmation occurs, the expected short-term target is 3365 — the next clean M15 structural high.
⚠️ Risk Conditions:
If price breaks below the POI without M1 confirmation — or aggressively violates the zone — the setup is invalid.
In that case, we simply step aside and reassess.
This is process-driven execution:
No need to predict.
No need to chase.
Just observe, confirm, and execute with structure.
📖 This is how we let the chart do the work.
The process protects us.
Structure invites us.
Stillness refines us.
📘 Shared by @ChartIsMirror
Author of The Chart Is The Mirror — a structure-first, mindset-grounded book for traders
Gold retreats as expected, how to trade in the future📰 News information:
1. Geopolitical situation
2. PMI data
3. Global Central Bank Governors Meeting
📈 Technical Analysis:
Our short orders have achieved profits. I closed the position near 3337, turning losses into profits. Interested friends can follow my previous post. In the short term, I am still optimistic that gold will retreat below 3335-3325. Today, gold rose sharply, and the rebound momentum was strong, while the short-term correction was slightly weak, so the space for a second decline in the short term will be limited. If it falls to the 3333-3323 range during the day and gets effective support, you can consider going long. The short-term upper resistance is 3360-3375.
🎯 Trading Points:
BUY 3333-3323-3315
TP 3341-3355-3360-3375
In addition to investment, life also includes poetry, distant places, and Allen. Facing the market is actually facing yourself, correcting your shortcomings, confronting your mistakes, and strictly disciplining yourself. I hope my analysis can help you🌐.
TVC:GOLD OANDA:XAUUSD FX:XAUUSD FOREXCOM:XAUUSD PEPPERSTONE:XAUUSD FXOPEN:XAUUSD
"Gold sell action!"Gold has dropped to the 3330 region but has now reversed and is currently trading at 3350. The next potential move could be at 3380, followed by 3400. Our sell entry is at 3400, where we believe the price will reverse. Our long-term view is that gold will head towards 3100, but our first target will be 3200. Please use accurate risk management when trading gold, as it can cause serious financial issues if not planned properly. This analysis does not guarantee any price movement.
Gold Extends Decline Amid Easing Safe-Haven DemandGold continues its downward trajectory as safe-haven sentiment weakens. Geopolitical tensions between Iran and Israel appear to be easing following a ceasefire agreement, reducing the perceived need for defensive assets such as gold.
At the same time, the market is reassessing its expectations regarding U.S. monetary policy. With the Federal Reserve unlikely to cut interest rates in the near term—and concerns about inflation resurfacing due to potential tax policy changes under former President Donald Trump—gold is facing a dual source of short-term pressure.
Investor sentiment is currently shifting toward riskier assets, as capital flows increasingly favor equities over gold. This risk-on environment has further eroded demand for traditional safe havens.
From a technical perspective, gold failed to break above the $3,350 level, signaling waning bullish momentum. This may indicate the onset of a short-term corrective phase.
On the political front, recent remarks by Donald Trump—including the possibility of a long-term diplomatic solution with Iran and discussions around replacing Fed Chair Jerome Powell—have introduced additional volatility into global financial markets.
Furthermore, according to market data I have reviewed, gold sales in the second quarter have shown signs of slowing. Buyers are becoming more cautious amid elevated price levels, while many investors are choosing to take profits, contributing to an increasingly two-sided market dynamic.
Despite this, I maintain a positive medium- to long-term outlook for gold. The U.S. dollar is currently at its weakest point in three and a half years, offering significant support. Notably, central banks managing over $5 trillion in assets are planning to increase their gold reserves within the next one to two years—a strong structural driver for gold’s long-term growth.
In summary, I believe gold is currently experiencing short-term corrective pressure due to a combination of geopolitical developments, interest rate expectations, and shifting investor sentiment. However, its long-term outlook remains solid, supported by a weaker dollar, global macroeconomic risks, and continued central bank accumulation.
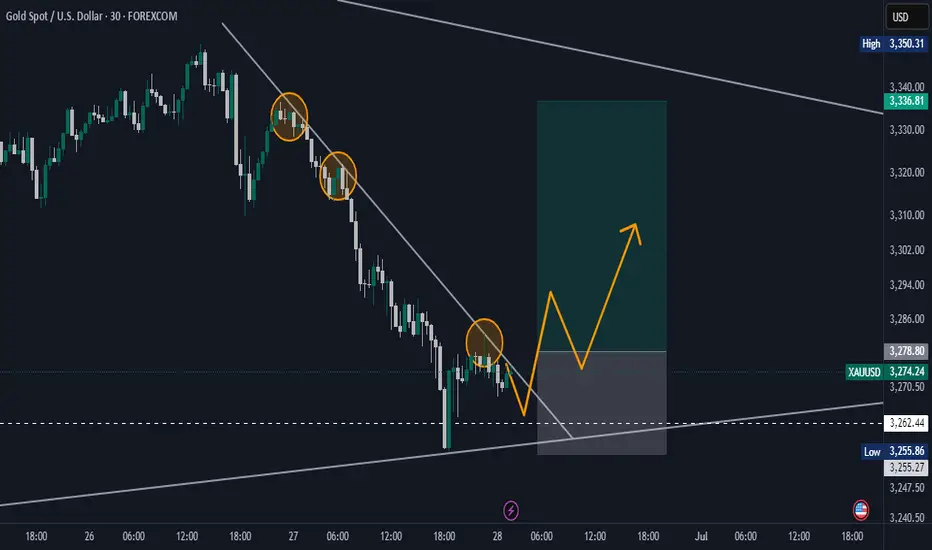
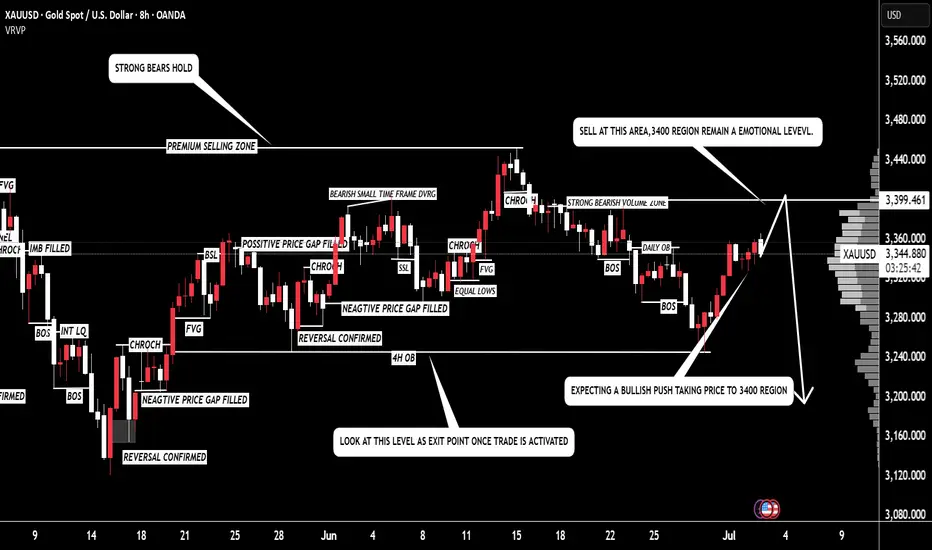
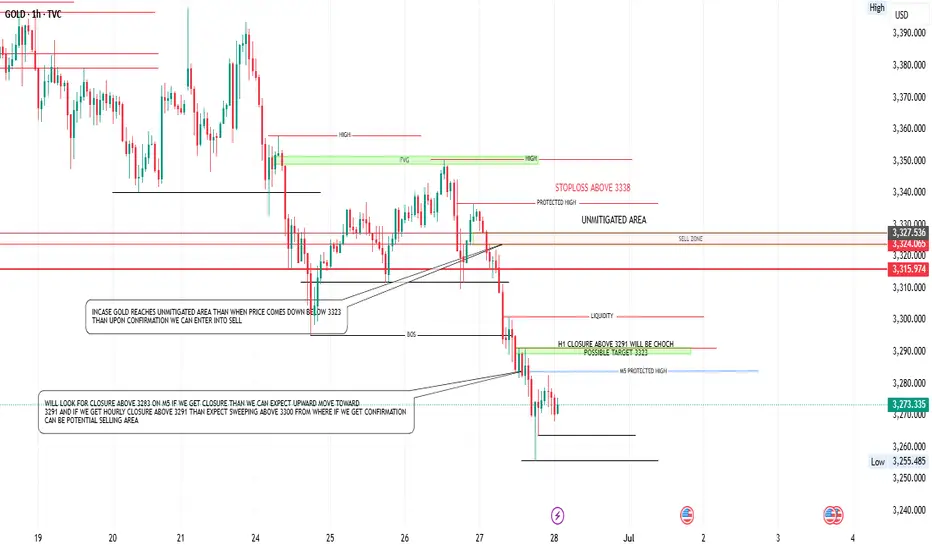
GOLD UPCOMING WEEK ANALYSIS/SET UP On the M5 timeframe, a confirmed candle closure above 3283 would signal a shift toward short-term bullish momentum. In this scenario, the market is likely to attract buyers looking to capitalize on upward continuation. A logical strategy would be to wait for a pullback toward the 3264 or 3278 zone all depending upon price action ie swing lows, It's important to maintain a tight stop loss just below the pullback low, as the expected targets in this bullish leg are first 3291, followed by the psychological level of 3300. These levels may offer minor resistance, and partial profit-taking around them could be considered.
If buying pressure remains strong and the price closes decisively above 3303, this would confirm a continuation of bullish intent. At that point, the market is likely to push toward the unmitigated supply zone marked on the chart. This zone has not been fully tested and may act as a key inflection point where institutional selling could re-enter the market. we should watch price behavior closely in this area, as signs of rejection—such as a bearish engulfing candle or a failure to hold above 3323—would suggest exhaustion of bullish momentum.
If the market fails to hold above 3323 and instead closes below it, this would shift the bias to bearish. Such a rejection would present a high-probability sell opportunity, with the expectation of a move back toward this week’s low. This bearish move would likely be driven by a combination of profit-taking and reactivation of supply from the unmitigated zone, aligning well with smart money principles targeting liquidity beneath recent lows.
Note: Only for educational purpose not a financial advice
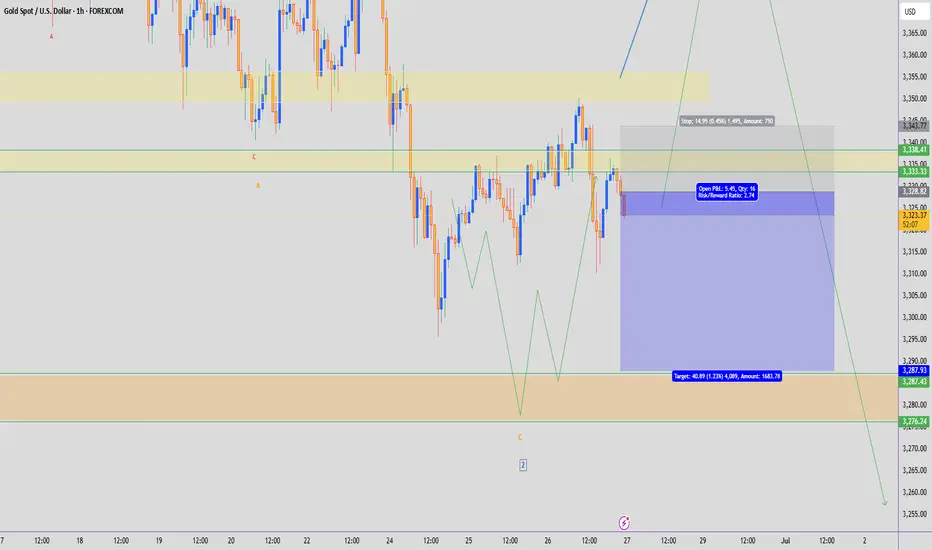
XAUUSD Hello traders. There’s currently a great opportunity for a potential short setup on the XAUUSD pair. We just need a bit of patience. For that reason, this trade will be placed as a Sell Limit.
In the coming days, I expect a moderate pullback in gold. Meanwhile, the S&P 500 has reached a new all-time high, which is quite notable. If the index begins to correct from these levels, we could potentially see a strong rally in gold. Of course, this is just my personal opinion based on current market dynamics.
🔍 Trade Details
✔️ Timeframe: 1-Hour (H1)
✔️ Risk-to-Reward Ratio: 1:3.20
✔️ Trade Direction: Sell Limit
✔️ Entry Price: 3294.70
✔️ Take Profit Targets: 3245.78 / 3207.00 / 3154.00
✔️ Stop Loss: 3315.36
🕒 If momentum weakens or price consolidates in a tight range, I will keep this trade open only until 23:00 (UTC+4). After that, I’ll manually close it—whether in profit or loss—based on how price action evolves.
🔔 Disclaimer: This is not financial advice. I’m simply sharing a trade I’ve taken based on my personal trading system, strictly for educational and illustrative purposes.
📌 Interested in a systematic, data-driven trading approach?
💡 Follow the page and turn on notifications to stay updated on future trade setups and advanced market insights.
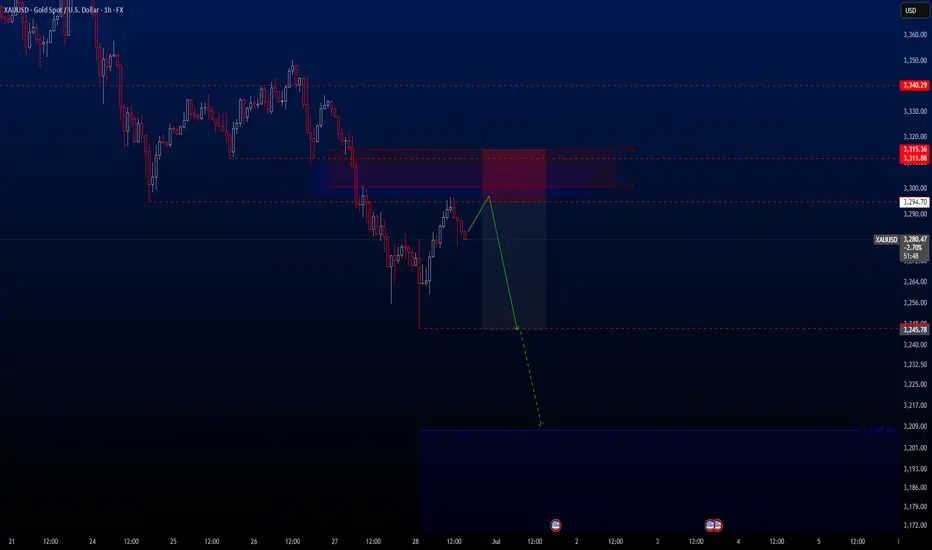
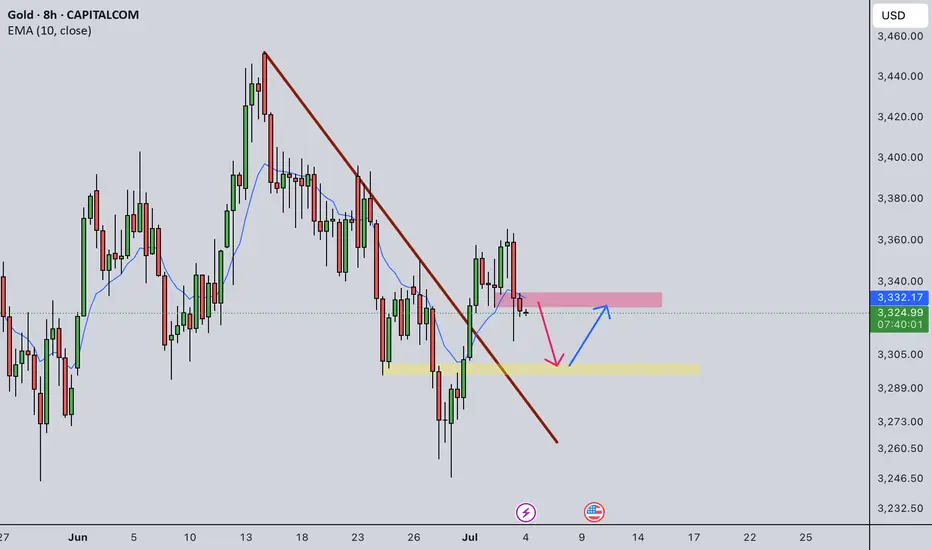
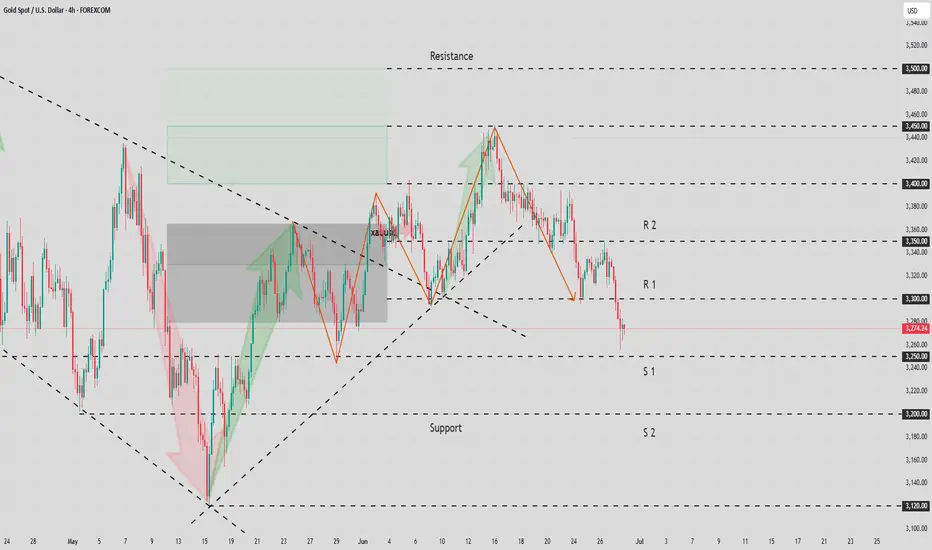
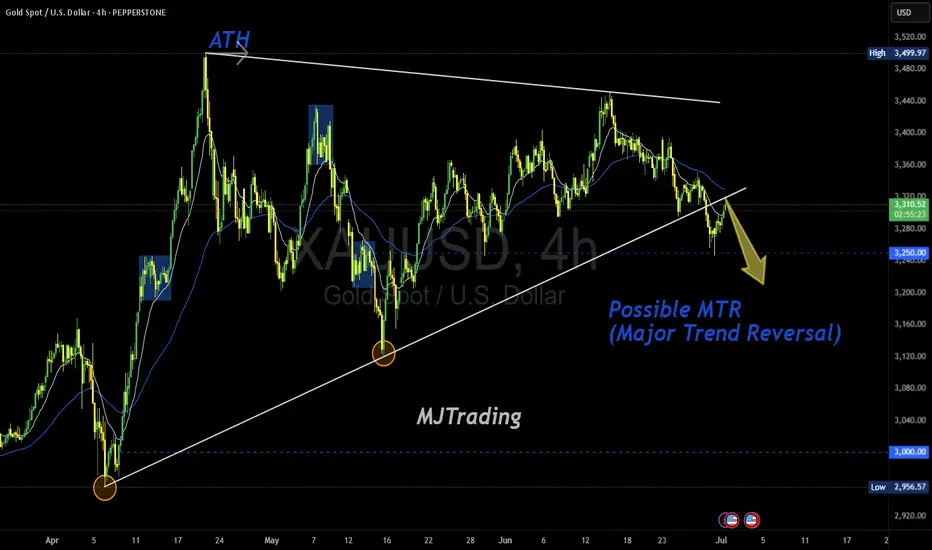
Possible MTR in Play (TBC)Gold has printed a textbook structure for a potential Major Trend Reversal (MTR) off the ATH zone, with a clean rejection and a shift in character. The descending trendline from the top aligns with lower highs, while the ascending base from April is now under pressure.
📌 Key Levels to Watch:
3,280.0 – neckline of the potential MTR
3,250.00 – psychological magnet and structural support
3,000.00 – major downside target if the reversal confirms
🧠 “Markets top on euphoria, not logic.” If price breaks and retests the neckline with momentum, the MTR thesis gains traction. Until then — TBC.
#XAUUSD #Gold #MajorTrendReversal #MTR #PriceAction #TechnicalAnalysis #GoldBears #ATHRejection #TrendShift #MJTrading
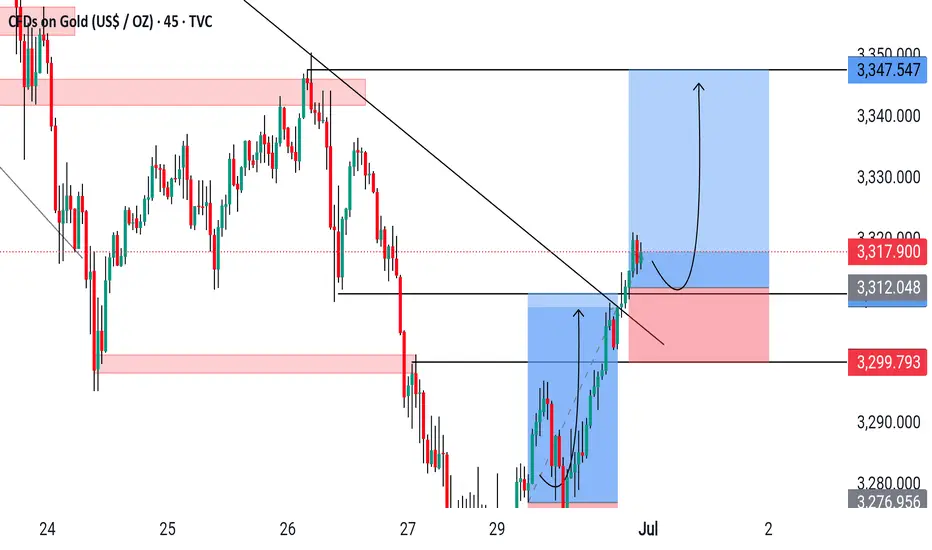
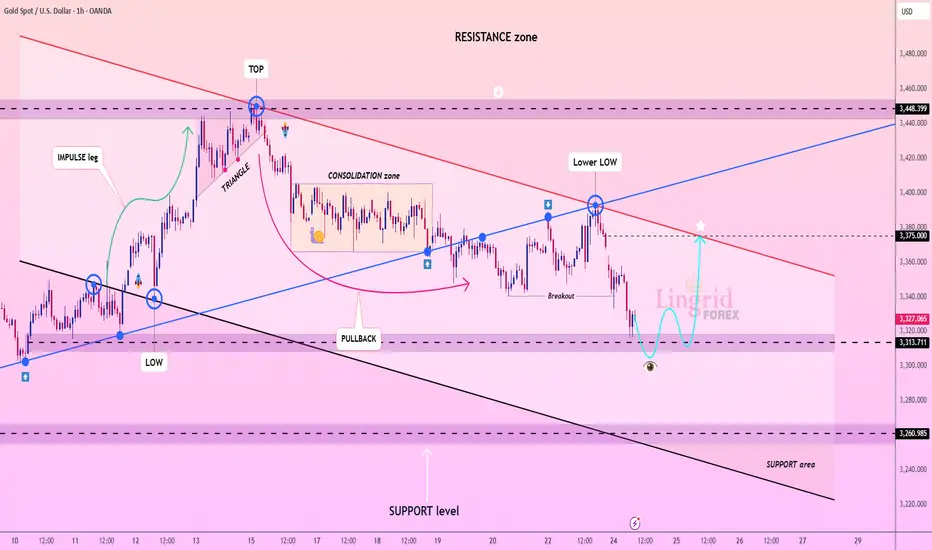
Lingrid | GOLD Retracement Entry Opportunity from Support ZoneOANDA:XAUUSD is attempting to stabilize after breaking below the consolidation zone and forming a new lower low near the 3,313 support. Price action hints at a bullish rebound setup, potentially targeting the 3,375 resistance aligned with the descending red trendline. The structure may shift if price forms a higher low and retests broken support as a springboard.
📈 Key Levels
Buy zone: 3,313 – 3,320
Sell trigger: break below 3,313
Target: 3,375
Buy trigger: higher low and breakout above minor resistance
💡 Risks
Failure to reclaim 3,313 could trigger another sell-off
Resistance trendline near 3,375 remains a rejection risk
Lack of volume confirmation may weaken bullish scenario
If this idea resonates with you or you have your own opinion, traders, hit the comments. I’m excited to read your thoughts!
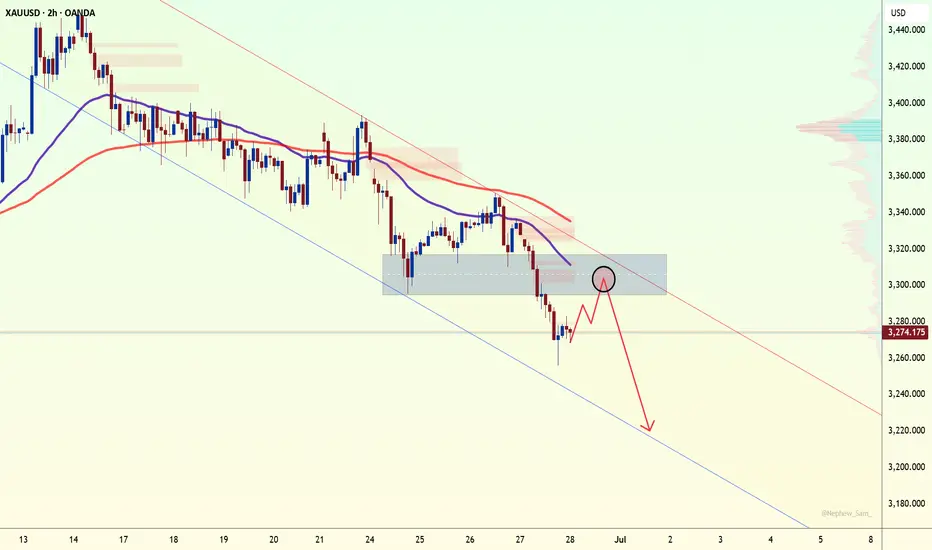
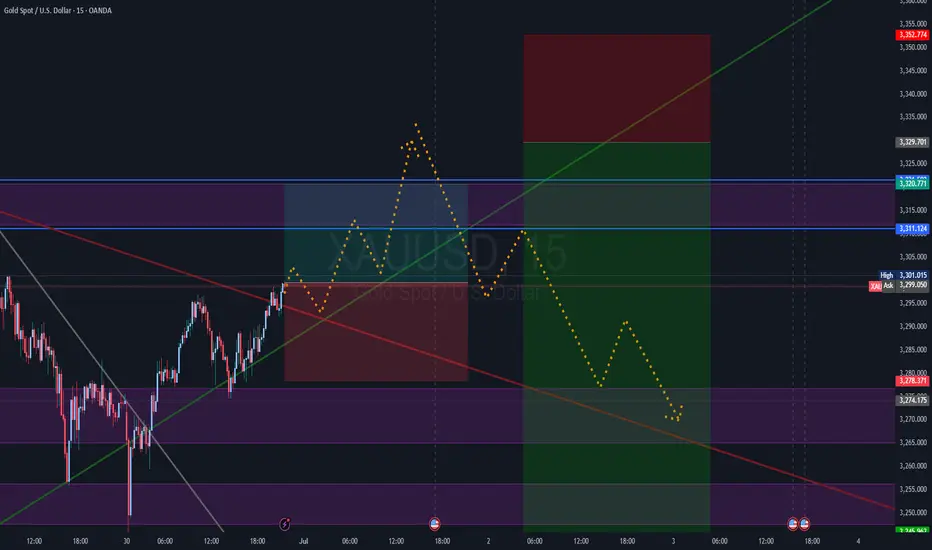
A potential scenario,- let`S see how it unfolds.Strong short term bullish movement. Strong area of resistance . Expect to see a SELL candle for the next month. Looking to take the upper 3295-3315 liquidity, before hunting the 3230 -3210 area.
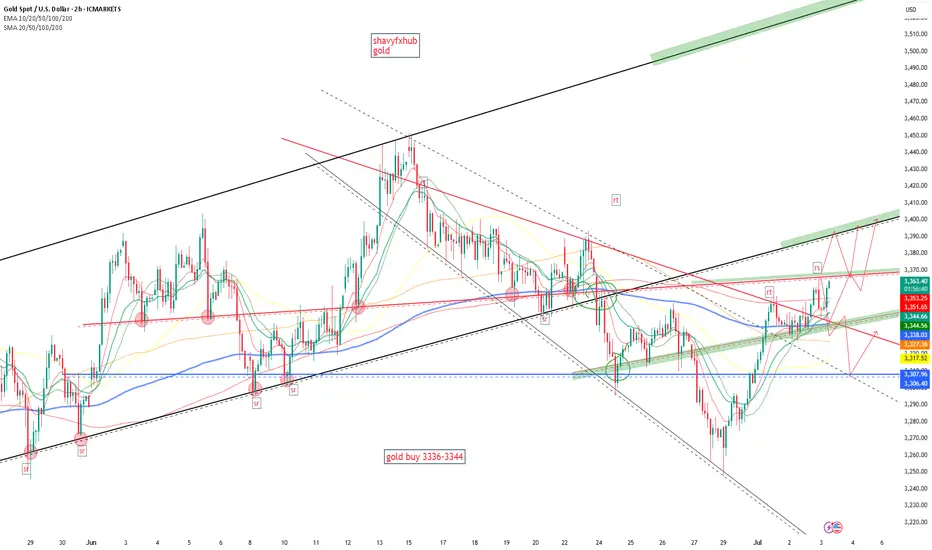
GOLD BEFORE AND AFTERGOLD ,we shared 2 zone ,daily and 4hr buy floor ,the daily was giving us 3322-3318 and 4hr/3hr 3336-3344 and 4hr came and played into a perfect retest of a broken descending trendline and we are holding lower layer hoping that london market could take us to 3400 soon.
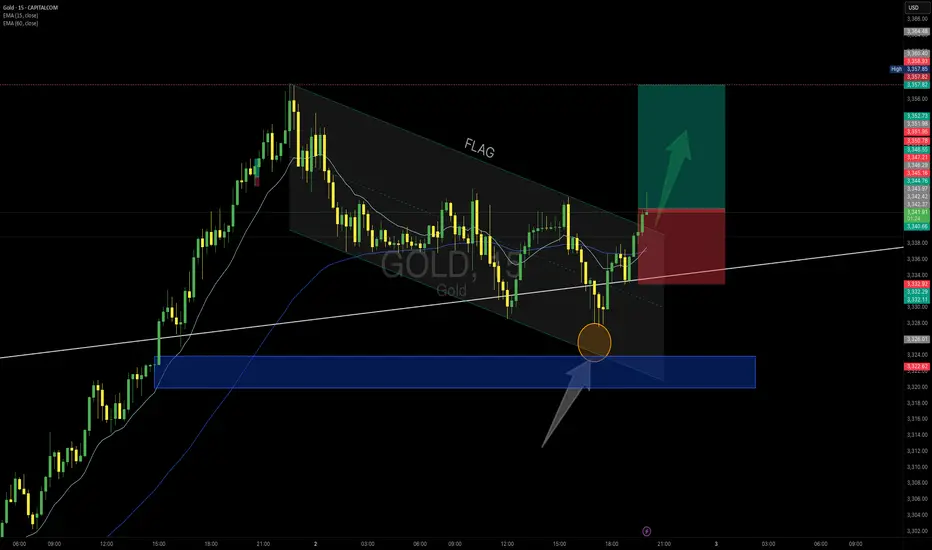
GOLD – Bullish Flag Breakout After Demand Zone Test
Price pulled back into the major demand zone (blue area), rejected with a strong wick, and formed a bullish flag structure. The breakout above the flag channel suggests continuation toward recent highs.
Trade Plan:
✅ Entry:
Above 3344 (breakout confirmation)
✅ Stop Loss:
Below 3332 (last swing low)
✅ Target:
3357–3360 (previous resistance zone)
Context:
• Demand zone respected
• EMA support aligning
• Clear breakout candle with volume
Risk Management:
Max risk per trade: 1%
Zoom in M5:
#Gold #XAUUSD #PriceAction #BreakoutTrading #MJTrading #ForexSignals #CommodityTrading
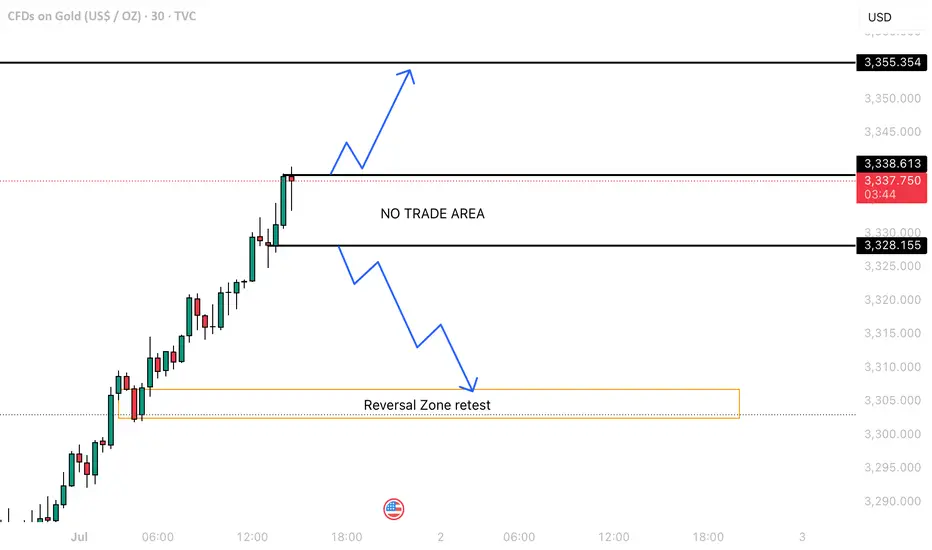
MONTH START WITH STRONG BUY MOVE ALERT !Currently, price action on the 30-minute chart is showing signs of weakness as it hovers near a key support level at around 3328. The chart has been respecting an ascending trendline, but now we see price attempting to break below this trendline 📉.
🔸 Resistance Zone: 3338
🔸 Support Zone: 3328
🔸 Bearish Target Area: 3315–3300 region
🚨 If the price breaks below the support and the ascending trendline is invalidated, we may see further downside movement, with a potential target near the 3300 zone, which aligns with a previous demand area.
🛑 Watch for confirmation (bearish engulfing candle or retest rejection) before entering a short position.
💡 Bias: Bearish below 3328
📌 Next Key Support: 3290
Let me know your thoughts in the comments! 💬
📊 Trade safe and always manage your risk! 🛡️
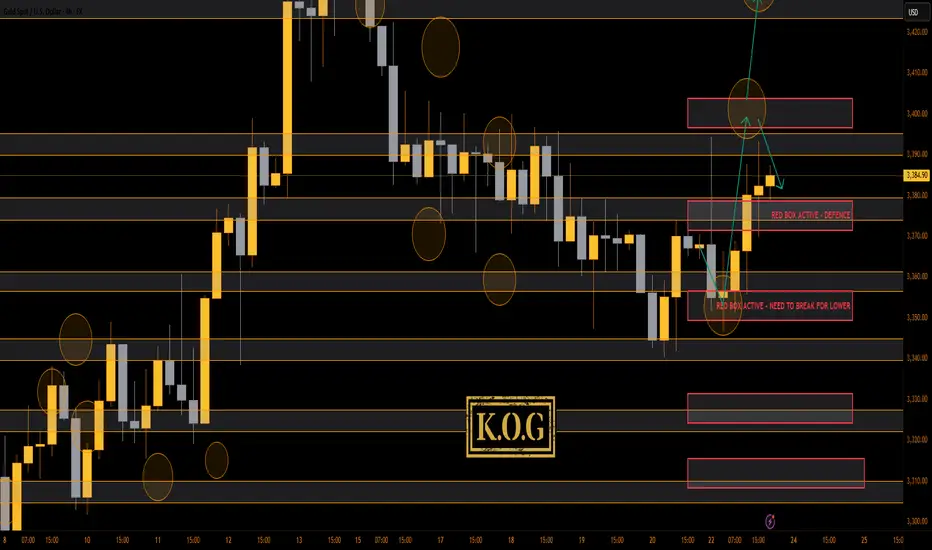
THE KOG REPORT - Update End of day update from us here at KOG:
Following on from the KOG report, we said there was a huge caveat to the idea, that being that we will tap into that red box resistance and then make the drop rather than just continuing upside. This move worked out well not only giving the RIP but also terminating at the red box and bias level which gave us the long trade upside to where we are now.
For now we have resistance at the 3395 level which still needs to break upside, while support is the 3370-75 level. Ideally, what we want to see over the Asian session is a break above the 3400 level, then a dip into the 3380-75 level before resuming the path we have anticipated in the report. For that reason, we won't change anything in our plans for now.
Please note, a break below 3370 is needed to change the structure.
Key Levels:
Red box defence 3375-80, needs to be broken
Red box defence 3350, needs to be broken
KOG’s bias of the week:
Bullish above 3340 with targets above 3375✅, 3390✅, 3395✅ and above that 3410
Bearish on break of 3340 with targets below 3330, 3320, 3310, 3306 and below that 3298
RED BOX TARGETS:
Break above 3375 for 3378✅, 3390✅, 3395✅, 3406, 3410 and 3419 in extension of the move
Break below 3365 for 3355✅, 3350✅, 3340, 3336, 3330 and 3323 in extension of the move
Please do support us by hitting the like button, leaving a comment, and giving us a follow. We’ve been doing this for a long time now providing traders with in-depth free analysis on Gold, so your likes and comments are very much appreciated.
As always, trade safe.
KOG