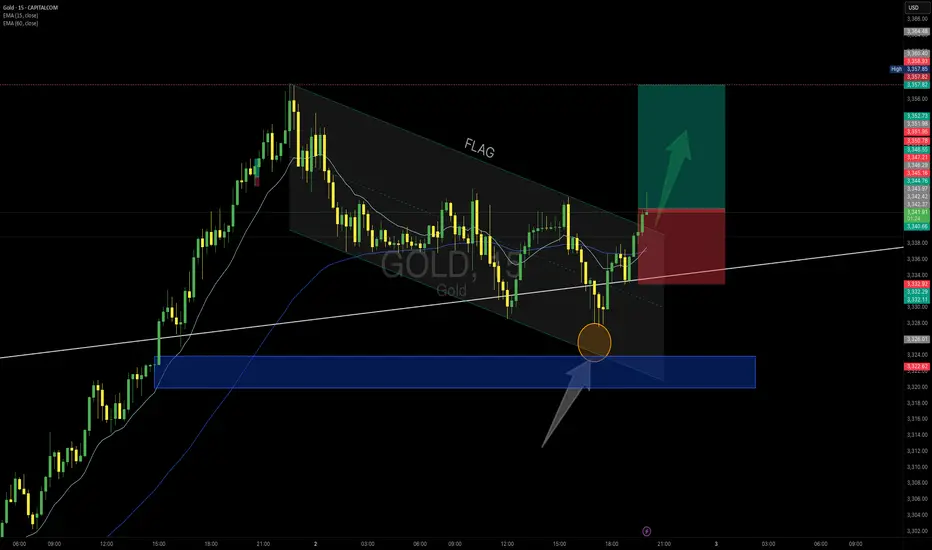
GOLD – Bullish Flag Breakout After Demand Zone Test
Price pulled back into the major demand zone (blue area), rejected with a strong wick, and formed a bullish flag structure. The breakout above the flag channel suggests continuation toward recent highs.
Trade Plan:
✅ Entry:
Above 3344 (breakout confirmation)
✅ Stop Loss:
Below 3332 (last swing low)
✅ Target:
3357–3360 (previous resistance zone)
Context:
• Demand zone respected
• EMA support aligning
• Clear breakout candle with volume
Risk Management:
Max risk per trade: 1%
Zoom in M5:
#Gold #XAUUSD #PriceAction #BreakoutTrading #MJTrading #ForexSignals #CommodityTrading
XAUUSD.F trade ideas
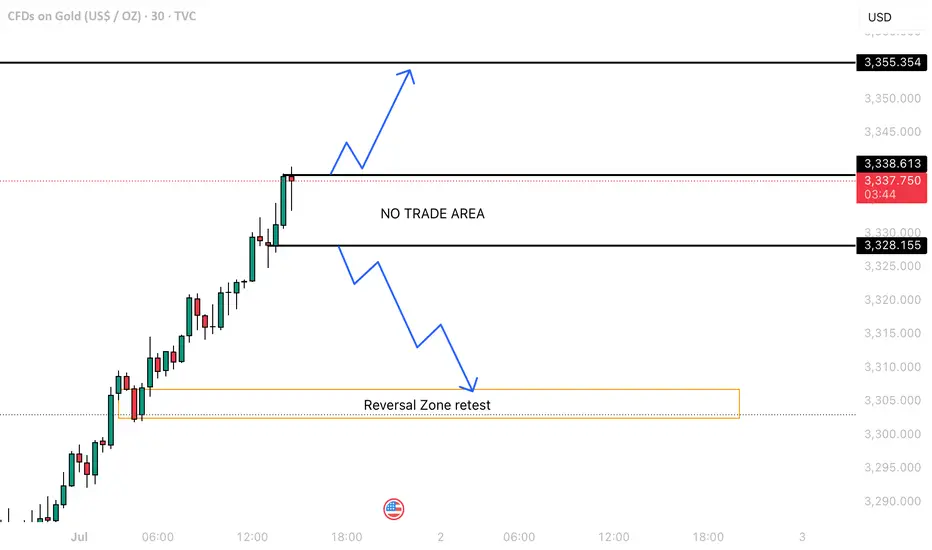
MONTH START WITH STRONG BUY MOVE ALERT !Currently, price action on the 30-minute chart is showing signs of weakness as it hovers near a key support level at around 3328. The chart has been respecting an ascending trendline, but now we see price attempting to break below this trendline 📉.
🔸 Resistance Zone: 3338
🔸 Support Zone: 3328
🔸 Bearish Target Area: 3315–3300 region
🚨 If the price breaks below the support and the ascending trendline is invalidated, we may see further downside movement, with a potential target near the 3300 zone, which aligns with a previous demand area.
🛑 Watch for confirmation (bearish engulfing candle or retest rejection) before entering a short position.
💡 Bias: Bearish below 3328
📌 Next Key Support: 3290
Let me know your thoughts in the comments! 💬
📊 Trade safe and always manage your risk! 🛡️
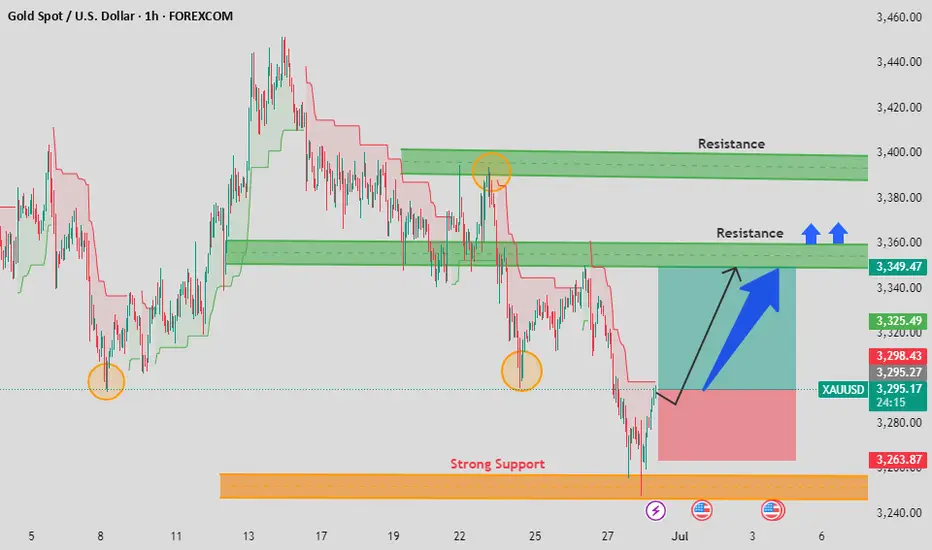
Gold (XAU/USD) Long Setup Gold (XAU/USD) Long Setup – Strong Support Bounce & Potential Reversal
Timeframe: 4H
Gold recently bounced off a well-defined strong support zone near $3,263, forming a potential double bottom structure. The price is now showing early signs of reversal with bullish momentum building.
Key Levels:
Entry: ~ $3,294
Stop Loss: Below $3,263 (support zone)
Target 1: $3,349 (minor resistance)
Target 2: $3,413 (major resistance)
Technical Confluence:
Price respected historical support (highlighted by multiple bounces)
Bullish price action with a recovery structure
Opportunity for upside retracement toward previous supply zones
Fundamental Outlook:
Gold may see bullish pressure amid geopolitical uncertainty and potential central bank dovish pivot
Market awaiting key macroeconomic data – watch for volatility spikes
Bias: Bullish (Short-to-Medium Term)
A solid buy setup for traders looking to capitalize on price recovery from a strong support zone with clearly defined risk
Gold Loses Its Luster as Risk Appetite Takes ControlAlthough inflation in the US continues to rise, the personal consumption expenditures (PCE) price index data for May showed that the core PCE increased to 2.7%, exceeding forecasts, but the market still does not expect the Fed to cut interest rates soon.
The USD slightly decreased, bond yields remained stable, but gold prices failed to take advantage of these supporting factors. According to experts, market sentiment is leaning towards risky assets, as US stocks hit a peak and US-China trade relations have positive developments. This is the main reason for the decline in safe-haven demand for gold.
Currently, the gold market is in a tug-of-war state, waiting for stronger signals from inflation, geopolitical tensions or global economic instability to determine the next trend. If there are no major fluctuations in the near future, gold may continue to adjust in the short term, especially when the technical resistance zone has not been broken.
Personally, I see that the money flow is temporarily stopping in gold and gradually shifting to growth assets. And if there is no strong enough “push”, gold will continue to move in this short-term downtrend for a while longer.

XAUUSD 4H Analysis – Possible Break Below Key StructureStructure Overview:
After printing a multi-month high around 3,473, price has formed a clear rounded top followed by lower highs, showing weakening bullish momentum. Gold is now retesting a key structure zone near 3,270–3,275, which has acted as previous support several times.
📉 Key Technical Observations:
Trend: Short-term bearish within a broader consolidation
Support Zone: 3,270–3,250 (watch closely for a break)
Resistance Levels:
Minor: 3,340
Major: 3,390–3,400
📊 Scenario Outlook
🔻 Bearish Bias (Preferred Scenario)
If price closes below 3,270, expect:
Initial target: 3,210–3,220 zone (clean imbalance + previous resistance)
Secondary target: 3,130–3,150 (March structure break zone)
This would confirm a transition into a mid-term bearish leg unless a fakeout occurs.
🔺 Bullish Recovery (Alternative Scenario)
If price reclaims 3,305 with strength:
A move back toward 3,340–3,360 is possible
Needs volume + momentum confirmation, ideally with a bullish engulfing candle
⚠️ What to Watch
Daily candle close relative to 3,270
Reaction at 3,250–3,260 demand zone
Gold often sweeps key lows before reversing — watch for liquidity grab wicks
📌 Conclusion
Gold is sitting at a critical level — a confirmed close below 3,270 could open the doors for a deeper retracement toward March’s breakout levels. Until then, this remains a watch and react environment. Avoid chasing.

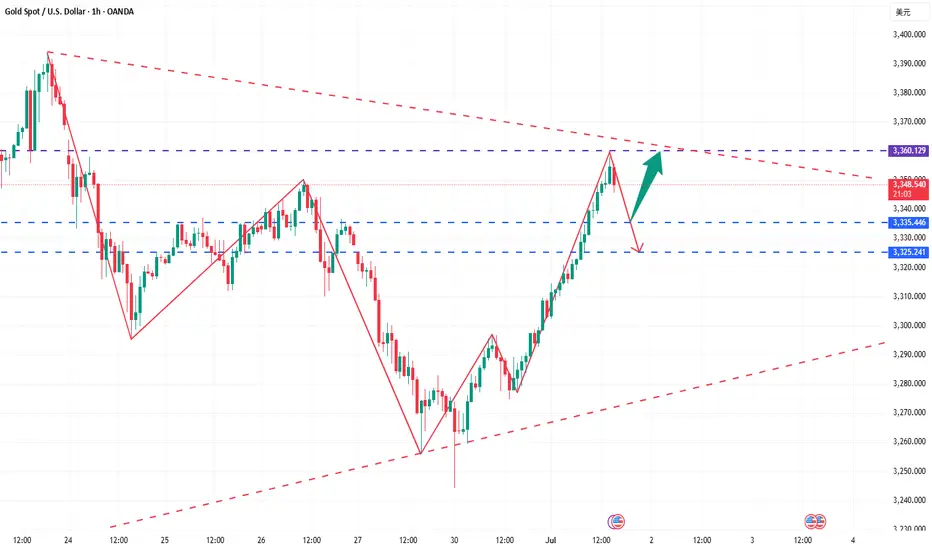
Short-term opportunities are imminent.Gold prices have continued to rebound recently and have reached around 3358, but there is a lack of effective retracement during the rise, and the risk of short-term chasing has increased significantly. From a technical perspective, the US dollar index has a demand for a corrective rebound after a rapid decline, and it is expected to form a significant suppression on gold in the short term, limiting the rebound space of gold prices. From a capital perspective, the previous high-level long chips have gradually been untied and started to leave the market with profits, and selling pressure has gradually emerged; short positions may be re-arranged after completing concentrated stop losses, and the market structure is quietly changing.
Based on the above factors, it is recommended that traders remain patient and continue to hold short positions, focusing on the support of the 3335-3325 area. Be sure to control your position during the operation, strictly set stop losses, and avoid the high risks brought by chasing the rise. The core of trading is to follow the trend, respect the market rhythm, and wait for the adjustment to be confirmed before intervening.
Steady trading can only make long-term profits. Welcome everyone to share and communicate to improve the operation level together.
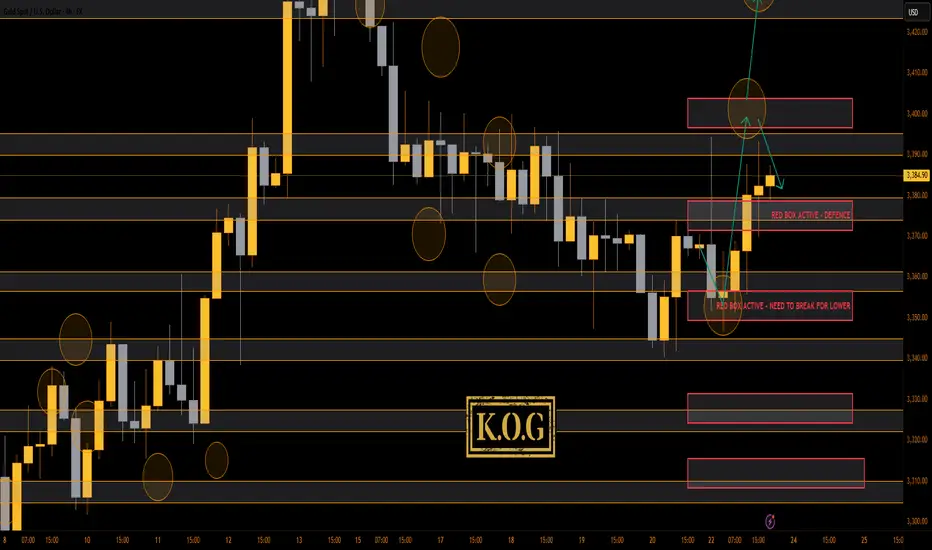
THE KOG REPORT - Update End of day update from us here at KOG:
Following on from the KOG report, we said there was a huge caveat to the idea, that being that we will tap into that red box resistance and then make the drop rather than just continuing upside. This move worked out well not only giving the RIP but also terminating at the red box and bias level which gave us the long trade upside to where we are now.
For now we have resistance at the 3395 level which still needs to break upside, while support is the 3370-75 level. Ideally, what we want to see over the Asian session is a break above the 3400 level, then a dip into the 3380-75 level before resuming the path we have anticipated in the report. For that reason, we won't change anything in our plans for now.
Please note, a break below 3370 is needed to change the structure.
Key Levels:
Red box defence 3375-80, needs to be broken
Red box defence 3350, needs to be broken
KOG’s bias of the week:
Bullish above 3340 with targets above 3375✅, 3390✅, 3395✅ and above that 3410
Bearish on break of 3340 with targets below 3330, 3320, 3310, 3306 and below that 3298
RED BOX TARGETS:
Break above 3375 for 3378✅, 3390✅, 3395✅, 3406, 3410 and 3419 in extension of the move
Break below 3365 for 3355✅, 3350✅, 3340, 3336, 3330 and 3323 in extension of the move
Please do support us by hitting the like button, leaving a comment, and giving us a follow. We’ve been doing this for a long time now providing traders with in-depth free analysis on Gold, so your likes and comments are very much appreciated.
As always, trade safe.
KOG
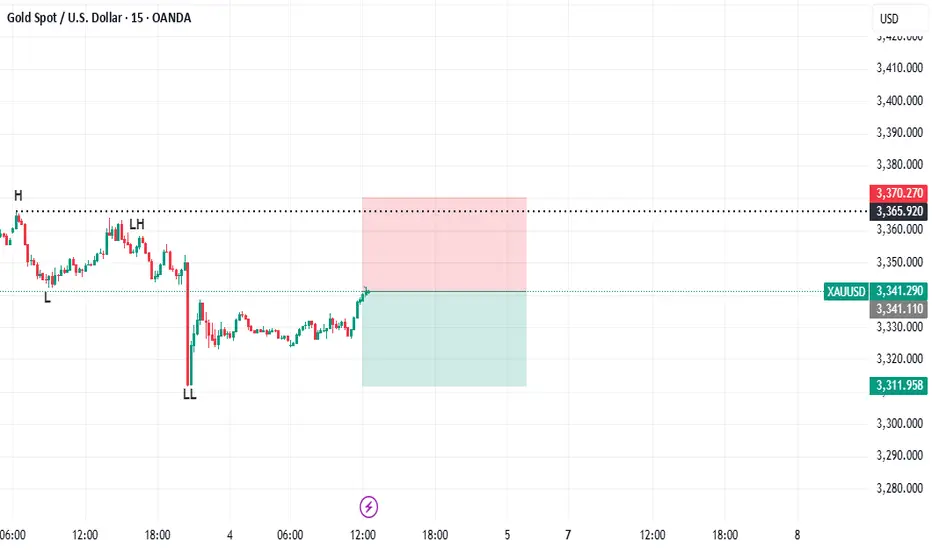
Simple analysisSimple analysis using trend patterns. I saw a downtrend pattern which is H-L-LH-LL. So, I decided to sell. RRR 1:1
Gold AnalysisI am seeing gold for a bearish move as it shifts its direction i am taking a short position from marked zone you guys can manage your risk accordingly
Gold Trading Strategy July 1✏️ D1 candle has a bullish recovery when closing above 50% of last Friday's decline.The bullish wave of Gold is forming, heading back to the GAP 3363 zone.Today's main strategy is to wait for BUY if there is a retest of 3300. Reaction sell strategy is focused on resistance zones with not too long expectations.
📈 Key Levels
Support 3300- 3379- 3360
Resistance 3334-3348-3363
📊 Recommended Trade Setups
BUY GOLD 3300-3298 Stoploss 3295
SELL GOLD 3348-3350 Stoploss 3353
Daily live trade with XAUUSD in 15m/30m/1h 20250630Daily live trade with XAUUSD in 15m/30m/1h 20250630
Gold rebounded from oversold!Gold fell continuously on Friday, and the daily line closed in a cross. Although the previous closing was a small positive, the rebound was discontinuous and there was no strong upward movement, which means that the overall reversal has not ended and there is still room for downward adjustment. It continued to fall to the 3255 line and rebounded slightly, and then approached the 3280 mark. The support below is dense, and there is no condition for aggressive shorting. If you want to short, you still have to rebound and then short.
This week, the two key positions above 3295 and 3310 were suppressed. The monthly closing is likely to be a new low. Be cautious.

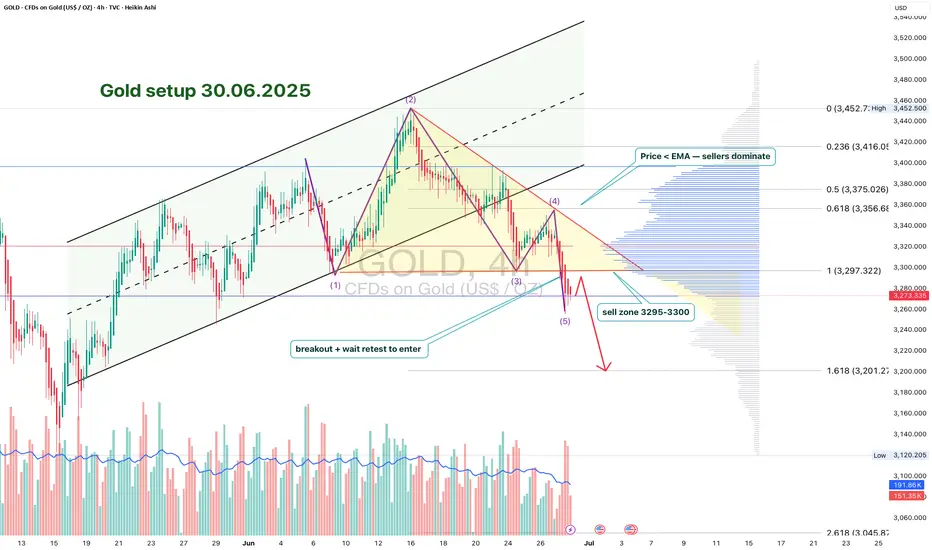
GOLD 4H: structure broken - phase reversal beginsTwo key directional signals were recorded on the gold chart: first, a breakdown of the ascending channel, followed by a confident downward exit from the triangle with a clear fixation under the $3297 boundary. Both figures worked independently, but consistently - and strengthened the impulse towards selling.
The price has already gone beyond the lower boundary of the triangle ($3297), confirming the bearish scenario. Candlesticks closing under the level and local consolidation from below is a characteristic formation before the momentum continues.
Technical parameters:
- Channel breakout: completed
- Triangle breakout: $3297 level
- Retest from below: expected as confirmation
- EMAs reversed downwards, structure broken
- Volumes strengthened at the moment of breakout
Tactical plan:
- Sell after retest of $3297
- Targets on the move: $3248 and $3201
- Stop: above $3305 (above the area of false outs).
The current structure indicates the end of the accumulation phase and the beginning of the downward momentum. As long as the price holds below $3297 - shorts are the priority.
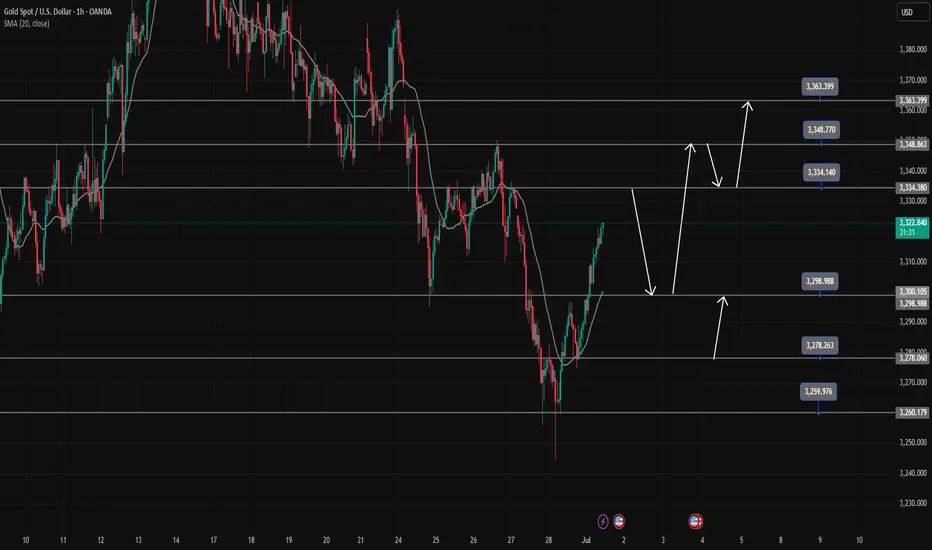
Exclusive operation suggestions for future market trends!!!Gold bottomed out and rebounded on Monday, so wait patiently for room for future gains. Technically, from the current hourly chart, the gold entity has always been above 3278, and it only pierced through 3275 and then began to rebound. If the retracement does not break the 618 position, there will inevitably be a high point in the future. So next, we should focus on the vicinity of 3280. If gold always closes above 3280, then the high point of 3297 on Monday is likely to be refreshed. Secondly, from the perspective of 123 seeking 4, if it goes up again, it is very likely to touch around 3310. 3310 is exactly around 618. And it is also the top position of this hourly chart range. Therefore, gold should be shorted above 3280 with caution, and the probability of touching above 3300 is very high. In terms of operation, it is recommended to directly enter the market to go long near 3280, and look at 3310-3320. If you want to short, you must wait at least for 3310-3320 before you can enter the market to short once.
Gold Top Down Analysis end of June 2025Welcome to my Top Down Analysis. My short trade has not yet reached TP but I explain in the video how the next few weeks might go.
My sell entry : 3443
My TP : 3214

gold bearish trading ideagold bearish trading idea gold breakdown traingle now gold next move [possible to sell target 3170

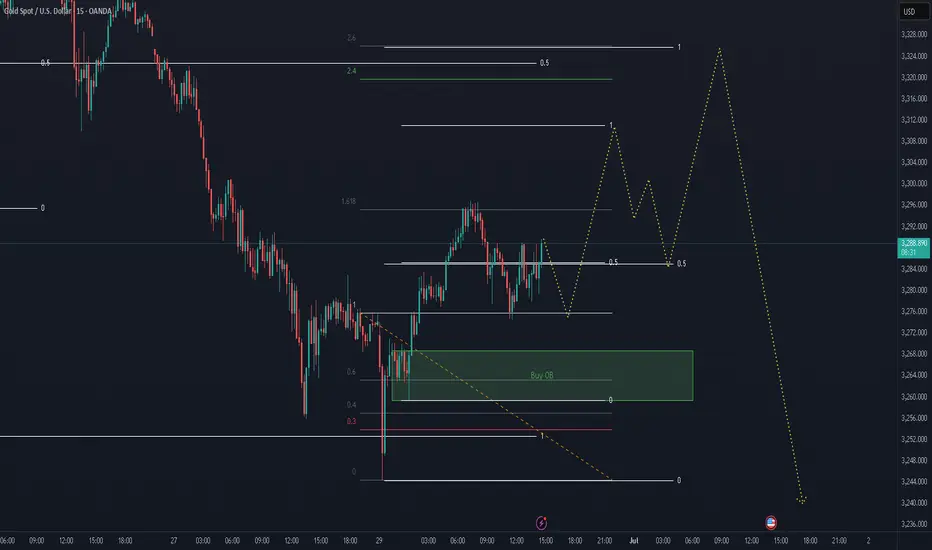
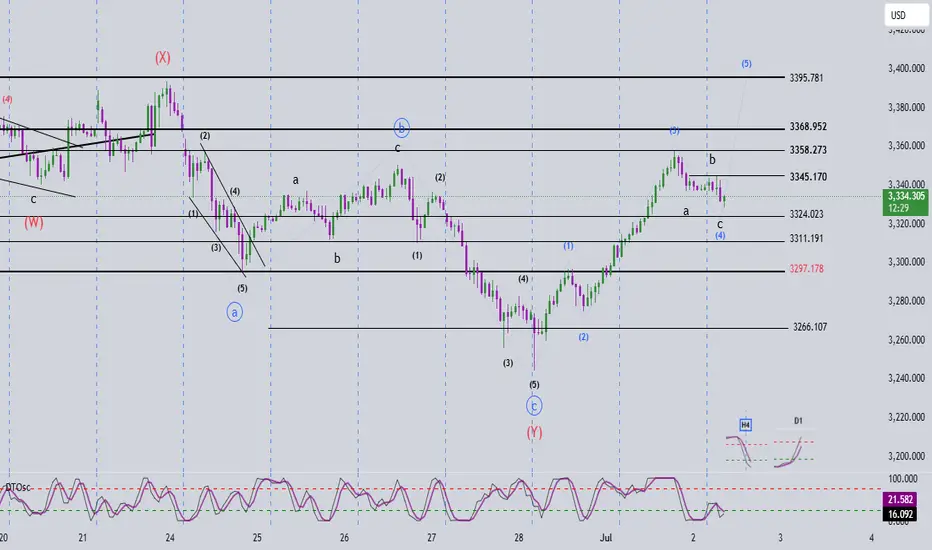
Elliott Wave Analysis – XAUUSD | February 7, 2025🌀 Elliott Wave Structure (H1 Timeframe)
Looking at the current price structure, we can see that the price is moving sharply and steeply—this suggests the formation of a 5-wave impulsive structure.
Specifically:
- Waves 1, 2, and 3 (green) appear to have completed.
- Currently, wave 4 is forming as a 3-wave corrective structure (abc in black).
- Once wave 4 completes, we anticipate the next upward move as wave 5, which will complete the full 5-wave cycle (green).
🎯 Potential Price Targets for Wave 4
Based on the structure of the abc correction and support zones, we identify two key target areas:
+ Target 1: 3324
+ Target 2: 3311
When the price breaks above the top of wave b (black), it will serve as a strong confirmation that wave 4 has ended and wave 5 is beginning.
📈 Momentum Analysis
Daily (D1): Momentum is still rising and likely needs 2–3 more days to enter the overbought zone, supporting the continuation of the uptrend.
H4: Momentum is about to turn upward, signaling wave 4 may be nearing completion.
H1: Momentum is also preparing to turn up, suggesting the price is approaching the end of the wave 4 correction zone.
💼 Trading Plan
BUY ZONE: 3325 – 3322
STOP LOSS: 3215
TAKE PROFIT 1: 3345
TAKE PROFIT 2: 3368
TAKE PROFIT 3: 3395
📌 Wait for H1–H4 momentum alignment before triggering a BUY entry for wave 5.
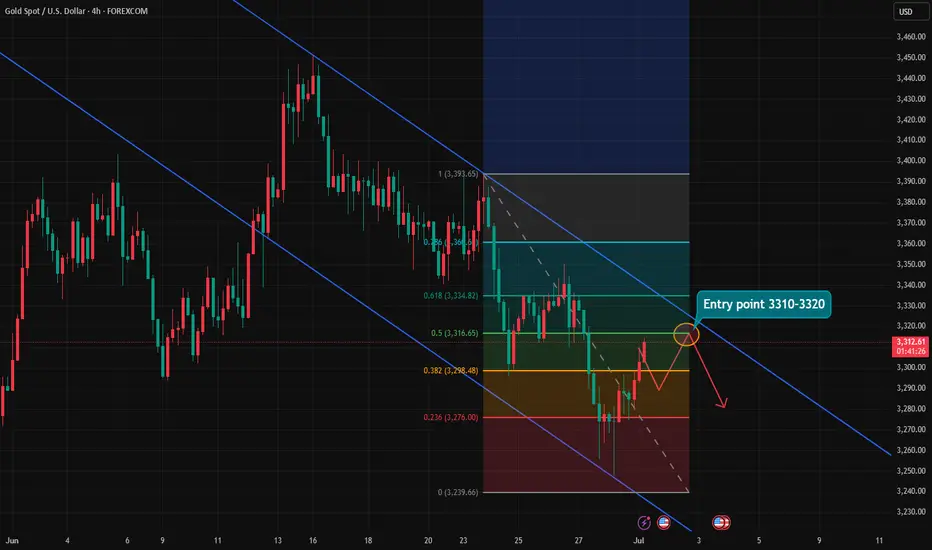
As expected, it will fall and form a head and shoulders bottom📰 News information:
1. ADP data, for reference of tomorrow's NFP data
2. Interest rate cuts and Powell's dovish comments
3. Geopolitical impact on the gold market
📈 Technical Analysis:
Yesterday we expected gold to retreat to the 3330-3320 area. Today, gold hit a low of around 3328 during the Asian session, which is in line with our judgment of the market trend. In the short term, gold may still fall. First, it may test the 3323 support line. If it falls back to this position during the day, you can try to go long. In the short term, focus on the 3315-3305 long-short dividing line below. If gold gets effective support below, it is expected to form a head and shoulders bottom pattern. The short-term decline will accumulate momentum for the future rise. Pay attention to the ADP data during the NY period
🎯 Trading Points:
BUY 3323-3315-3305
TP 3340-3350-3360-3375
In addition to investment, life also includes poetry, distant places, and Allen. Facing the market is actually facing yourself, correcting your shortcomings, confronting your mistakes, and strictly disciplining yourself. I hope my analysis can help you🌐.
FXOPEN:XAUUSD PEPPERSTONE:XAUUSD FOREXCOM:XAUUSD FX:XAUUSD OANDA:XAUUSD TVC:GOLD
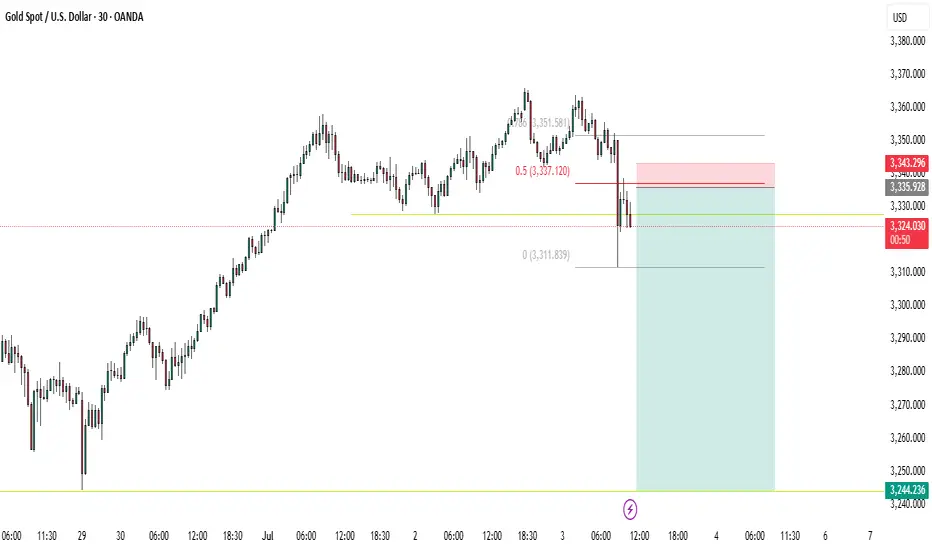
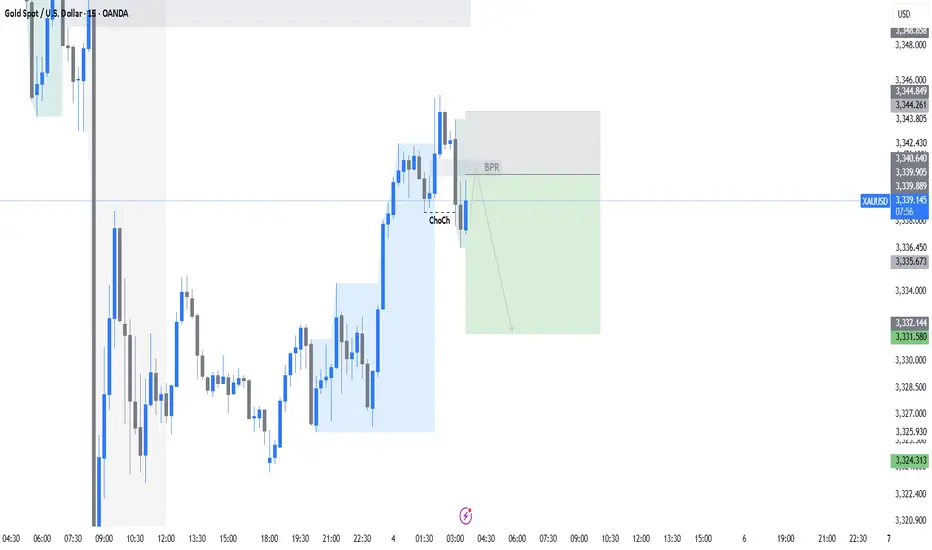
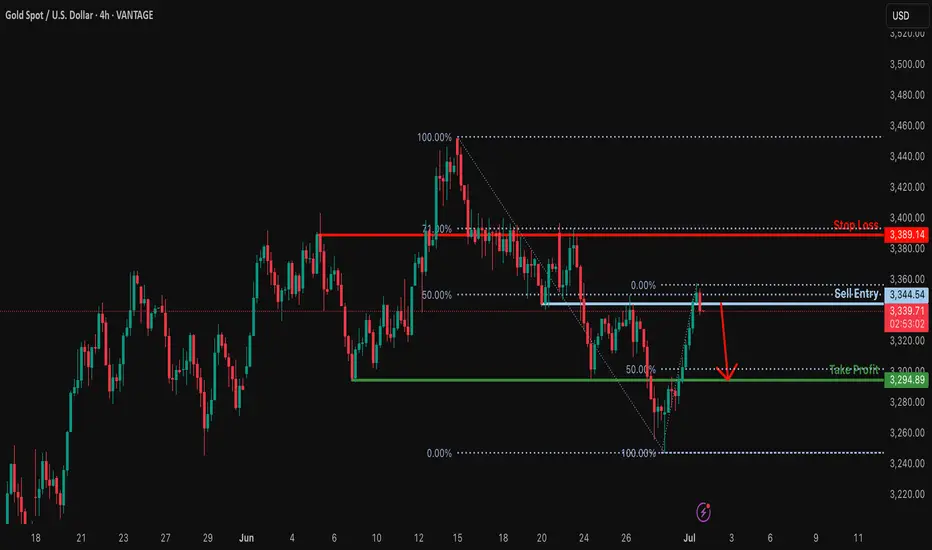
Bearish drop?XAU/USD is reacting off the resistance which is a pullback resistance that lines up with the 50% Fibonacci retracement and could drop from this level to our take profit.
Entry: 3,344.54
Why we like it:
There is a pullback resistance that lines up with the 50% Fibonacci retracement.
Stop loss: 3,389.14
Why we like it:
There is a pullback resistance that lines up with the 71% Fibonacci retracement.
Take prpofit: 3,294.89
Why we like it:
There is a pullback support level that aligns with the 50% Fibonacci retracement.
Enjoying your TradingView experience? Review us!
Please be advised that the information presented on TradingView is provided to Vantage (‘Vantage Global Limited’, ‘we’) by a third-party provider (‘Everest Fortune Group’). Please be reminded that you are solely responsible for the trading decisions on your account. There is a very high degree of risk involved in trading. Any information and/or content is intended entirely for research, educational and informational purposes only and does not constitute investment or consultation advice or investment strategy. The information is not tailored to the investment needs of any specific person and therefore does not involve a consideration of any of the investment objectives, financial situation or needs of any viewer that may receive it. Kindly also note that past performance is not a reliable indicator of future results. Actual results may differ materially from those anticipated in forward-looking or past performance statements. We assume no liability as to the accuracy or completeness of any of the information and/or content provided herein and the Company cannot be held responsible for any omission, mistake nor for any loss or damage including without limitation to any loss of profit which may arise from reliance on any information supplied by Everest Fortune Group.
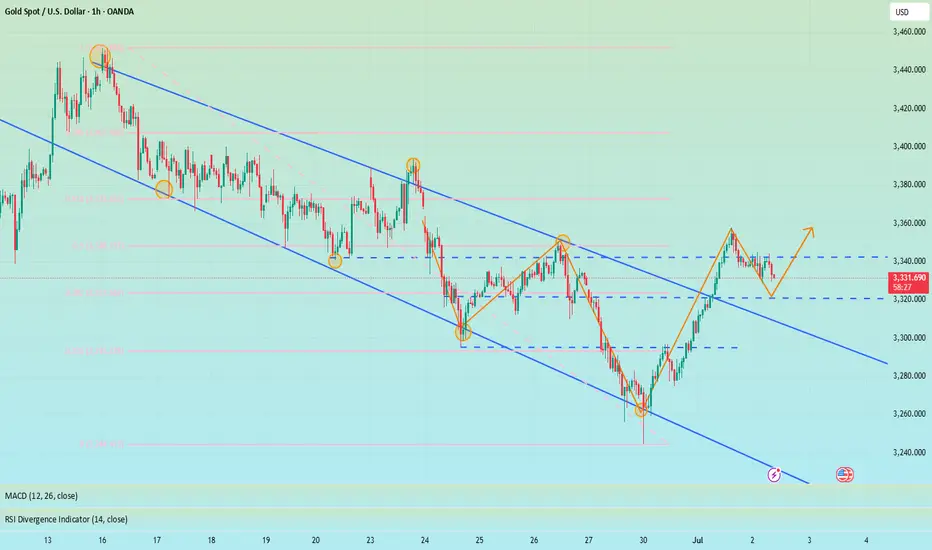
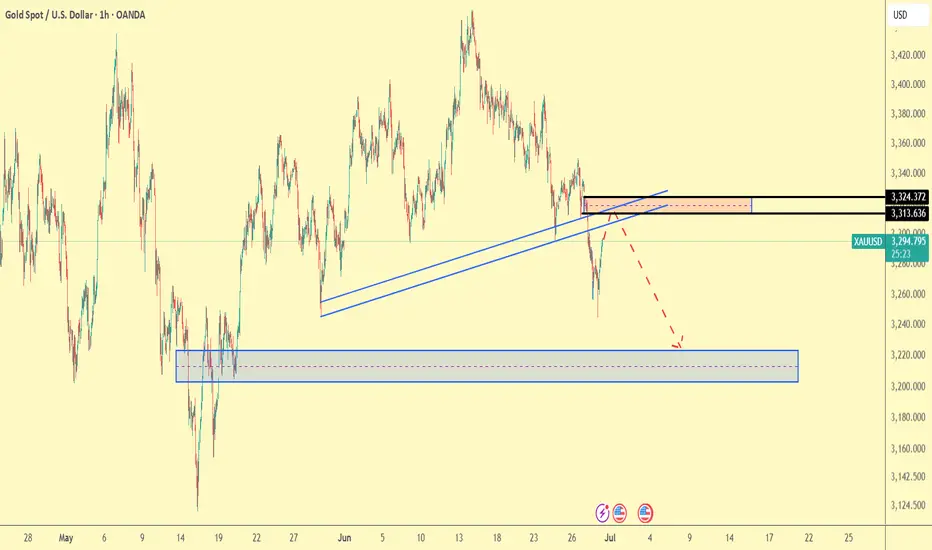
Gold Trade Plan 30/06/2025Dear Traders,
📉 Technical Analysis – XAU/USD (1H Timeframe)
Date: June 30, 2025
🇺🇸 English:
Price has broken below an ascending trendline and is now pulling back toward the resistance zone between $3,313 – $3,324.
This area serves as a confluence of resistance (previous support now turned resistance + horizontal resistance).
A bearish reaction from this zone could trigger a continuation to the downside.
The potential target for this move lies around the $3,210 – $3,225 support area, which has historically acted as a demand zone.
Alternative scenario: If price breaks and holds above $3,324, the bearish outlook would be invalidated.
Summary:
🔻 Resistance zone: $3,313 – $3,324
🎯 Bearish target: $3,210 – $3,225
❗ Entry condition: Bearish reaction and rejection from the resistance zone
Regards,
Alireza!
"Gold at Critical Zone – Parabolic Curve Support or Breakdown? 📈 Gold Parabolic Structure | Base 4 Breakout Setup | $4,000 Target
Sharing my analysis on Gold’s ongoing parabolic trend, which has followed a textbook progression of Base 1 → Base 4 since mid-2022. The price has respected a structural curved trendline, and we are currently in Base 4 consolidation — often the final pause before a blow-off rally.
Current Setup:
Gold is consolidating between $3,200 – $3,400, forming Base 4.
There is weekly bearish divergence, indicating momentum loss, but this is normal in late-stage parabolas.
I expect a retest of the $3,200 zone, near the parabolic curve support, possibly with a fakeout wick below — a common shakeout before the final rally.
Seasonality suggests the first week of July is typically bearish, which aligns with this potential retest.
Trade Plan (If Setup Confirms):
Watch for a strong bullish reversal candle near $3,200 (parabolic curve support).
Entry above the high of that bullish candle.
Stop loss just below the candle’s low.
Target: $4,000+, which aligns with typical blow-off potential (+20–25% from Base 4 breakout).
If Gold breaks and holds above $3,400, it could begin the vertical phase of the move.
Parabolic Move Concept Recap:
Base 1: Accumulation
Base 2: Confirmation
Base 3: Acceleration
Base 4: Final pause before blow-off
After Base 4, price often rallies sharply before forming a major top.
This is a high-reward but high-risk phase. Manage risk and don’t chase late entries once the move begins.
Would love to hear your thoughts and variations on this setup.
#Gold #XAUUSD #ParabolicTrend #TechnicalAnalysis #BlowOffTop #Base4

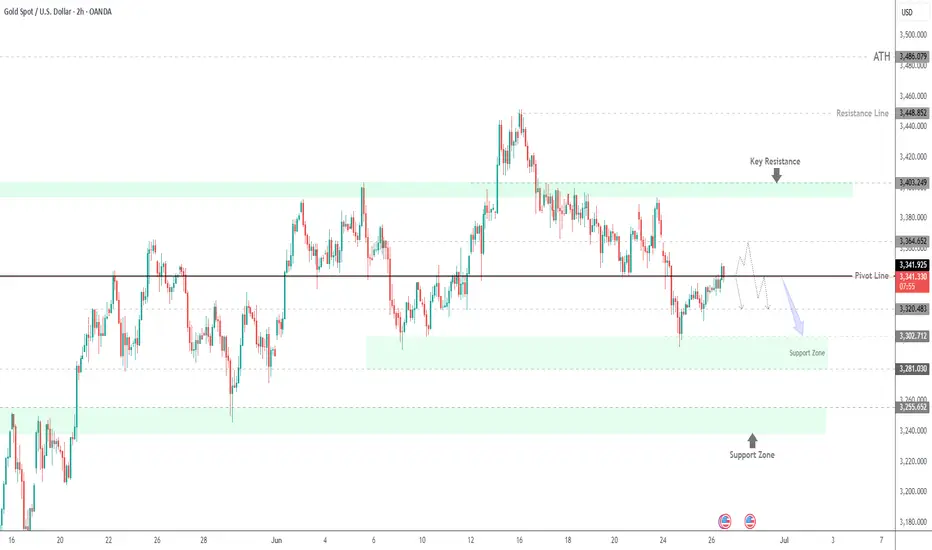
Gold Holds Above $3340 as Dollar Drops and Fed Uncertainty Rises GOLD OVERVIEW
Gold Holds Gains as Dollar Weakens and Fed Uncertainty Grows
Gold climbed above $3,340 per ounce on Thursday, supported by a sharp decline in the U.S. dollar amid growing dovish expectations from the Federal Reserve.
Adding to market speculation, U.S. President Donald Trump hinted he may announce a new Fed Chair as early as September or October, potentially reducing Jerome Powell’s influence before his term ends in June and boosting expectations for a more accommodative policy stance.
TECHNICAL OUTLOOK – XAU/USD
Gold shows bearish potential if the price can stabilize below the pivot level at 3,341.
However, while trading above 3,341, a short-term correction toward 3,364–3,365 is likely before any renewed selling pressure.
Today’s U.S. GDP release may add further volatility and direction to the market.
Key Levels
Pivot Line: 3,341
Resistance: 3,364 → 3,373
Support: 3,320 → 3,302
previous idea: