Gold Bull Markets: Long-Term Overview & Current Market UpdateGold Bull Markets: Long-Term Overview & Current Market Update (2024–2025)
________________________________________
🏆 Historic Gold Bull Markets: Timeline & Stats
1️⃣ 1968–1980 “Super Bull”
• Start/End: 1968 ($35) → 1980 ($850)
• Total Gain: ~2,330%
• Key Drivers:
o End of the gold standard (Bretton Woods collapse)
o Double-digit inflation, oil shocks
o Political/economic turmoil (Vietnam, stagflation)
• Correction:
o Nearly –45% drop (1974–1976)
• Recovery:
o Took years; massive rebounds afterward
2️⃣ 1999–2012 Bull Market
• Start/End: 1999 ($252) → 2012 ($1,920)
• Total Gain: ~650%
• Key Drivers:
o Commodities supercycle
o Emerging market demand
o US dollar weakness, financial crisis fears
• Correction:
o ~–30% during 2008 crisis, but fast recovery
• Recovery:
o Rebounded quickly after 2008, then peaked in 2011–12
3️⃣ 2016/2018–2027 (Current Cycle)
• Start/End: 2016/2018 ($1,050–$1,200) → ongoing ($3,500+)
• Key Drivers:
o Record central bank buying
o Persistent inflation & low real rates
o Geopolitical instability (Russia/Ukraine, China/US, etc.)
• Correction:
o Only –20% drawdown in 2022; quick recovery
o Broke 13-year technical “cup-and-handle” base in 2024
________________________________________
📊 Current Bull Market Stats (2025) – At a Glance
Metric 1968–80 Super Bull 1999–2012 Bull 2018–2025 Current Bull
🚀 Total Gain ~2,330% ~650% ~200% so far
⏲️ Duration 12 years 13 years 7–9 years so far
💔 Max Drawdown –45% (1974–76) –30% (2008) –20% (2022)
🏦 Central Bank Role Moderate Emerging Dominant
📉 Correction Recovery Years 4 years Months
🏛️ Technical Pattern Secular breakout Multiple peaks 13-yr base breakout
________________________________________
📈 Top 10 Stats of the Current Gold Bull Market (2025):
1. Gold Price:
o ~$3,338–$3,364/oz; ATH > $3,500 in April 2025
2. Year-to-Date Gain:
o +29% YTD (2025); +30% in 2024
3. Central Bank Demand:
o 1,000 tonnes bought for 4th straight year; reserves near records
4. Inflation Hedge:
o Strong negative correlation with real yields; safe-haven demand up
5. Gold vs S&P 500:
o Gold +27% YTD; S&P 500 up only ~2%
6. Jewelry Demand:
o Down –9% in 2024, projected –16% in 2025 (high prices suppress demand)
7. Gold-Silver Ratio:
o Now ~94 (down from 105); silver catching up
8. Record Closes:
o Over 40 daily record closes in 2025; price consolidating near highs
9. Technical Breakout:
o 13-year “cup-and-handle” breakout (March 2024)
10. 2025 Forecasts:
• Range: $3,600–$4,000 by Q2 2026; some see $4,500+ if risks persist
________________________________________
🔄 How This Bull Market Stands Out
• Dominance of Central Banks:
Central banks are setting the pace—record demand, making gold a reserve anchor again.
• Faster Recovery:
Corrections are less severe, recoveries are quick (months, not years).
• Synchronized Rally with Equities:
Rare for gold and stocks to hit highs together—shows systemic confidence in gold.
• Technical Breakout:
13-year base break signals powerful, long-term momentum.
• Future Outlook:
Targets as high as $7,500/oz (650% from cycle lows) possible by 2026/27, if historical analogs play out.
________________________________________
⭐️ Recommended Strategy (2025 and Beyond)
• BUY/HOLD/ACCUMULATE on Dips:
Favor physical gold, gold ETFs (GLD), and miners (GDX).
• Physical Over Paper:
Preference for allocated, physical bullion amid rising counterparty risks.
• Diversify with Miners/Silver:
Gold-silver ratio suggests silver may offer leverage; quality miners benefit in the latter stage of bull runs.
• Long-Term Perspective:
Anticipate volatility, but higher highs are likely if macro themes persist.
________________________________________
🧭 Summary Table: Historic vs Current Bull Markets
Feature 1968–80 1999–2012 2016/18–2027
Total Gain 2,330% 650% 200%+ (so far)
Duration 12 yrs 13 yrs 7–9 yrs (so far)
Correction –45% –30% –20%
Main Buyer Retail Funds Central Banks
Pattern Parabolic Cyclical Cup & Handle
Key Risks Inflation USD/credit Inflation, war, geopolitics
________________________________________
Key Takeaways
• Gold’s current bull market is distinguished by relentless central bank demand, robust technical momentum, and swift recoveries from corrections.
• The macro backdrop—persistent inflation, global uncertainty, and sovereign de-dollarization—supports an extended cycle.
• Expectations for $4,000+ gold in the next 12–24 months are widely held, with even higher targets in a true global crisis.
XAUUSD.F trade ideas

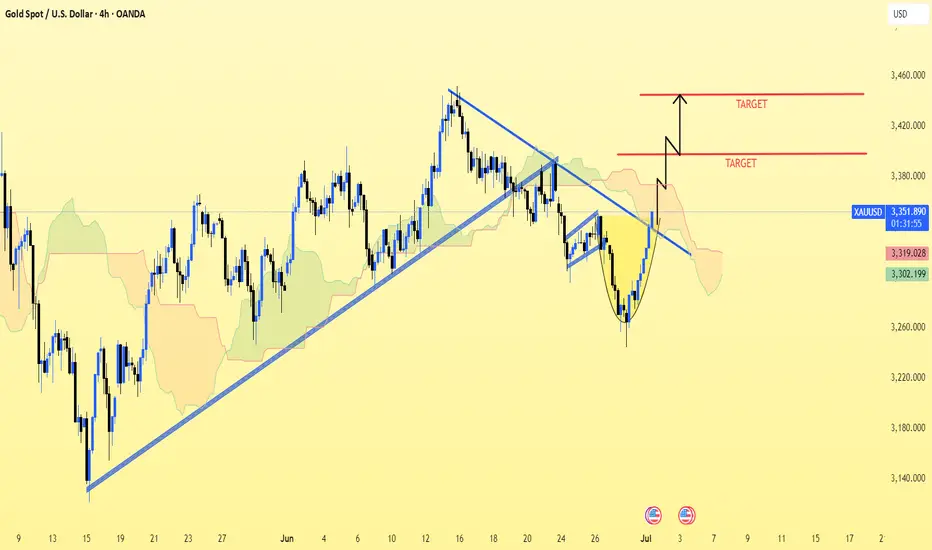
XAU/USD (Gold vs. US Dollar) 4h chart pattern XAU/USD (Gold vs. US Dollar) on the 4-hour timeframe displays a bullish cup and handle pattern forming, with a breakout above the handle resistance and Ichimoku cloud.
Technical Observations:
Cup and Handle pattern indicates bullish continuation.
Breakout has occurred above trendline and handle.
Price is trading near $3,350 (approx).
Two upside TARGETS are marked on the chart.
---
🎯 Projected Targets (Approximate):
Based on your chart:
1. First Target (TP1): Around $3,390 - $3,395
2. Second Target (TP2): Around $3,425 - $3,430
These targets align with the measured move of the cup height projected from the breakout level.
---
✅ Confirmation:
Price is above the trendline and trying to hold above the Ichimoku cloud.
Entry would be ideal on a pullback to the breakout zone (~31,335-$3,340) for lower risk.
Stop-loss can be considered below the handle low (~$3,310 or $3,305).
Let me know if you want Fibonacci-based targets or support/resistance levels as well.
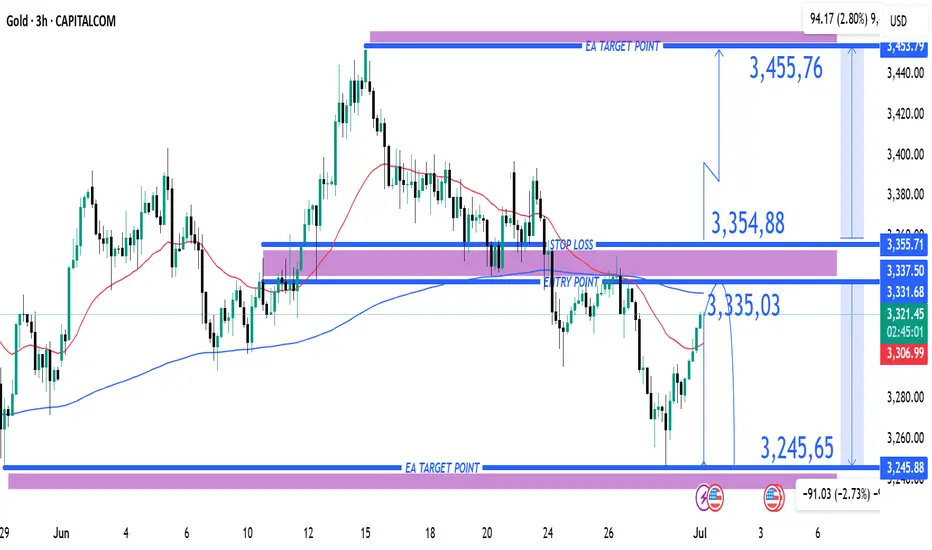
(XAU/USD) 3H Chart – Bearish Reversal Setup from Resistance Zon1. Entry Point (Sell):
Marked at 3,335.03
This is a key resistance level where price is expected to reverse downward.
2. Stop Loss:
Placed above at 3,354.88
This acts as a protection level in case the trade goes against the direction.
3. Take Profit Targets (EA Target Points):
TP1 (Downside): 3,245.65
TP2 (Upside - if Stop Loss is hit): 3,455.76 (in case of reversal or long position)
4. Price Action Observation:
Price is currently around 3,320.56, climbing back toward the entry zone.
The red 50-period moving average (EMA) and blue 200-period MA show convergence, often preceding volatility.
---
📉 Bearish Scenario (Main Setup)
Sell Bias is expected from the 3,335 region.
If price respects the resistance zone and breaks down again, the target is 3,245.65, yielding approximately 90-point move.
This is a risk-reward favorable setup, with:
Risk: ~20 points
Reward: ~90 points
RRR ≈ 1:4.5
---
⚠️ Bullish Invalidity (Stop Loss Hit)
If the price breaks and closes above 3,354.88, it invalidates the bearish setup.
Then, the market may shift towards targeting 3,455.76 — about 100 points to the upside.
---
🔧 Technical Factors Supporting the Setup
Supply zone marked by the purple box around the entry.
Trend previously bearish — recent upward move may just be a retracement.
Confluence with MAs: Price is testing MAs — rejection here would add bearish confirmation.
---
✅ Summary of Trade Setup
Element Value
Entry 3,335.03
Stop Loss 3,354.88
Take Profit 3,245.65
Alt Target 3,455.76 (if SL hit)
Risk-Reward ~1:4.5
Bias Bearish (Sell Setup)
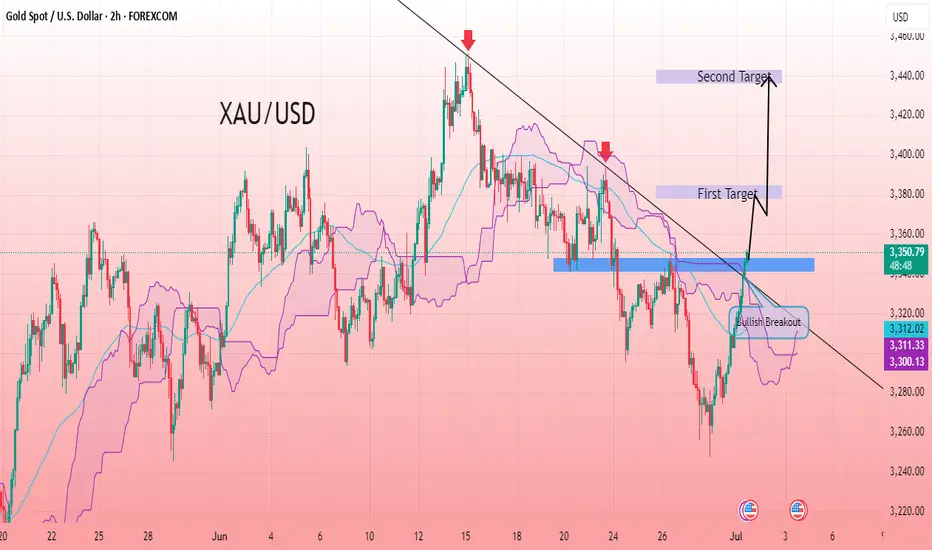
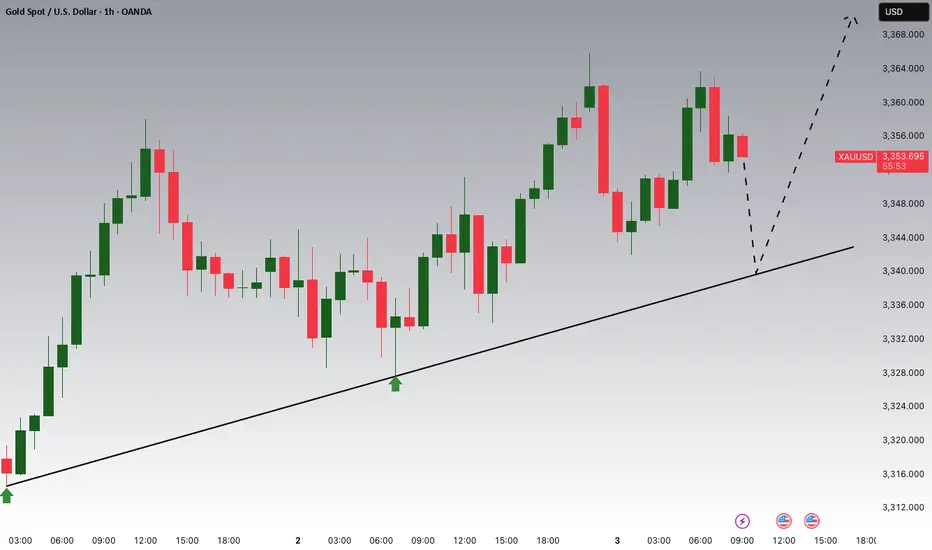
XAU/USD 2H CHART PATTERNXAUUSD 2H chart shows a clear trendline breakout after a period of consolidation, indicating a potential bullish continuation. The breakout occurred with strong momentum, supported by clear higher lows before the break, signaling buyer interest. Price action has closed firmly above the trendline, confirming the breakout structure and suggesting the potential for further upward movement if momentum continues. The breakout zone can now act as a support if price retests before continuation. The structure aligns with a bullish scenario, and the breakout level will be monitored for validation. A clean follow-through move is anticipated as long as the breakout structure holds, providing an opportunity for a controlled and patient approach toward the targets.
Entry 3347
First Target 3381
Second Target 3440
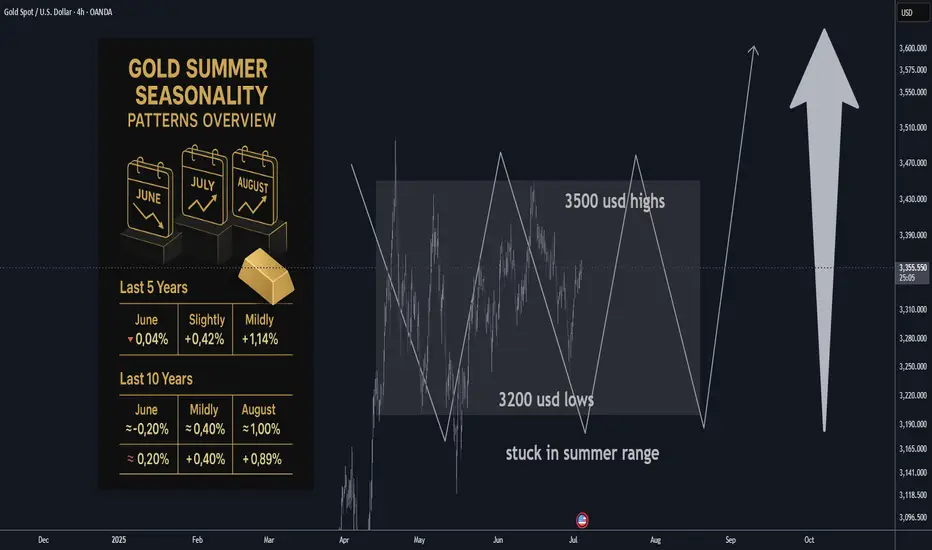
Gold Market Update: Stuck in summer time range / SeasonalityGold is stuck so far last 4-6 weeks in tight range trading conditions
due to summer time seasonality also strong gains previously
expecting range locked conditions in July as well here's an
overview of 5 years and 10 years of seasonality data by month
until at least August expecting dead market conditions it's best
to focus on trading the range or trading with automated algo instead.
Here are the two tables showing month-over-month percent changes in gold prices (London PM fix USD/oz) for June, July, and August:
| Year | June Close | July Close | August Close | June % | July % | August % |
| ---- | ---------: | ---------: | -----------: | -----: | ------: | -------: |
| 2023 | 1,942.90 | 1,951.02 | 1,918.70 | –0.04% | +0.42% | –1.68% |
| 2022 | 1,836.57 | 1,732.74 | 1,764.56 | –5.65% | +1.80% | +1.80% |
| 2021 | 1,834.57 | 1,807.84 | 1,785.28 | –1.47% | –1.48% | –1.22% |
| 2020 | 1,761.04\* | 1,771.65\* | 1,968.16\* | +8.66% | +11.19% | +10.99% |
| 2019 | 1,342.66\* | 1,413.39\* | 1,523.00\* | +5.29% | +7.95% | +7.74% |
| 2018 | 1,270.00\* | 1,230.00\* | 1,194.00\* | –1.09% | –3.15% | –3.02% |
| 2017 | 1,257.00\* | 1,243.00\* | 1,280.00\* | +0.72% | –1.10% | +2.93% |
| 2016 | 1,255.00\* | 1,364.00\* | 1,322.00\* | +3.24% | +8.67% | –3.11% |
| 2015 | 1,180.00\* | 1,172.00\* | 1,116.00\* | –2.06% | –0.68% | –4.69% |
| 2014 | 1,320.00\* | 1,311.00\* | 1,312.00\* | –0.65% | –0.68% | +0.08% |
🔍 Summary Highlights
June has been weak more often than not—negative in 6 of the past 10 years.
July shows modest gains overall—positive in 7 of the last 10.
August is the strongest summer month—positive 6 times out of the past 10, with several double-digit y/y gains (like +10.99% in 2020).
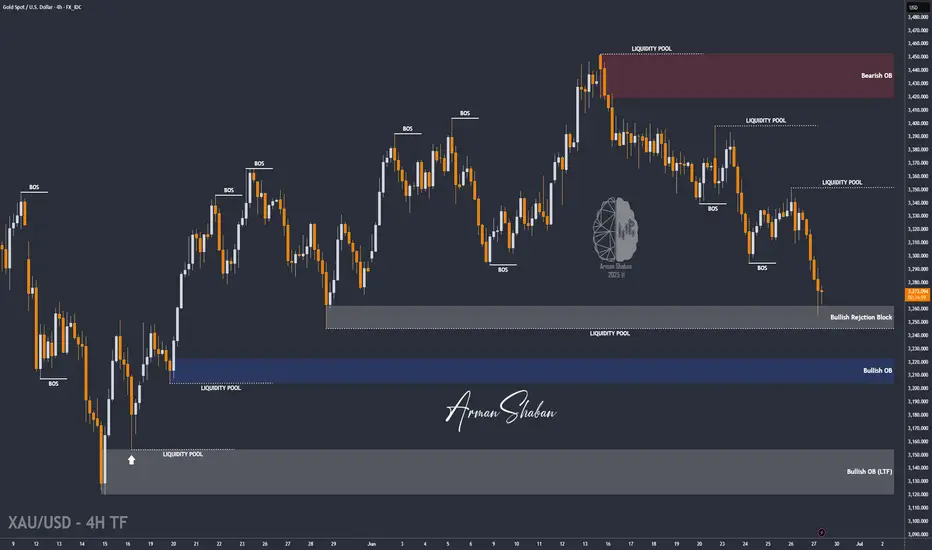
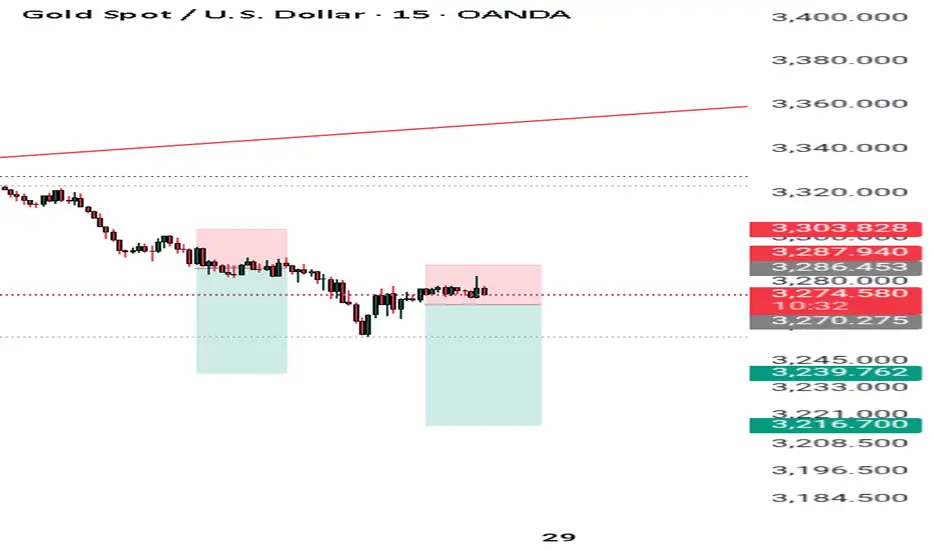
XAUUSD : Ready for More Upside Before Another Fall ?By analyzing the gold chart on the 4-hour timeframe, we can see that price initially followed our bullish scenario, climbing 140 pips up to $3336. However, after hitting that level, gold reversed and entered the bearish scenario, dropping below $3300 and eventually finding support around $3255.
This area acted as a strong demand zone, and we’ve since seen a rebound. Currently, gold is trading around $3273, and as long as price holds above the marked demand zone (Bullish Rejection Block), we may expect another bullish move before price potentially targets the liquidity below $3245 and $3203.
Please support me with your likes and comments to motivate me to share more analysis with you and share your opinion about the possible trend of this chart with me !
Best Regards , Arman Shaban
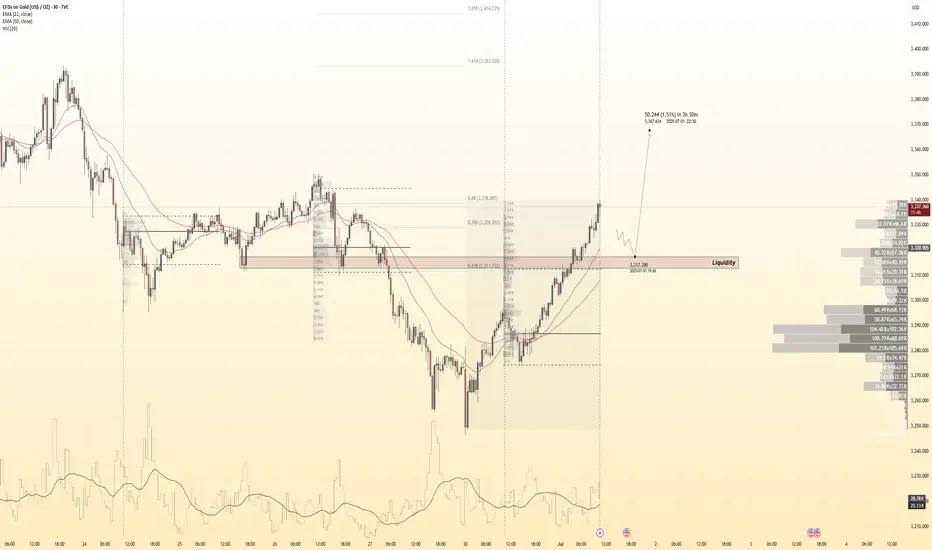
GOLD 30Min Engaged ( Bullish Reversal Entry Detected )➕ Objective: Precision Volume Execution
Time Frame: 30-Minute Warfare
Entry Protocol: Only after volume-verified breakout
🩸 Bullish Reversal : 3318
Volume Poc + Value
➗ Hanzo Protocol: Volume-Tiered Entry Authority
➕ Zone Activated: Dynamic market pressure detected.
The level isn’t just price — it’s a memory of where they moved size.
Volume is rising beneath the surface — not noise, but preparation.
🔥 Tactical Note:
We wait for the energy signature — when volume betrays intention.
The trap gets set. The weak follow. We execute.
Gold 30M Engaged ( Dual Entry's Detected )
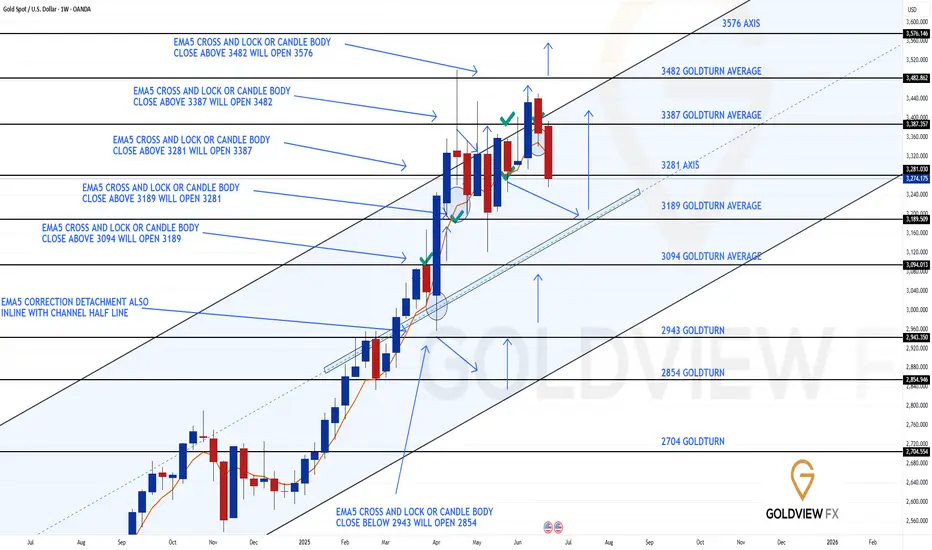
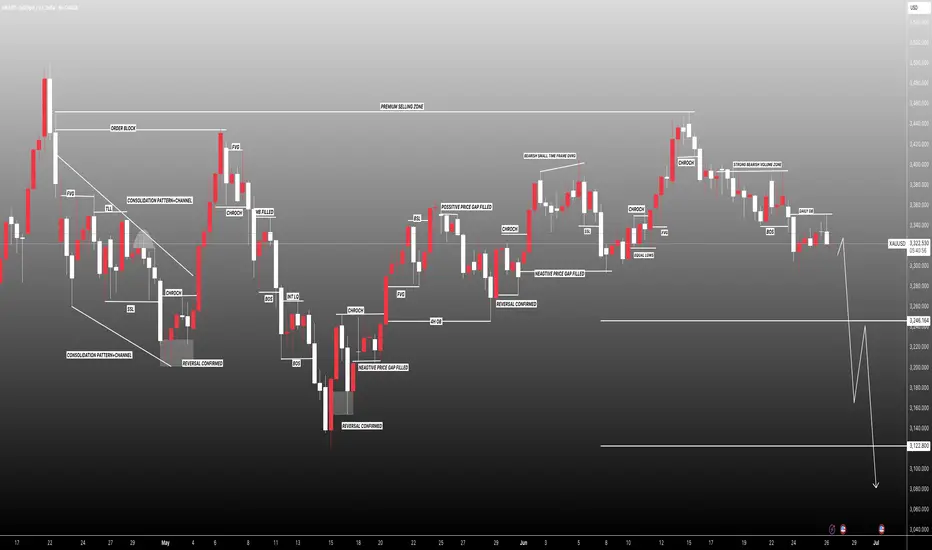
GOLD WEEKLY CHART MID/LONG TERM ROUTE MAPHey Everyone,
Follow up on our Weekly Goldturn channel outlook.
Last week’s action delivered the rejection at the channel top, right in line with expectations. Importantly, we did not get an EMA5 lock confirmation, reinforcing the rejection. We still have the previous weekly candle body close above 3387, leaving the gap at 3482 active and exposed overhead.
The early rejection saw a swift retrace into the 3281 Goldturn axis support, where price is currently attempting to stabilise. This is a pivotal level. From here, we are watching two potential paths unfold:
1. Bounce Scenario: If 3281 holds and buyers step in, we’ll look for a gradual climb within the channel, testing key in between levels. EMA5 cross and lock confirmation will be key for directional bias. A reclaim and continuation higher keeps the 3482 gap firmly in play as a target.
2. Breakdown Scenario: If 3281 gives way, we have a body close gap to the channel mid-line, which becomes the next key level for potential support and Goldturn reaction. A move into this area could offer another structured long opportunity, aligned with the overall bullish framework.
Despite the rejection at the highs, the broader channel structure remains intact, and the longer term outlook still favours a measured move up level by level, using Goldturn levels and EMA5 as our compass.
Key Focus:
Support: 3281 → Channel Half-line (if broken)
Resistance: 3387 → 3482 (gap target)
We remain patient and continue reacting to clean structure backed opportunities.
Mr Gold
GoldViewFX
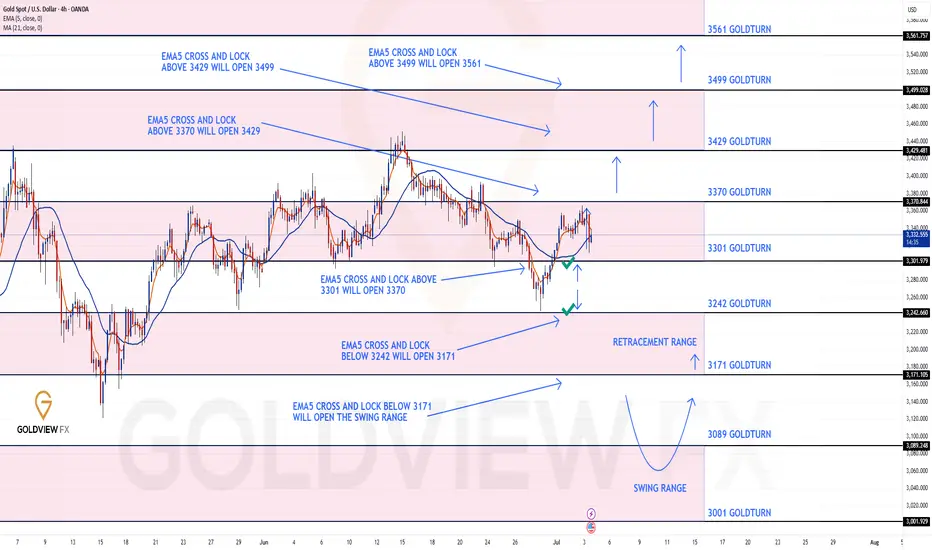
GOLD 4H CHART ROUTE MAP UPDATEHey Everyone,
Please see our 4H chart update, following on from our 1h chart update. Once again, no surprise with our levels playing out to perfection!!
We started the week with both our Bearish 3242 and Bullish 3301 targets hit. This followed with a ema5 cross and lock above 3301 to confirm a continuation into 3370. We got the push up, over 600 pips but just short of the full gap to 3370.
We are now seeing playing between 3301 and 3370, keeping in mind the full gap to 3370 remains open, as long as ema5 remains above 3301.
We will keep the above in mind when taking buys from dips. Our updated levels and weighted levels will allow us to track the movement down and then catch bounces up.
We will continue to buy dips using our support levels taking 20 to 40 pips. As stated before each of our level structures give 20 to 40 pip bounces, which is enough for a nice entry and exit. If you back test the levels we shared every week for the past 24 months, you can see how effectively they were used to trade with or against short/mid term swings and trends.
The swing range give bigger bounces then our weighted levels that's the difference between weighted levels and swing ranges.
BULLISH TARGET
3301 - DONE
EMA5 CROSS AND LOCK ABOVE 3301 WILL OPEN THE FOLLOWING BULLISH TARGETS
3370
EMA5 CROSS AND LOCK ABOVE 3370 WILL OPEN THE FOLLOWING BULLISH TARGET
3429
EMA5 CROSS AND LOCK ABOVE 3429 WILL OPEN THE FOLLOWING BULLISH TARGET
3499
BEARISH TARGETS
3242 - DONE
EMA5 CROSS AND LOCK BELOW 3242 WILL OPEN THE FOLLOWING BEARISH TARGET
3171
EMA5 CROSS AND LOCK BELOW 3171 WILL OPEN THE SWING RANGE
3089
3171
EMA5 CROSS AND LOCK BELOW 3171 WILL OPEN THE SECONDARY SWING RANGE
3089
3001
As always, we will keep you all updated with regular updates throughout the week and how we manage the active ideas and setups. Thank you all for your likes, comments and follows, we really appreciate it!
Mr Gold
GoldViewFX
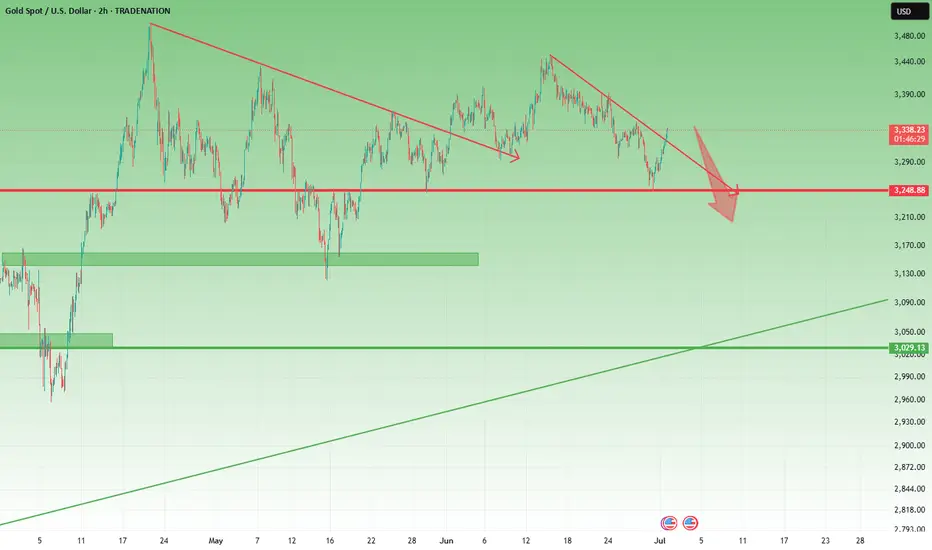
XAUUSD – Correction or Reversal? 1. What happened yesterday
As expected, Gold started to rise after finding support at 3250. The move up played out perfectly, reaching the resistance area highlighted in yesterday’s analysis — around 3320–3340.
________________________________________
2. The key question today
Is this just a correction in a bearish trend, or the start of reversal?
________________________________________
3. Why I remain bearish
• On the weekly chart, structure still leans bearish
• On lower time frames, the bounce looks corrective — not impulsive
• No breakout above 3360 yet, which would be needed to shift the bias
• A move back below 3320 would likely trigger renewed selling
• If that happens, 3250 could be tested again quickly
We need to respect the bounce — but not overreact to it.
________________________________________
4. Trading plan
My bias remains bearish as long as price stays under 3360.
However, if we get a daily close above 3360, I’ll pause and re-evaluate the short bias. The market would then be signaling a potential trend shift.
________________________________________
5. Final thoughts 🚀
This is a key moment for gold. We’re at resistance zone but not broken above yet.
Until proven otherwise, the trend remains down — and rallies into 3340 zone should be considered selling opportunities.
Disclosure: I am part of TradeNation's Influencer program and receive a monthly fee for using their TradingView charts in my analyses and educational articles.
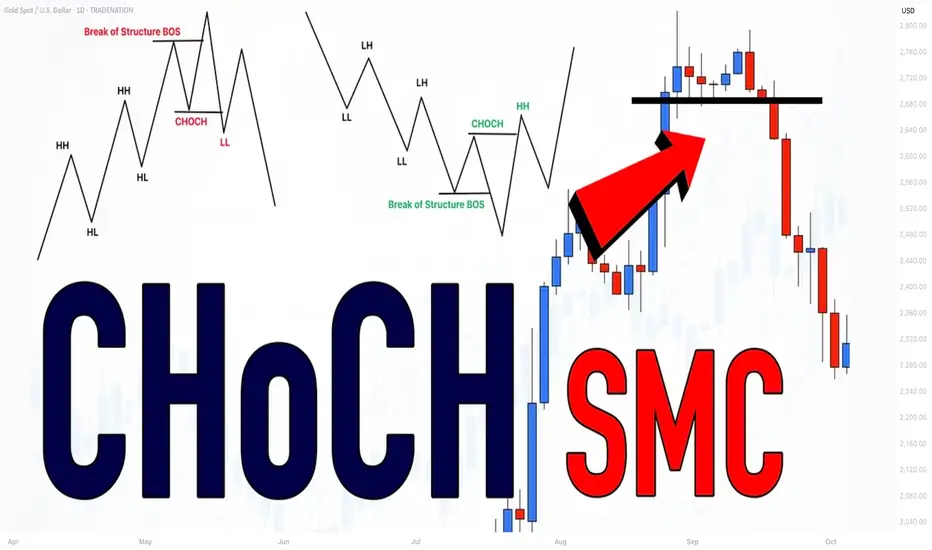
SMC Trading Basics. Change of Character - CHoCH (GOLD FOREX)
In the today's post, we will discuss one of the most crucial concepts in SMC - Change of Character.
Change of Character relates to market trend analysis.
In order to understand its meaning properly, first, we will discuss how Smart Money traders execute trend analysis.
🔘Smart Money Traders apply price action for the identification of the direction of the market.
They believe that the trend is bullish ,
if the price forms at least 2 bullish impulse with 2 consequent higher highs and a higher low between them.
The market trend is considered to be bearish ,
if the market forms at least 2 bearish impulses with 2 consequent lower lows and a lower high between them.
Here is how the trend analysis looks in practice.
One perceives the price action as the set of impulse and retracement legs.
According to the rules described above, USDCAD is trading in a bullish trend because the pair set 2 higher lows and 2 higher highs.
🔘Of course, trends do not last forever.
A skill of the identification of the market reversal is a key to substantial profits in trading.
Change of Character will help you quite accurately identify a bullish and bearish trend violation.
📉In a bearish trend, the main focus is the level of the last lower high.
While the market is trading below or on that, the trend remains bearish .
However, its bullish violation is a very important bullish signal,
it is called a Change of Character, and it signifies a confirmed violation of a bearish trend.
In a bearish trend, CHoCH is a very powerful bullish pattern.
Take a look, how accurate CHoCH indicated the trend reversal on Gold.
After a massive selloff, a bullish breakout of the level of the last lower high confirmed the initiation of a strong bullish wave.
📈In a bullish trend, the main point of interest is the level of the last higher low. While the price is trading above that or on that, the trend remains bullish.
A bearish violation of the last higher low level signifies the violation of a current bullish trend. It is called a Change of Character, and it is a very accurate bearish pattern.
Take a look at the example on Dollar Index below.
In a bullish trend, bearish violation of the last higher low level
quite accurately predicted a coming bearish reversal.
Change of Character is one of the simplest , yet accurate SMC patterns that you should know.
First, learn to properly execute the price action analysis and identify HH, HL, LL, LH and then CHoCH will be your main tool for the identification of the trend reversal.
❤️Please, support my work with like, thank you!❤️
I am part of Trade Nation's Influencer program and receive a monthly fee for using their TradingView charts in my analysis.
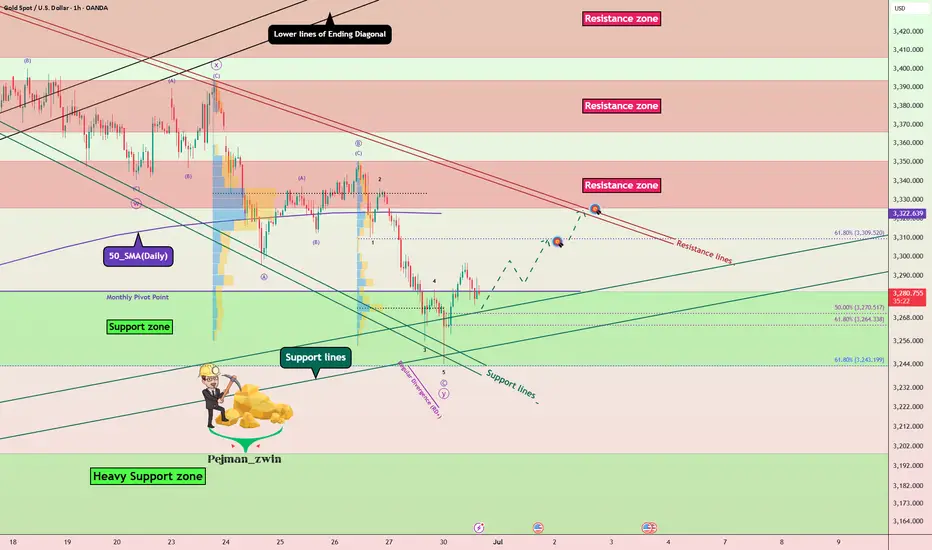
Gold Rebound Underway – Support Zone Holds Strong! - Short termGold( OANDA:XAUUSD ), as I anticipated in the previous idea , has attacked the Support zone($3,281-$3,243) and Support lines .
From an Elliott Wave theory perspective , it appears that Gold has completed 5 sub-waves of the main wave C .
Also, we can see the Regular Divergence(RD+) between Consecutive Valleys.
I expect Gold to rise to at least $3,307 in the coming hours.
Second Target: $3,321
Note: Stop Loss (SL) = $3,240
Gold Analyze (XAUUSD), 1-hour time frame.
Be sure to follow the updated ideas.
Do not forget to put a Stop loss for your positions (For every position you want to open).
Please follow your strategy; this is just my idea, and I will gladly see your ideas in this post.
Please do not forget the ✅ ' like ' ✅ button 🙏😊 & Share it with your friends; thanks, and Trade safe.
Gold is Nearing an Important Support AreaHey Traders, in today's trading session we are monitoring XAUUSD for a buying opportunity around 3,340 zone, Gold is trading in an uptrend and currently is in a correction phase in which it is approaching the trend at 3,340 support and resistance area.
Trade safe, Joe.
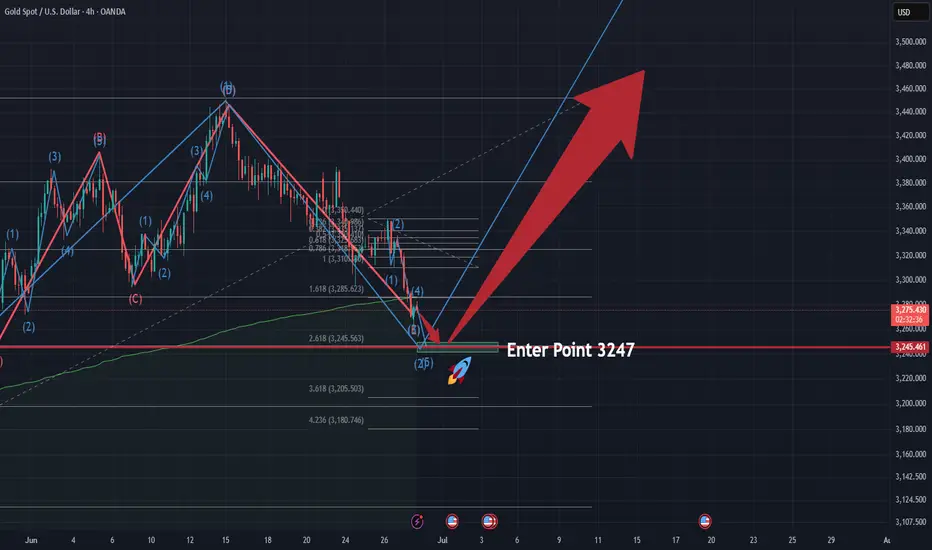
XAUUSD Long Setup – Watching 3247 Entry ZoneHi Traders,
The recent price action of XAUUSD has been a bit complex, but I hope this idea turns out to be profitable for everyone.
Feel free to share your thoughts if you see anything differently.
What I find most interesting is the entry zone around 3247–3245 . If we take the wave count starting from May 15, 2025 (3120.76) and consider wave 5 to be completed on June 15, 2025 (3451.52), then wave 2 should ideally retrace to around 3247.
On top of that, wave C of wave 2 seems to follow a clean 1–2–3–4–5 structure. If we treat the current move as a downtrend, wave 5 would likely complete right at 3247, which I find both accurate and technically compelling.
I'll be watching 3247 closely and plan to go long from there.
#XAUUSD:First Buy, Then Sell Swing! Big Move In Making! Gold failed to decline further as previously predicted in our analysis. Instead, it continues to exhibit bullish sentiment. The current price trading in a critical region between 3350 and 3360, where significant resistance is observed. We anticipate that the price must pass through this region before it can clearly surpass the 3400 mark.
When this occurs, it is advisable to implement precise risk management strategies while trading gold due to its volatile nature. Additionally, the DXY index is experiencing a decline and currently trading at its all-time low since 1976. This development will likely have a substantial impact on the gold price.
We wish you the best of luck and ensure safe trading practices.
Kindly consider liking, commenting, and sharing this idea.
Team Setupsfx_
❤️🚀
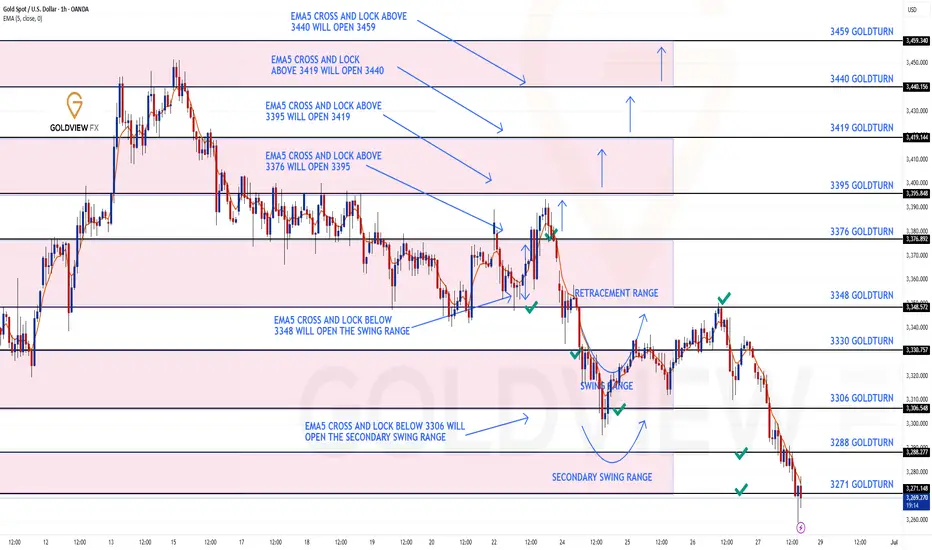
GOLD ROUTE MAP UPDATEHey Everyone,
A fantastic close to the week as our analysis once again played out level to level with precision!
As a follow-up from yesterday's post:
- The swing range completed the move into 3348, as expected.
- However, we had no further EMA5 lock above, confirming rejection back into the swing range.
- This was followed by an EMA5 cross and lock below 3306, opening the secondary swing range.
- That range played out perfectly today, hitting both 3288 and 3271 targets.
We’re now seeing a bounce off those levels giving the 20 to 40 pips, and we will now be observing to see if the full secondary swing is completed.
It's Friday, and it's been a PIPTASTIC week across the board. Well done to everyone following the plan and sticking to the levels.
QUICK RECAP
BULLISH TARGET
3376 - DONE
BEARISH TARGETS
3348 - DONE
EMA5 CROSS AND LOCK BELOW 3348 WILL OPEN THE SWING RANGE
3330 - DONE
3306 - DONE
EMA5 CROSS AND LOCK BELOW 3306 WILL OPEN THE SECONDARY SWING RANGE
3288 - DONE
3271 - DONE
We’ll be back now on Sunday with our multi-timeframe analysis and trading plans for the week ahead. Thanks again for all your likes, comments, and follows.
Wishing you all a fantastic weekend!!
Mr Gold
GoldViewFX
#XAUUSD(GOLD)): 29/06/2025 Last Analysis Going Great!Gold has been moving nicely since our last analysis, which we posted. Currently, 750+ pips have been generated, and we expect further price drops. There are still two targets in place, as per our previous analysis. We anticipate a steady decline in the price. We recommend all of you to follow strict risk management. This is not a guaranteed analysis or view, but rather an overview/educational chart analysis.
If you want to support us, you can do the following:
- Like
- Comment
- Share
Team Setupsfx_
XAUUSD: We must adapt to the market conditions! Bears in ChargeGold prices dropped as Trump announced a ceasefire between Iran and Israel, causing a significant decline. We anticipate this trend to persist, as recent price data, including volume and price momentum, indicates a strong seller’s control in the current market conditions. We have two targets for you to set your own based on your analysis, along with a stop-loss based on your strategy.
We appreciate your unwavering support throughout the years. Please like and comment.
Team Setupsfx_
❤️🚀
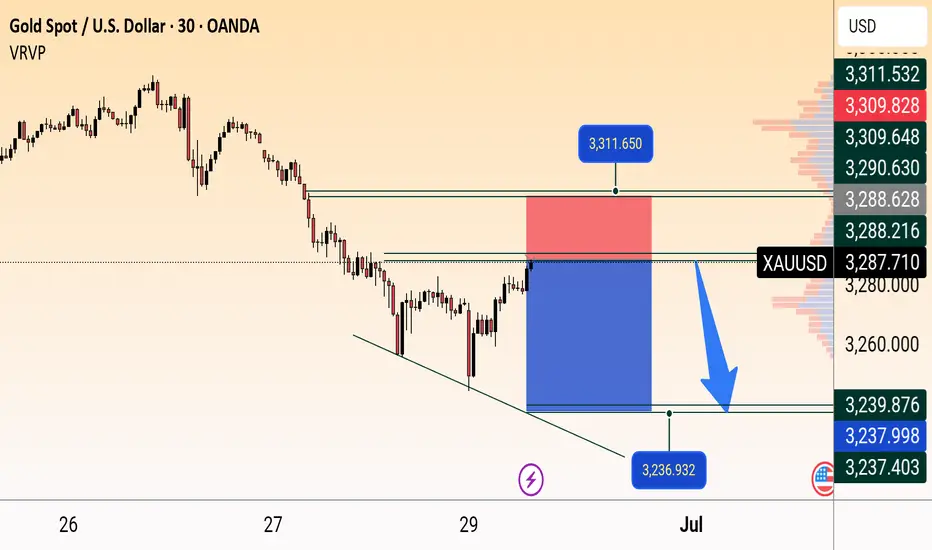
XAU/USD Bearish Rejection Setup Below Resistance ZoneXAU/USD (Gold) is forming a bearish setup on the 30-minute chart. Price is testing a resistance near 3288, with a potential reversal towards the 3236 level. Entry is marked around current price, with a stop loss at 3311 and take profit near 3237, supported by a descending channel.
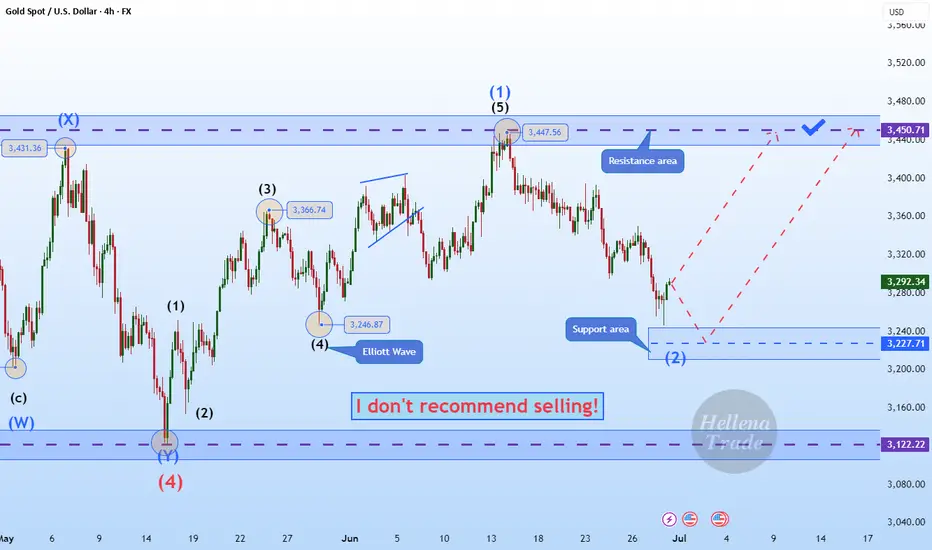
Hellena | GOLD (4H): LONG to resistance area of 3450 (Wave 3).Colleagues, it seems that the correction turned out to be a little deeper than I thought. This means that wave “1” of the middle order has been formed and now correction wave “2” is ending. I still expect an upward movement.
I believe that the maximum of wave “1” — the resistance area of 3450 — will be reached within wave “3”.
Manage your capital correctly and competently! Only enter trades based on reliable patterns!
XAUUSD STOP HUNT PROOFa proven risk management psychology......i knew whats on the way ....price must go down .....i need friends ...lets connect and scale up to the moon
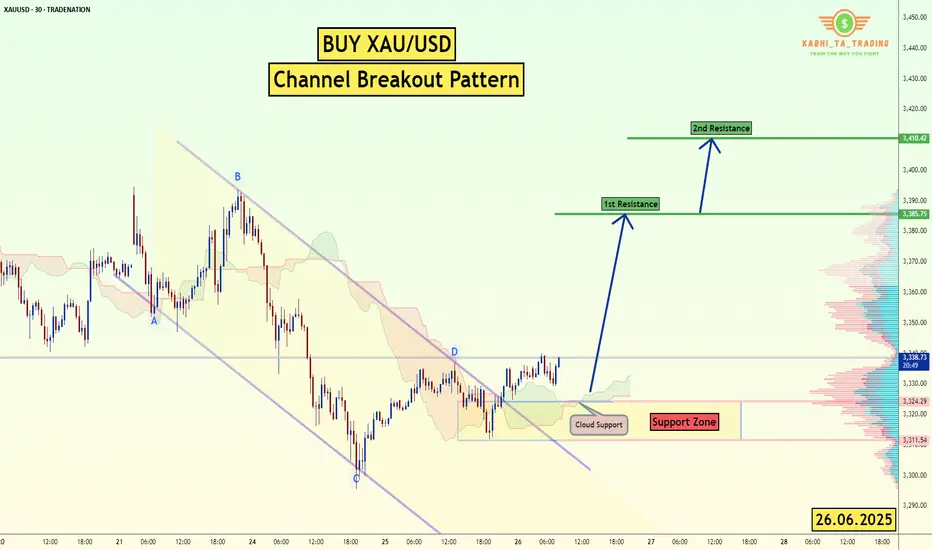
XAU/USD - Channel Breakout (26.06.2025)The XAU/USD pair on the M30 timeframe presents a Potential Buying Opportunity due to a recent Formation of a Channel Breakout Pattern. This suggests a shift in momentum towards the upside and a higher likelihood of further advances in the coming hours.
Possible Long Trade:
Entry: Consider Entering A Long Position around Trendline Of The Pattern.
Target Levels:
1st Resistance – 3385
2nd Resistance – 3410
🎁 Please hit the like button and
🎁 Leave a comment to support for My Post !
Your likes and comments are incredibly motivating and will encourage me to share more analysis with you.
Best Regards, KABHI_TA_TRADING
Thank you.
Disclosure: I am part of Trade Nation's Influencer program and receive a monthly fee for using their TradingView charts in my analysis.
HelenP. I Gold may retest resistance before dropping to $3230Hi folks today I'm prepared for you Gold analytics. If we look at the chart, we can see that after a period of sideways consolidation, gold started to form lower highs under a descending trend line. Each time the price approached this trend line, it was rejected, confirming strong bearish pressure. Most recently, XAUUSD broke below the support-turned-resistance level around 3295, entering the lower resistance zone. Now, the price is trading just under this area, which has acted as a strong supply zone in the past. Given the current technical setup, I expect that gold may show a minor upward move to retest the resistance zone between 3285 - 3295. However, this retest is likely to act as a trigger for sellers to step back in. The prevailing downtrend and repeated failures to break the trend line suggest further weakness ahead. That’s why I’ve placed my target at 3230 points - a level that aligns with the next major support on the chart. This area could provide the next bounce opportunity, but for now, the bearish structure remains dominant. If you like my analytics you may support me with your like/comment ❤️
Disclaimer: As part of ThinkMarkets’ Influencer Program, I am sponsored to share and publish their charts in my analysis.
