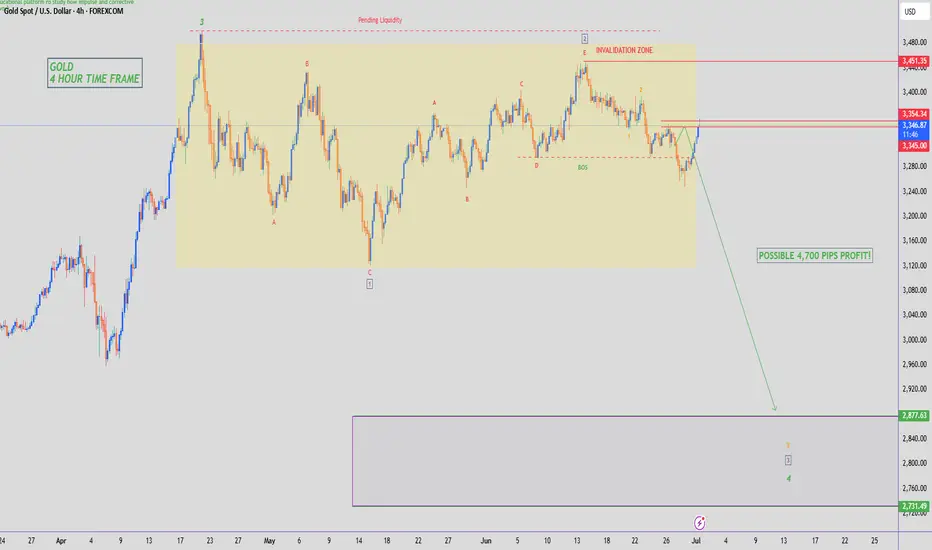
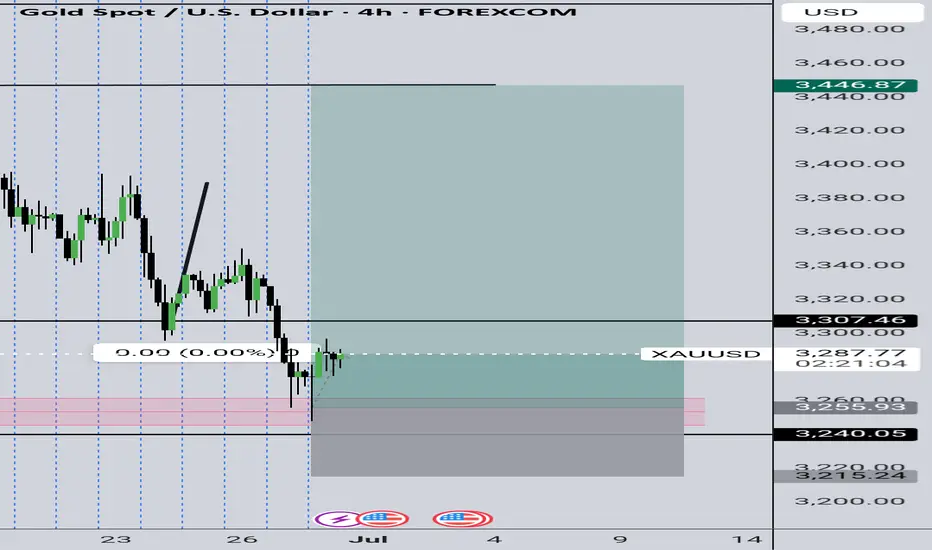
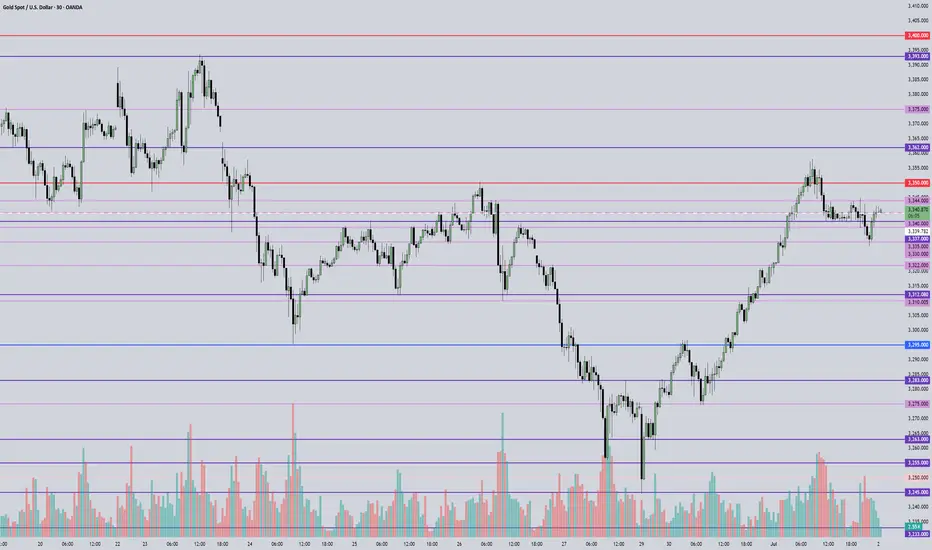
GOLD - SHORT TO $2,800 (UPDATE)We've seen s sharp move back up overnight which is no surprise considering we are at the start of a new month & quarter. Markets will be spiking to both sides for monthly liquidity, before moving in the direction of the trend.
We're still holding below our yellow support zone & below 'Minor Wave 2'. If this continues to hold, then it'll be a good sign for sellers.
XAUUSD.F trade ideas
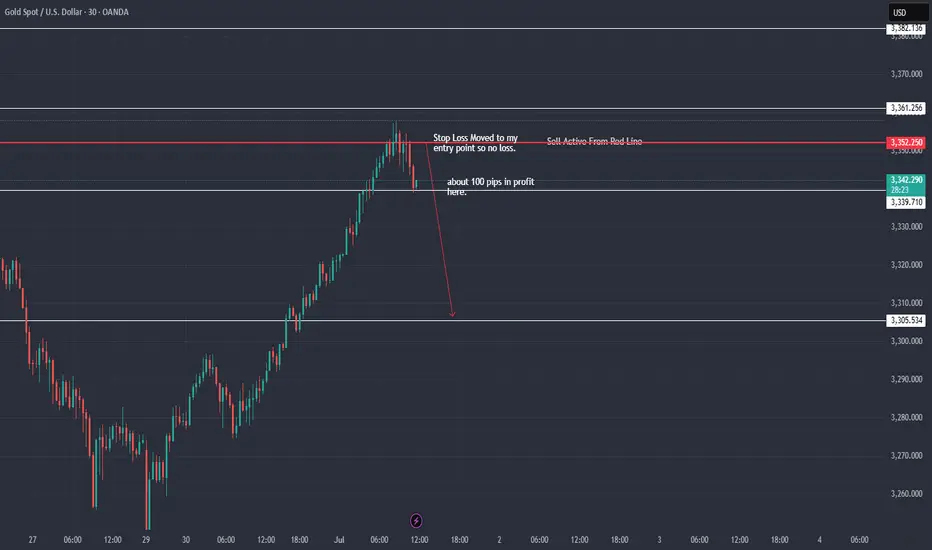
XAU / USD 30 Minute Chart Hello traders. All I can say is KABOOM. 100 pips in profit on this microlot sell trade. I am, as of this writing closing 75% of the trade's profit, moving my stop loss to my entry point (break even) and leaving a runner ( the remaining 25% of the trade) running. What a day. Big G gets all my thanks. Be well and trade the trend. I am very thankful that my analysis was pretty spot on.
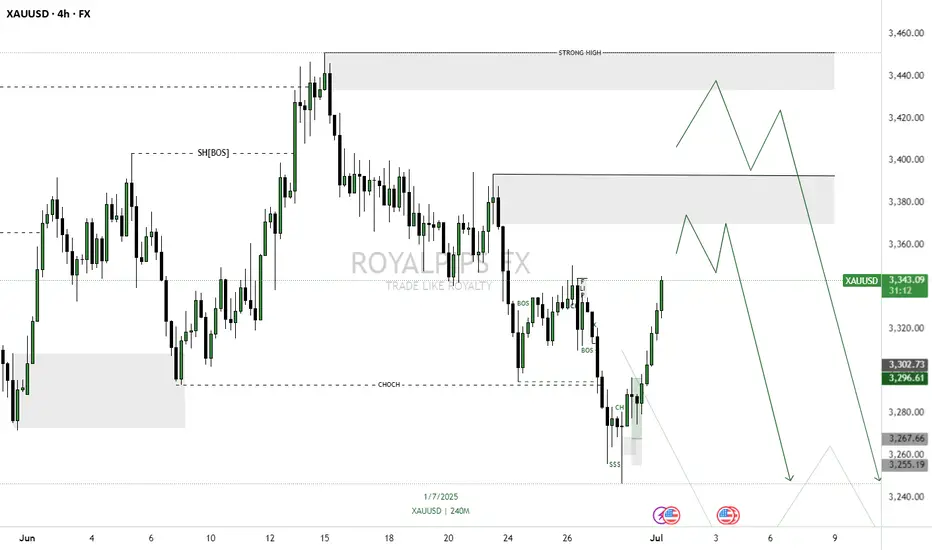
XAUUSD GOING SHORTGOLD has recently broken its last low, shifting market structure (CHOCH) and indicating sellers are currently in control. This break opened up 2 clear Supply Zone above — a small base or last bullish candle before the drop — which is a key area where unfulfilled sell orders may be resting.
Price is likely to retrace back into these Supply Zone to fill those orders. Once it reaches this area, we expect selling pressure to resume and push price downward, honoring the imbalance left by the drop.
Entry:
I’m looking to sell from this Supply Zone on a pullback,
This lets me enter at a premium price while trading in direction of the newly established downward momentum.
Target:
The first Target Profit (TP) is set at the next Demand Zone below, where buying pressure might emerge. This Demand Zone is a key area to watch for a reversal or a temporary halt in downward momentum.
Stop Loss:
To control risk, the Stop Loss (SL) is placed just above the Supply Zone.
If price climbs above this area, it would invalidate the Supply’s ability to hold, signalling a potential reversal.
✅ Summary:
• Market has shifted to bearish after breaking last low.
• Supply Zone above is a key area to watch for selling opportunities.
• Sell upon retracement into Supply, with Stop Loss above and Target at Demand below.
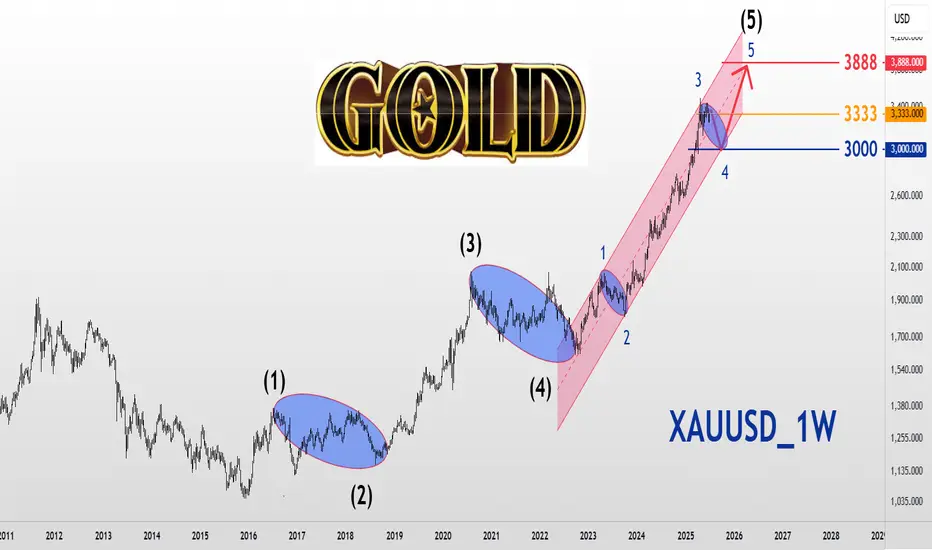
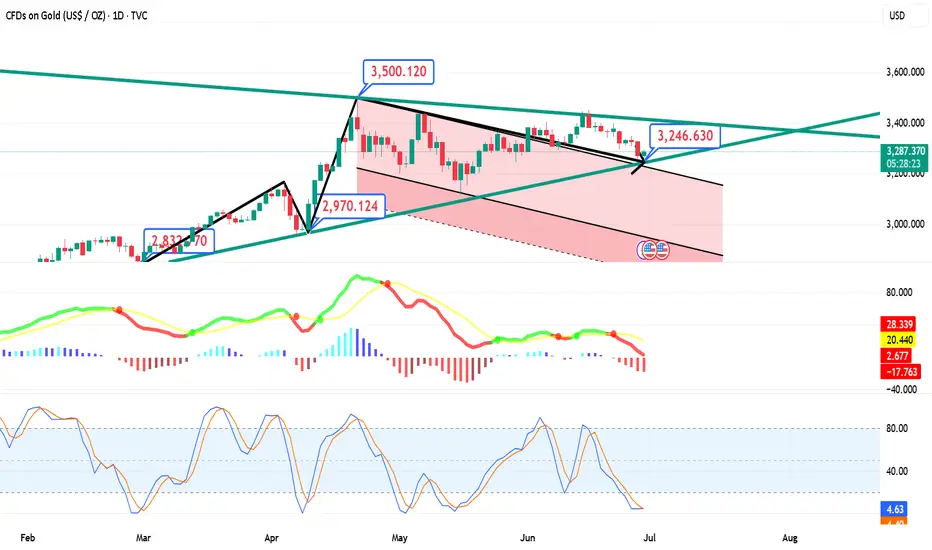
XAUUSD_1WWorld Gold Analysis
Long -term frame time
Eliot wave analysis style
The market is in five waves of climbing and we are expected to be in the 4th wave, with the main and important number being $ 3333, and if the price is maintained as a resistance, it will continue to reform and move to $ 3000, which can be modified for up to 3 months and enters the next wave on October 5, 2025. As a wave 5 and move toward $ 3888.
The original number $ 3333!
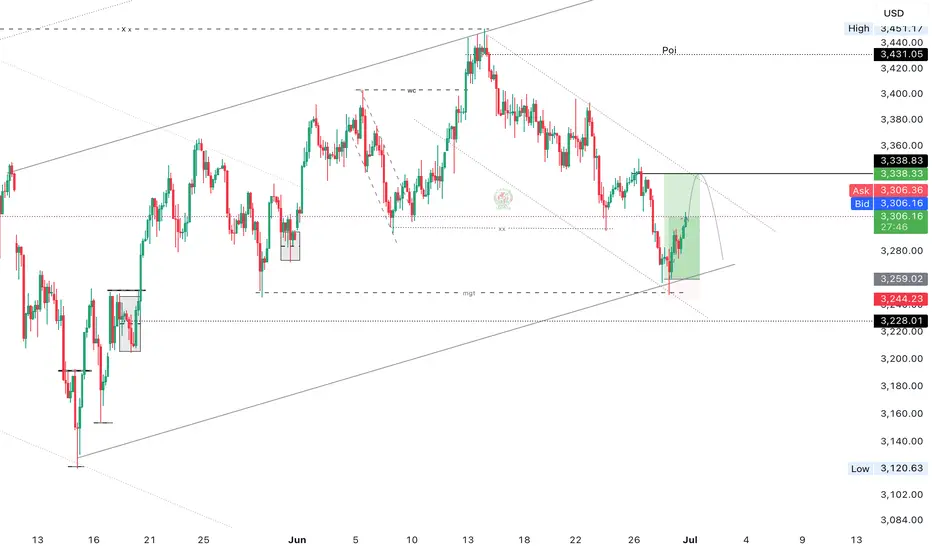
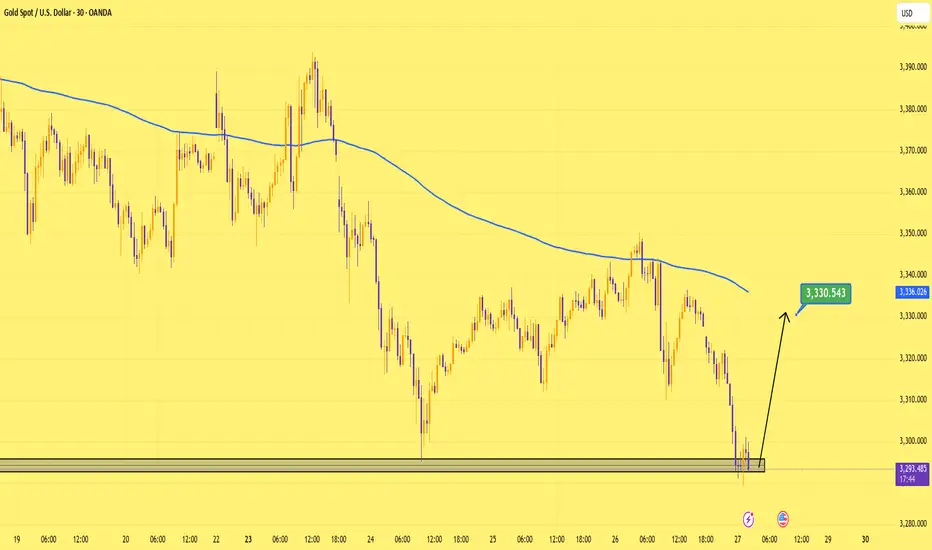
Gold Opens Final June Session with Bullish IntentGold market opens the last day of June exploring a bullish buildup through the 3270's, aiming for a projection toward the 3330's. Momentum aligns with a potential breakout if demand continues to hold. follow for more insights , comment and boost idea
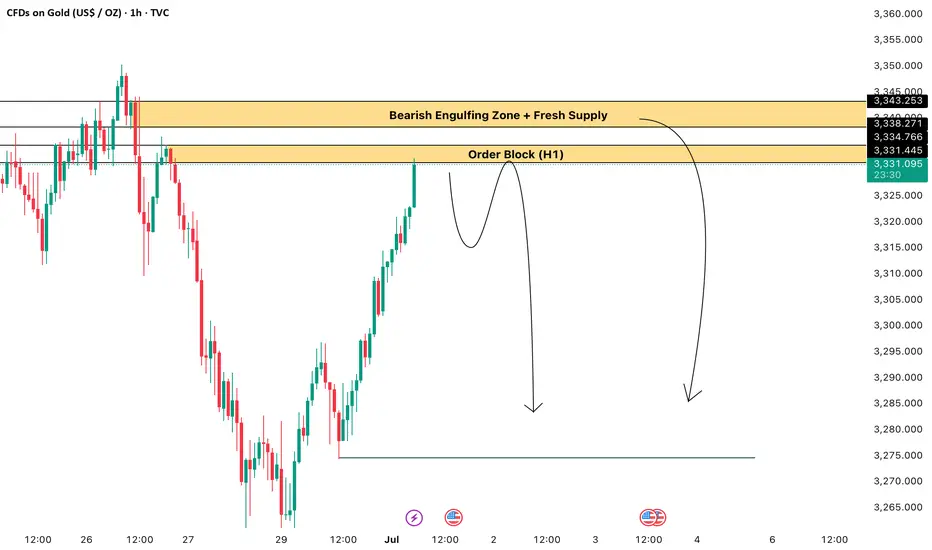
GOLD SHORT TRADE IDEA ! Gold Looking For Sell On Order Block Zone 3331/3334 Target Will Be 3300
Gold Sell Second Zone Bearish Engulfing + Fresh Supply Target Will Be 3275
Gold Sell First Zone OB H1 (3331/3335
Stoploss - 3345
Tp Levels - 3325,3320,3310,3300
Gold Sell Second Zone Bearish EG + Fresh Supply (3338/3344)
Stoploss - 3350
TP levels : 3330; 3322; 3314; 3330, 3290
XAUUSD Market Maker Playbook – Learn How the Game Is Rigged🎓 XAUUSD Market Maker Playbook – Learn How the Game Is Rigged
Traders—if you think this market is some pure, fair supply/demand mechanism, you’re getting played.
Market makers run sophisticated pump and dump cycles designed to trap you.
Today, I’m going to break down exactly how they do it, so you can start trading like a sniper, not a sheep.
🔍 Understanding the 3 Manipulation Zones
🟢 GREEN ZONE: Accumulation Range (3286–3300)
Purpose:
Market makers quietly build positions.
They create an illusion of neutrality—small candles, tight ranges.
Signs:
Repeated tests of the same level.
Volume stays steady (not exploding).
Wicks in both directions (so nobody knows who’s in control).
🟡 YELLOW ZONE: The Pump Phase (3300–3330)
Purpose:
Trigger breakout traders.
Induce FOMO buying.
Clear out short stops above the range.
Signs:
Quick impulsive candles with LOW RELATIVE VOLUME.
Price blows through resistance but struggles to hold.
Social media and news start calling “Bull Run.”
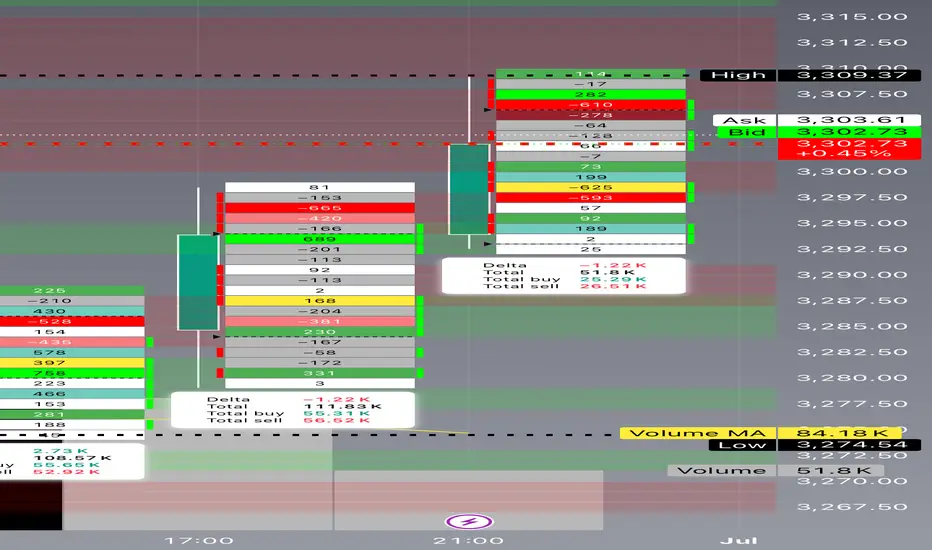
🔴 RED ZONE: Distribution & Dump (3330–3350)
Purpose:
Offload large positions into retail buying.
Leave traders trapped at the highs.
Signs:
Spikes of huge volume as price stalls.
Rejection candles (long upper wicks).
Big delta shifts negative (sellers hitting bids hard).
⚔️ How the Market Maker Sequence Works
Here’s how the trap gets set:
1️⃣ Accumulate in Green Zone
Build inventory while convincing everyone “nothing is happening.”
2️⃣ Pump into Yellow Zone
Push price up just enough to trigger momentum traders.
Keep volume deceptively low—so it looks sustainable.
3️⃣ Sell in the Red Zone
Dump big positions into the buying frenzy.
Flip the tape bearish—fast.
Watch as the herd gets stopped out or bag-held.
🎯 Tomorrow’s Possible Plays
✅ Scenario 1 – Classic Pump & Dump
Phase 1: Grind in 3286–3300.
Phase 2: Spike to 3335.
Phase 3: Dump back to 3260.
✅ Scenario 2 – Fake Breakdown Reversal
Phase 1: Slam price to 3250, triggering panic selling.
Phase 2: Accumulate aggressively.
Phase 3: Rip price back to 3320, trapping shorts.
✅ Scenario 3 – Slow Grind Liquidation
Phase 1: Drift up in low volume toward 3330.
Phase 2: Distribute over several hours.
Phase 3: Liquidate longs into NY close.
📚 How YOU Can Spot This Manipulation
Here’s your checklist—save this:
✅ Volume vs. Price Analysis
Big price moves WITHOUT proportionate volume = FAKEOUT.
Big volume at tops/bottoms = Institutional distribution or accumulation.
✅ Delta Confirmation
Positive delta = buyers aggressive.
Negative delta = sellers slamming bids.
Watch for divergence (price up but delta down = hidden selling).
✅ Candlestick Clues
Rejection wicks.
Engulfing candles at key zones.
Multiple failures to break past a level.
✅ Timing
London open and NY open are prime manipulation hours.
Thin liquidity in Asia can exaggerate moves.
💡 Pro Tip:
“The crowd chases price. The professionals track volume, delta, and timing.”
— Technical Analysis and Stock Market Profits
🚀 Stay sharp. Think like a market maker. Trade like a predator.
#XAUUSD #MarketMakerEducation #ForexTrading #PriceAction #LearnT
Gold Buy , Target 3440Buy gold From Current level , Risk only 1% of your capital ,
Book 50% after 50 pips
Gold's rally has not reversed yet? The consolidation pattern hasTechnicals:
Short-term risks remain skewed to the downside as the momentum of the relative strength index (RSI) and the moving average convergence divergence indicator (MACD) weakens. The RSI hit a new low below the neutral 50 mark. If short pressure intensifies in the next few trading days, gold prices may retest the upper track of the previous falling channel at 3215, followed by the rising support line from October 2024 at 3150. If it falls below this level, the decline may accelerate towards the psychological level of 3000, or even lower to 2970.
On the upside, if a strong catalyst pushes gold to rebound above the 20-day and 50-day moving averages (currently 3320-3350), the next resistance level may appear in the 3400-3435 range. A decisive close above this boundary may pave the way for gold prices to move towards 3500, or test resistance near 3530, and then may target the 3600 level.
Overall, despite the weakening technical indicators, gold has not completely lost its bullish reversal potential. As long as the price remains within the sideways structure above 3150, the downward pressure may still give rise to a "buy on dips" strategy.
Gold at 3330… I’ll take that bet.Price tapped into demand with multiple rejections.
Targeting 3,330. Clean setup, clear risk. Let’s see if the bulls got something left.
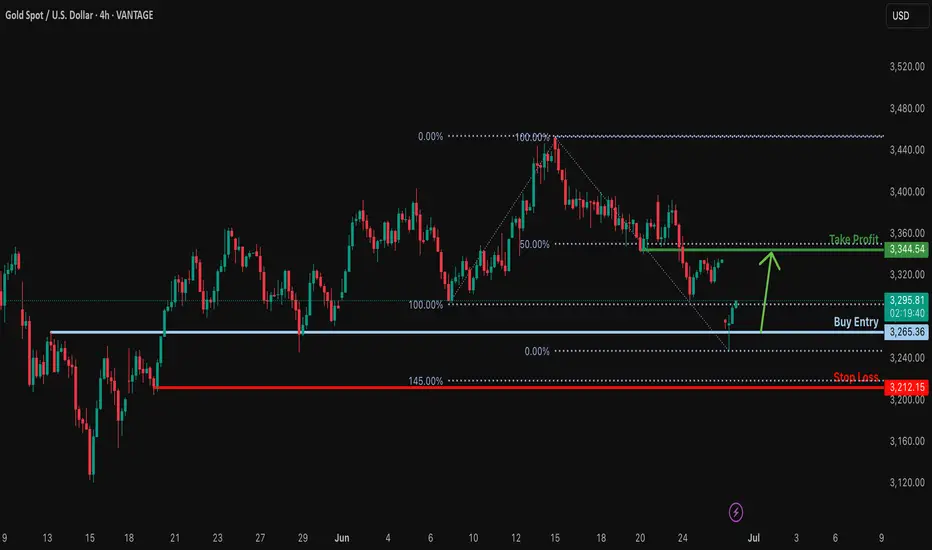
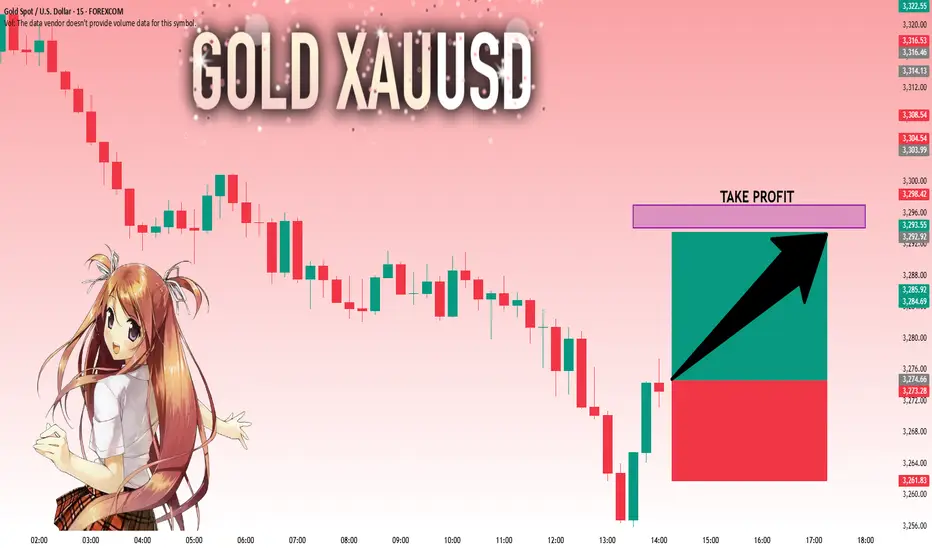
Bullish bounce off major support?XAU/USD has bounced off the support level which is an overlap support and could rise from this level to our take profit.
Entry: 3,265.39
Why we like it:
There is an overlap support level.
Stop loss: 3,121.15
Why we like it:
There is a pullback support level that aligns with the 145% Fibonacci extension.
Take profit: 3,344.54
Why we like it:
There is a pullback resistance that lines up with the 50% Fibonacci retracement.
Enjoying your TradingView experience? Review us!
Please be advised that the information presented on TradingView is provided to Vantage (‘Vantage Global Limited’, ‘we’) by a third-party provider (‘Everest Fortune Group’). Please be reminded that you are solely responsible for the trading decisions on your account. There is a very high degree of risk involved in trading. Any information and/or content is intended entirely for research, educational and informational purposes only and does not constitute investment or consultation advice or investment strategy. The information is not tailored to the investment needs of any specific person and therefore does not involve a consideration of any of the investment objectives, financial situation or needs of any viewer that may receive it. Kindly also note that past performance is not a reliable indicator of future results. Actual results may differ materially from those anticipated in forward-looking or past performance statements. We assume no liability as to the accuracy or completeness of any of the information and/or content provided herein and the Company cannot be held responsible for any omission, mistake nor for any loss or damage including without limitation to any loss of profit which may arise from reliance on any information supplied by Everest Fortune Group.
Gold: Market analysis and strategy for June 27Gold technical analysis
Daily chart resistance level 3350, support level 3250
4-hour chart resistance level 3340, support level 3245
1-hour chart resistance level 3300, support level 3280
Technical indicators show that the 4-hour moving average system shows a dead cross arrangement, and the MACD indicator dead cross continues. The gold price has fallen below the lower track support of the Bollinger Band, and the Bollinger Channel is narrowing. The short-term price is in a low-level weak consolidation pattern.
The 1-hour chart price broke the previous low of 3295, but the price is oversold and may rebound in the short term. The short-term support level below is around 3280. If it falls below, continue to look at the 3271-3245 range; the important pressure level is around 3300!
If there is a short-term rebound before the NY market, wait until the rebound before continuing to sell! The current minimum is 3279. After the short-term stabilization, refer to the resistance of 3300/3310 to sell.
Sell: 3300near
Sell: 3310near

GOLD: Will Go Up! Long!
My dear friends,
Today we will analyse GOLD together☺️
The in-trend continuation seems likely as the current long-term trend appears to be strong, and price is holding above a key level of 3,274.66 So a bullish continuation seems plausible, targeting the next high. We should enter on confirmation, and place a stop-loss beyond the recent swing level.
❤️Sending you lots of Love and Hugs❤️
How to grasp the key entry opportunity in the gold market?The market is changing rapidly, and going with the trend is the kingly way. When the trend comes, just do it. Don't buy at the bottom against the trend, so as not to suffer. Remember not to act on impulse when trading. The market is good at dealing with all kinds of dissatisfaction, so you must not hold on to orders. I believe many people have experienced this deeply. The more you resist, the more panic you will feel, and your floating losses will continue to magnify. You will not be able to eat or sleep well, and you will miss many opportunities in vain. If you also have these troubles, then you might as well keep up with my pace and try to see if it can make you suddenly enlightened.
The non-agricultural data was unexpectedly cold, with a large negative impact. The stochastic indicator in the daily chart formed a golden cross, which was a main multi-signal. The BOLL range shrank, and the range shrank to 3418-3280. This range is the main range. The price pierced up and down the central axis and hovered, waiting for the news data to stimulate. The upper track of the 4-hour Bollinger band is at $3380, and the integer mark of $3400 is also near the high point of gold prices last week. The 5-day moving average and the MACD indicator cross upward, and the KDJ and RSI indicators cross upward. In the short-term technical aspect, gold has a trend of further rebound. At present, the upper resistance is at 3360-3365, and the support position is around 3310-3300.
Gold operation strategy: It is recommended to go long near 3312-3315, with a target of 3330-3340. It is recommended to go short once it touches 3340 for the first time, with a target of 3320-3310.
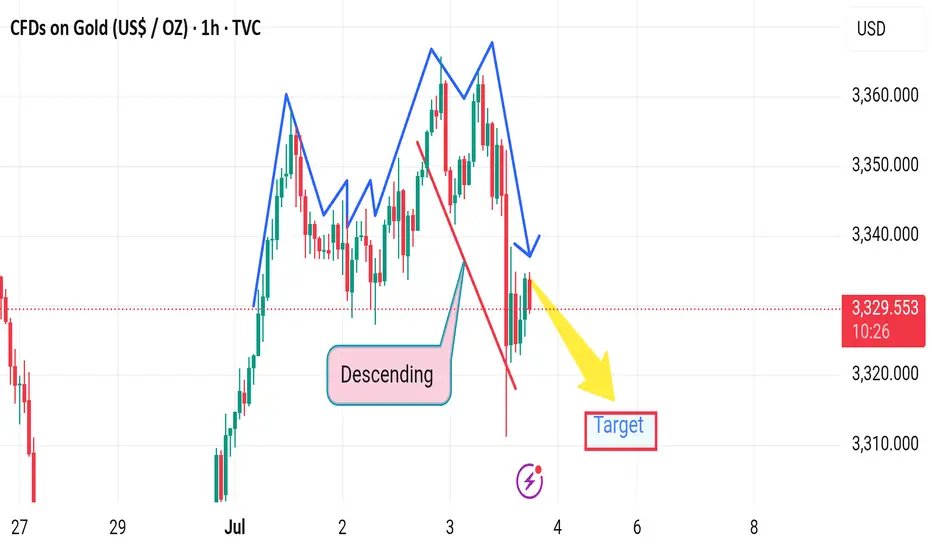
Market next target ⚠️ Disruption Analysis – Gold (1H):
🔹 Pattern Disruption Identified:
The chart previously followed a descending structure with lower highs and lower lows, confirming bearish momentum.
However, a temporary recovery (small bullish correction) appears after a sharp drop, disrupting the previous flow.
---
🔄 Disruption Points:
1. Break in Momentum (Structure Shift):
The recent bullish correction (small upward leg) challenges the consistency of the descending trend.
It signals a potential pause or trap in the current bearish move.
2. Price Rejection Area:
Price attempted to bounce but failed to break above the previous lower high, indicating bearish strength remains intact, but is facing disruption from short-term buyers.
3. Volatility Spike:
The long wick on the recent candle shows a volatility disruption, likely due to economic news or high-impact events (suggested by the ⚡ icon on the chart).
4. Target Zone Disruption:
Though the yellow arrow points toward a bearish target, the slight upward pullback adds uncertainty about whether price will reach that level immediately.
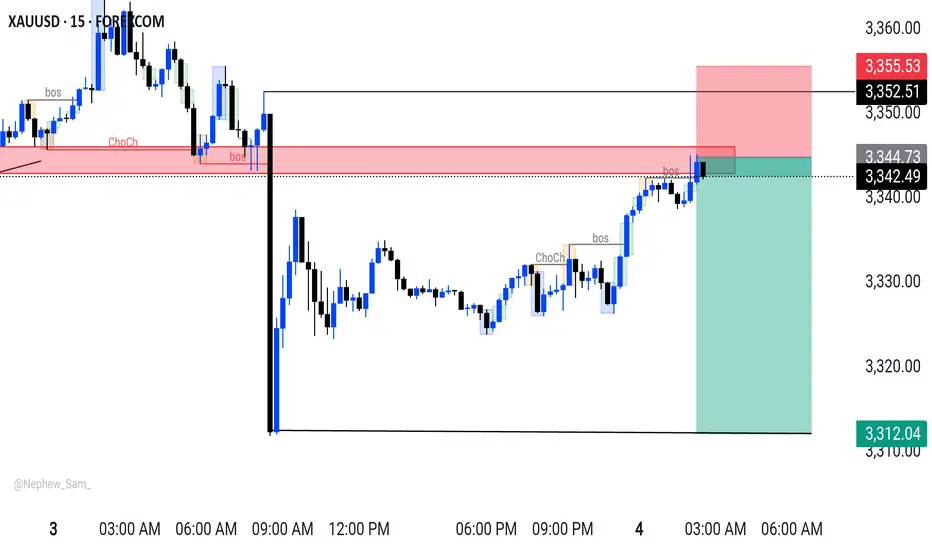
XAUUSD M15 Outlook XAUUSD Sell Setup
Timeframe:~(15M)
Entry: ~ 3344
Target1:~ 3327
Target2:~ 3312
SL:~ 3354
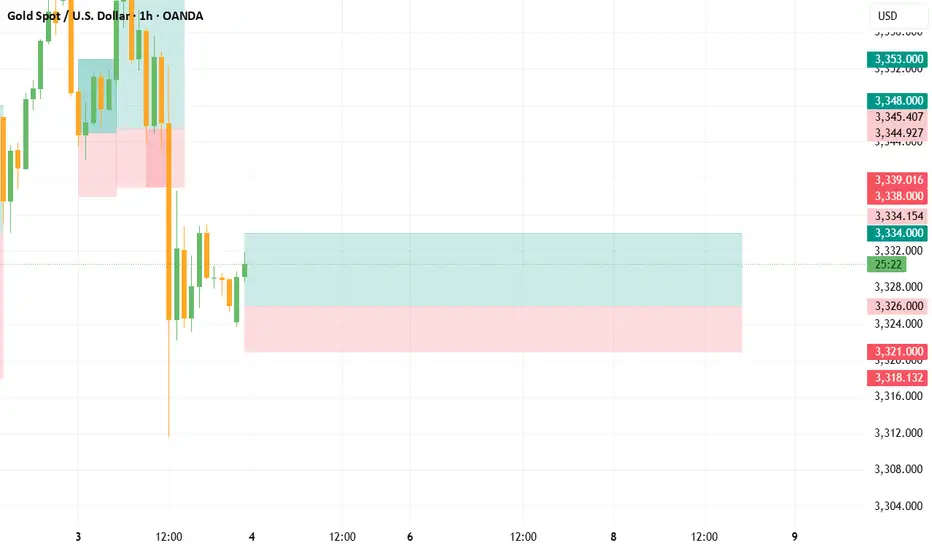
BUY LIMIT - XAUUSDBUY LIMIT - XAUUSD @ 3326.00
TP: 3334.00
SL: 3321.00
Rather earn less, never more losses
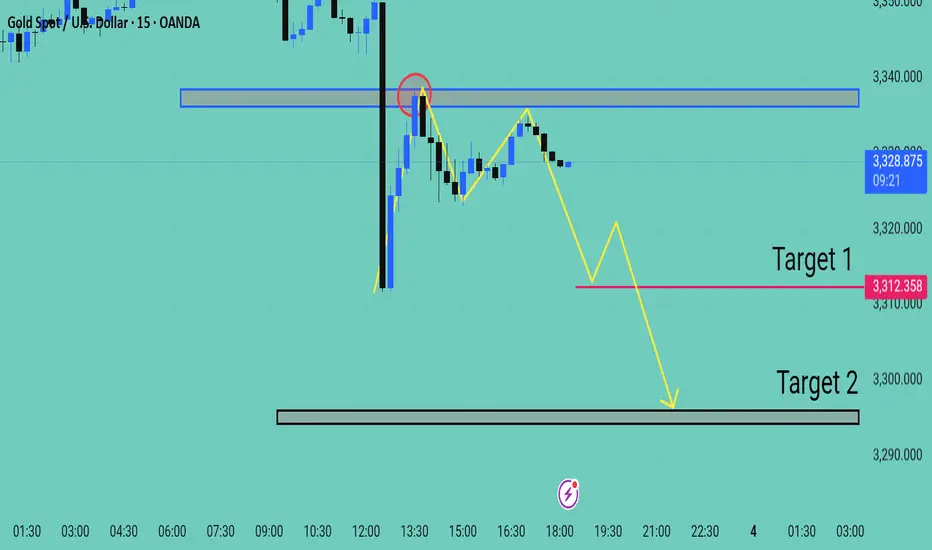
Xauusd Expecting Selling movement Gold XAU/USD on the 15-minute chart shows a clear rejection from a key resistance zone near $3332 $3335 marked by the blue rectangle Price initially spiked into this zone but quickly reversed forming a bearish engulfing pattern highlighted with a red circle indicating strong selling pressure
Following this rejection the market structure shifted to lower highs and lower lows suggesting the beginning of a bearish continuation pattern A temporary pullback occurred but failed to break above the previous swing high reinforcing bearish sentiment
Projected Move
Price is currently forming a descending pattern and is expected to break lower
Target 1 $3312 a key support and previous consolidation level.
Target 2: $3295 a stronger support zone highlighted by the black box likely the final bearish target if momentum continues
Conclusion
As long as the price remains below the resistance zone bearish momentum is favored. A clean break below $3312 could accelerate the drop toward the second target Watch for confirmation with bearish candlesticks and volume near support levels
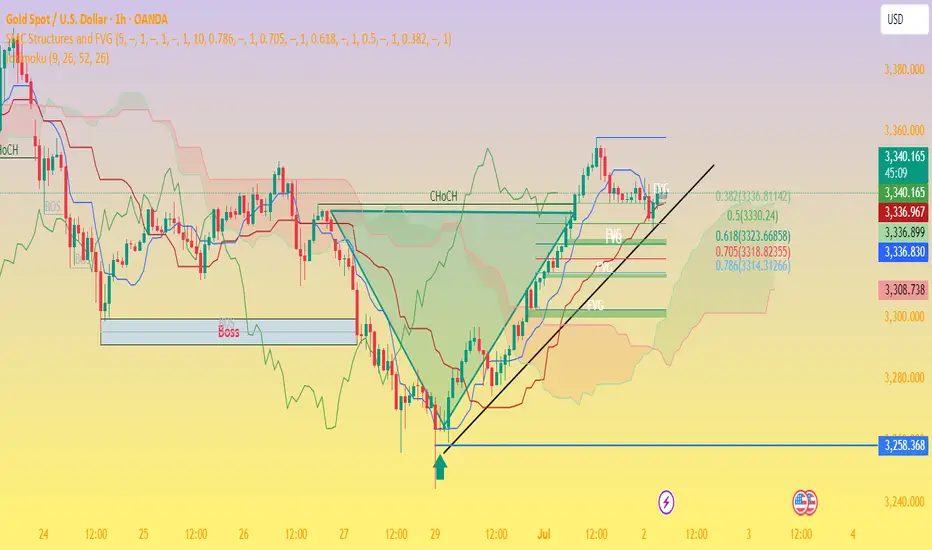
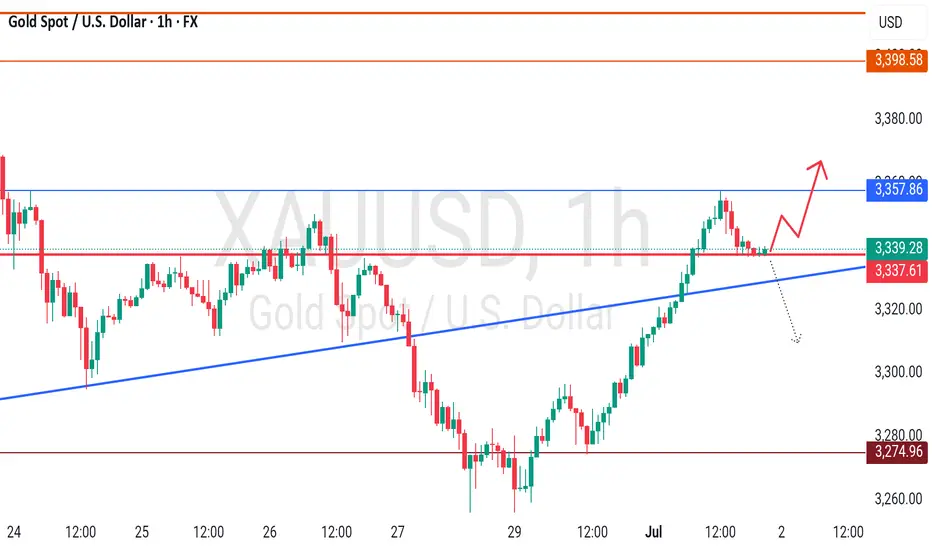
Gold Price Analysis – Bullish Momentum Holds Above FVGs🧠 Chart Breakdown:
Instrument: Gold Spot (XAU/USD)
Timeframe: 1H
Current Price: $3,340
Trend: Short-term uptrend intact
🔑 Key Observations:
Ch.o.Ch Confirmed (Change of Character):
The break above the previous structure high confirmed a bullish market structure shift.
Fair Value Gaps (FVG):
Multiple FVGs exist between $3,320 – $3,335, acting as potential demand zones and support levels.
Fibonacci Retracement:
Price is respecting the 0.382–0.5 levels ($3,336 – $3,330) well so far.
Below this, the 0.618 level at $3,325 is the next strong confluence zone.
Trendline Support:
The price is testing a rising trendline, adding dynamic support around the current level.
Ichimoku Cloud:
Price is above the cloud, which supports the bullish bias.
Conversion line (blue) and base line (red) are bullishly aligned.
📉 Possible Next Moves:
✅ Bullish Scenario:
Price bounces from current levels or slightly lower ($3,336–$3,330) and retests the recent high (~$3,355).
Breakout above $3,355 could open the door to $3,370+.
⚠️ Bearish Scenario:
If price breaks below $3,330 and the trendline, expect deeper pullbacks to:
$3,325 (0.618 Fib)
Then possibly $3,308 FVG support or $3,258 major demand zone.
📌 Conclusion:
Gold is still respecting bullish market structure with healthy pullbacks into support zones. As long as the price stays above $3,325, the bullish outlook remains valid. Watch for bullish reaction near the FVGs or a break above $3,355 to confirm upside continuation.
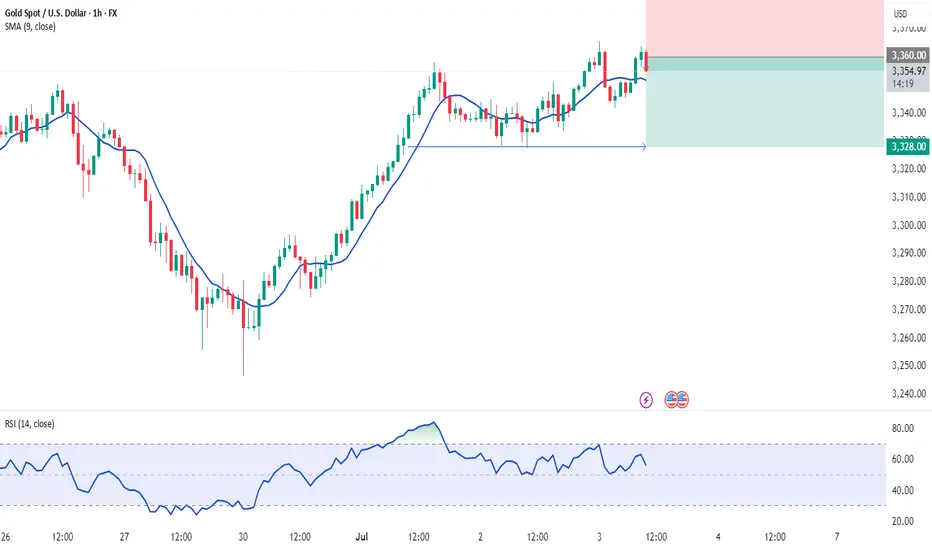
July 2, 2025 - XAUUSD GOLD Analysis and Potential OpportunityAnalysis:
Yesterday’s rally was extremely strong, breaking above 3351, a key level I’ve been watching this week — clear sign of bullish dominance.
The swing from recent lows to highs has spanned over 100 points, a move similar to past NFP weeks, where strong rallies early in the week sometimes led to sharp drops post-NFP release.
However, it’s important not to trade based on assumptions or dreams — strategies must adapt quickly to real-time price action and data.
🔍 Key Levels to Watch:
• 3375 – Resistance
• 3365 – Resistance
• 3358 – Yesterday’s high
• 3350 – Resistance
• 3337 – Important support
• 3325 – Key support
• 3310–3312 – Intraday key support zone
• 3300 – Psychological level
📈 Short-Term (15m) Trading Strategy:
• SELL if price breaks below 3340 → watch 3337, then target 3335, 3330, 3325
• BUY if price holds above 3344 → watch 3347, then target 3350, 3352, 3355
👉 If you want to know how I time entries and set stop-losses, hit the like button so I know there’s interest — I may publish a detailed post by the weekend if support continues!
Disclaimer: This is my personal opinion, not financial advice. Always trade with caution and manage your risk.
GOLD - at CUT n REVERSE area? Holds or not??#GOLD ... Perfect holdings of our upside resistance area that was actually 3357
And now market just at his current ultimate supporting area, that is 3336-37
Keep close that area and if market thold it in that case we can expect again bounce otherwise not.
NOTE: we will go for cut n reverse below 3336-37
Good luck
Trade wisely
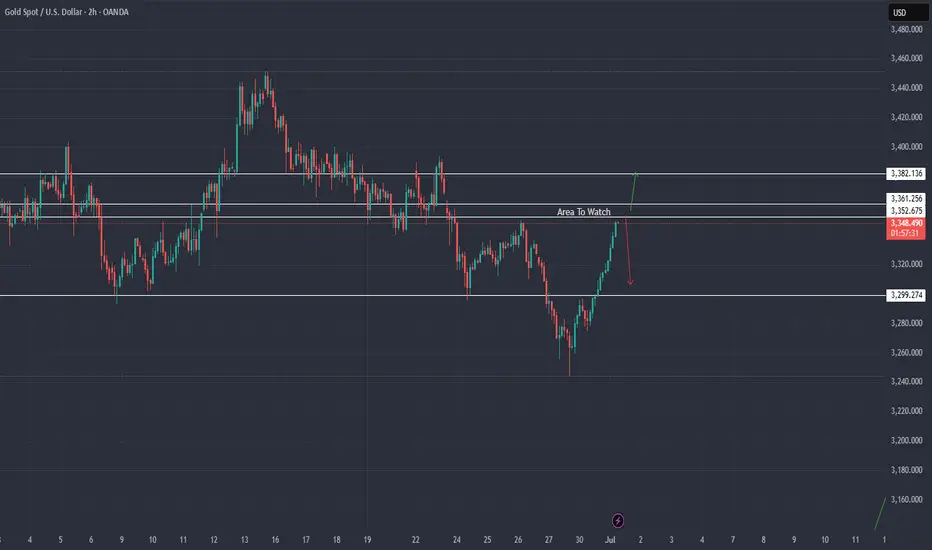
XAU / USD 2 Hour ChartHello traders. We had a nice push up during the overnight sessions. I would think that we will be pushing back down at some point. I marked my area of interest. Many times the NY session will undo what happened overnight. So I expect a nice push down. We may poke up a bit more, but for me, I am looking for scalp sells if the set up comes to fruition. This is just my speculation and idea but not advice to go clicking the buy or sell button. I will wait half the week to take one trade. BIg G gets my thanks. Let's see how things play out. Pre NY volume start coming in about 20 minutes from this writing. ( 7:20am est) Thanks for checking out my chart. Remember I said we may push up a bit more but I am looking for gold to potentially move down to correct the move up and take out anyone in Long positions in profit. Let's see if my analysis is on point today.