XAUUSD.F trade ideas
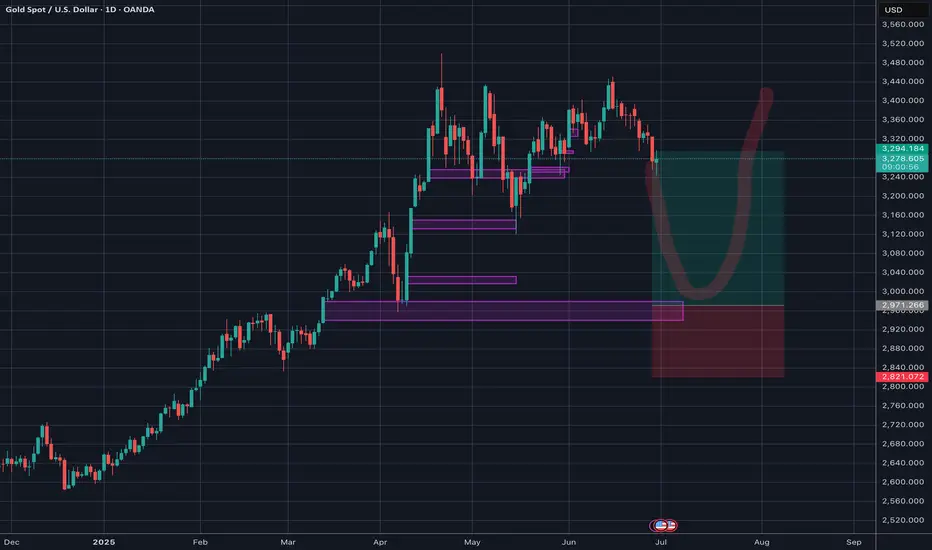
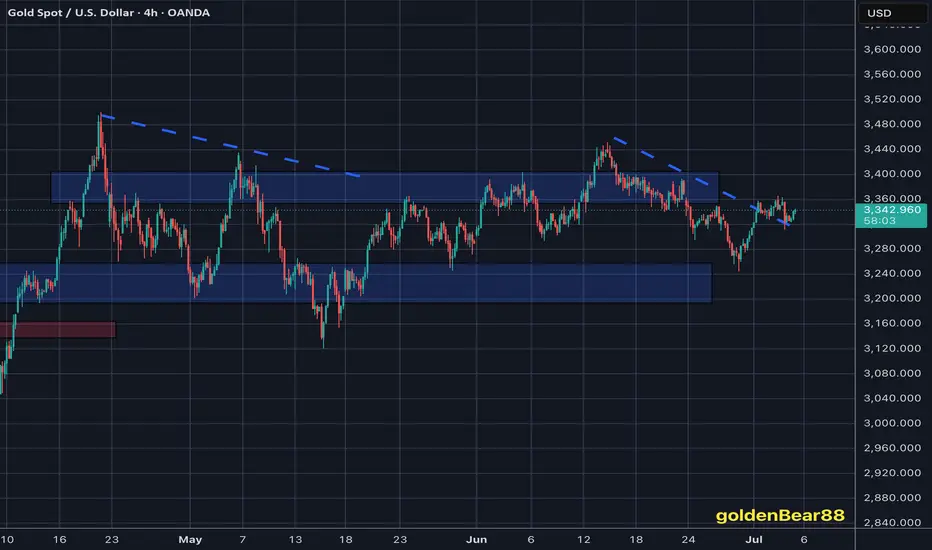
Gold on high time frame
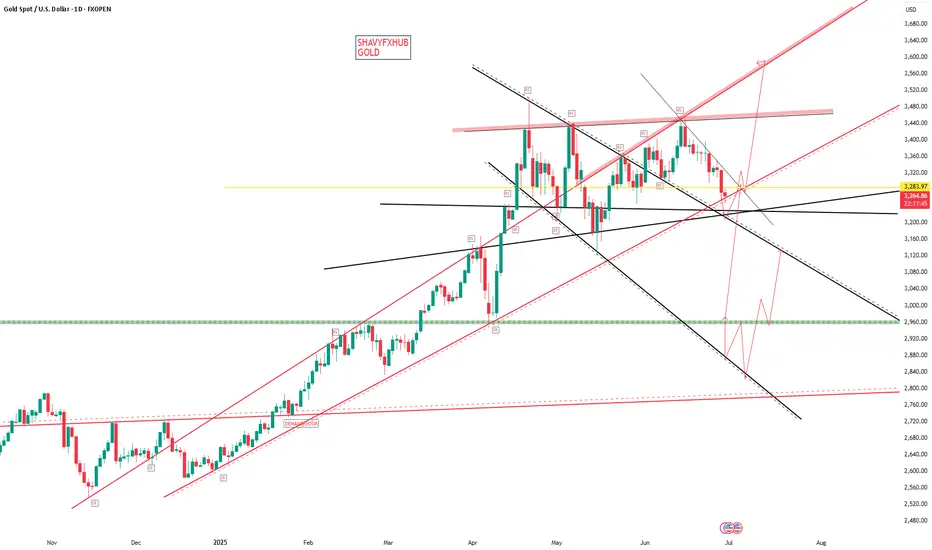
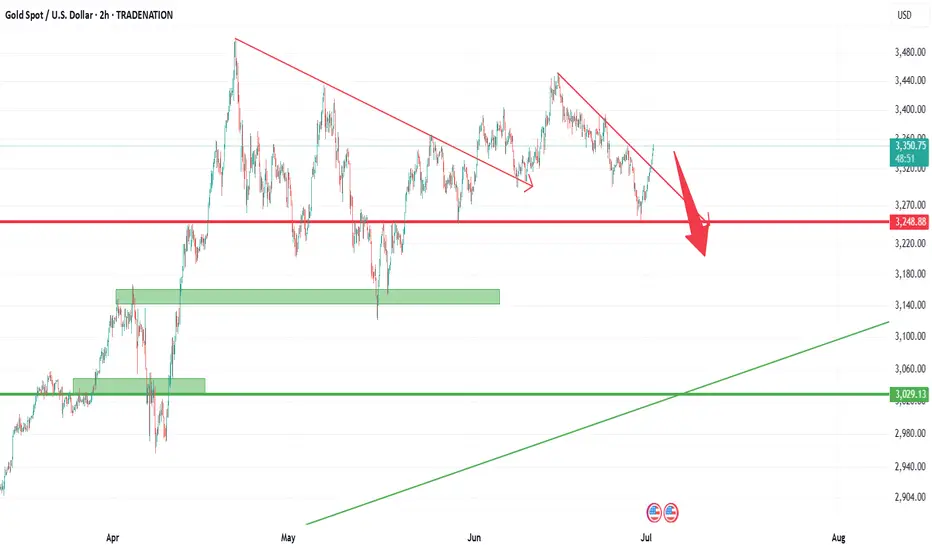
"Hello traders, focusing on gold, the price recently swept liquidity around $3,250 and displayed strong signals indicating a potential upward movement. The next target could be around $3,400."
If you need further clarification or have more details to discuss, feel free to share!
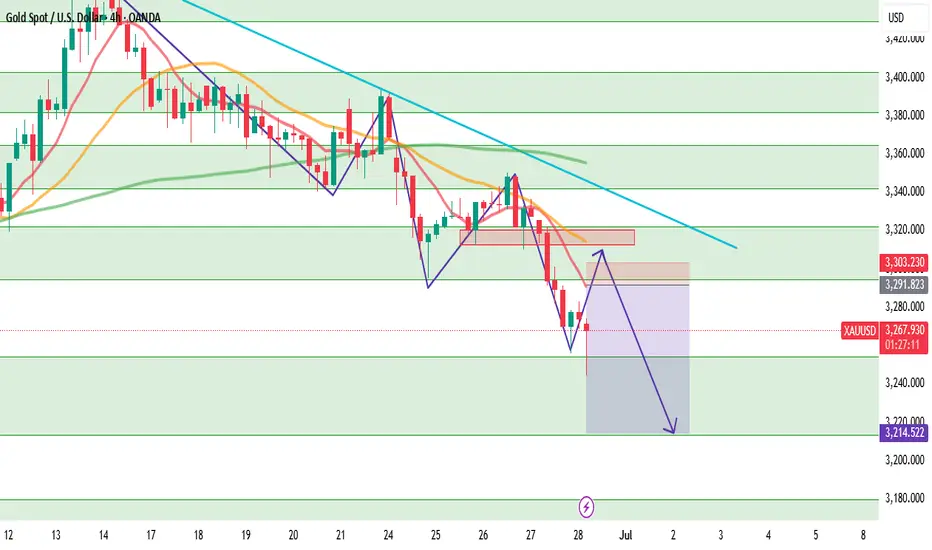
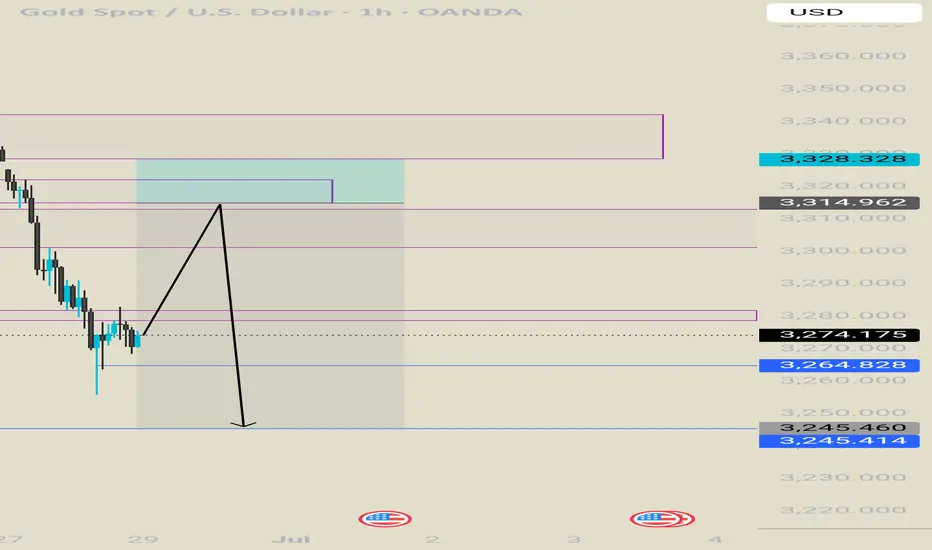
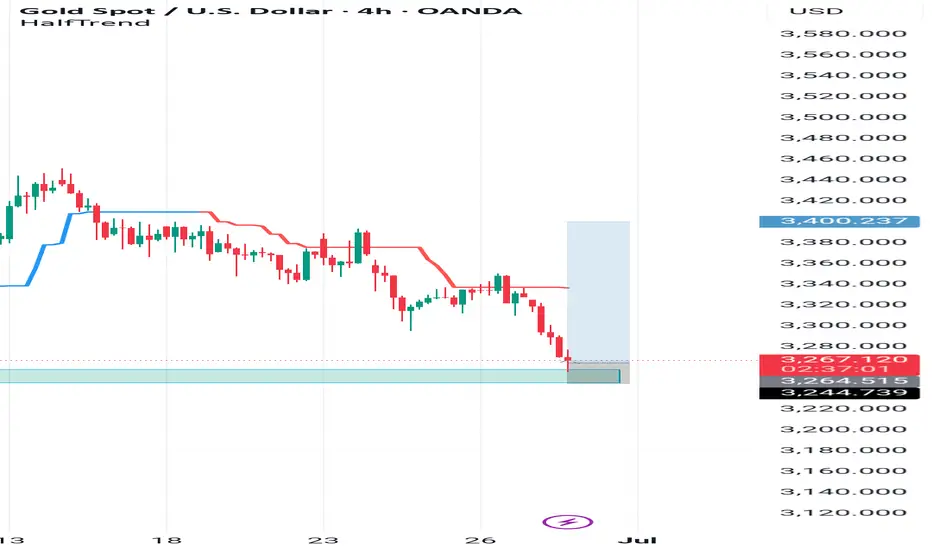
XAUUSD Analysis – June Monthly CloseGold starts the week with a weak bounce attempt after a strong bearish momentum on Friday, which pushed the market below the key 3254 support. The downtrend structure remains valid with a clear pattern of lower highs and lower lows on the 4H chart.
At the moment, price is trapped inside the 3254–3295 range. Despite the strong bearish pressure, we have yet to see a meaningful correction after the sharp drop on June 28th. This opens the door for a potential intraday pullback to test minor supply and moving average resistance near 3291–3297.
However, today is monthly candle close, which means increased volatility and possible false breakouts—especially during US sessions. Traders should be cautious with breakout traps, especially around 3305–3310, where stop hunting might occur.
The bigger picture still favors the bears unless gold manages to break and hold above the descending trendline and the EMA cluster.
📌 Trade Setup (Short Bias – Intraday Correction)
SELL zone: 3291 – 3297
SL: 3303 (Above supply & EMA test zone)
TP1: 3278
TP2: 3255
TP3: 3215
This is not a high-conviction swing setup but a tactical short based on potential rejection from previous supply and dynamic resistance. Small lot size is recommended due to the wider stop-loss and low R/R reward unless high volatility plays in our favor.
📊 Key Intraday Levels
R3: 3342
R2: 3322
R1: 3295
Pivot: 3254
S1: 3214
S2: 3180
S3: 3123
GOLD GOLD ,different broker different candle close on different time frame, this is dishonesty and it will affect the structure of the market.
GOLD GOLD ,different broker different candle close on different time frame, this is dishonesty and it will affect the structure of the market.
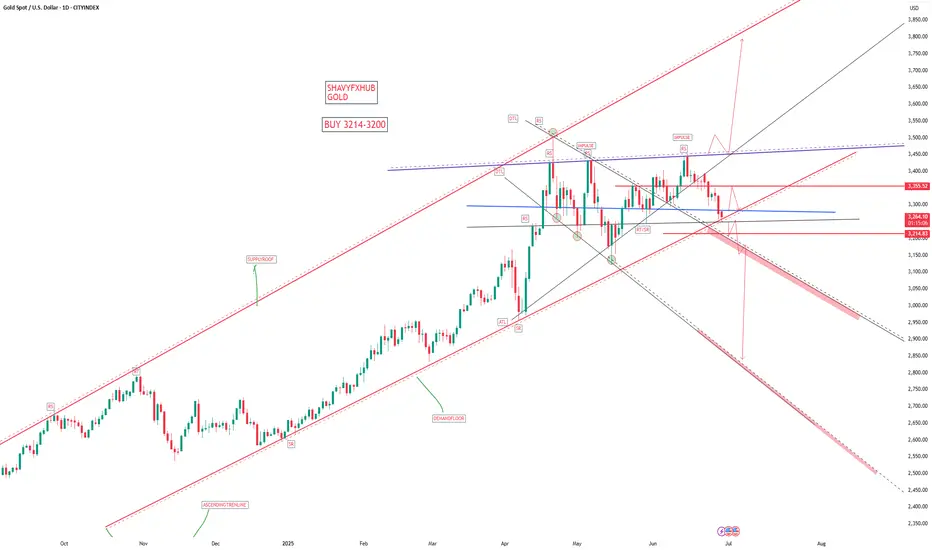
Gold short from 3314Gold projection for the next week.
First a long up until 3300 region then from there i will be lookibg for shorts.
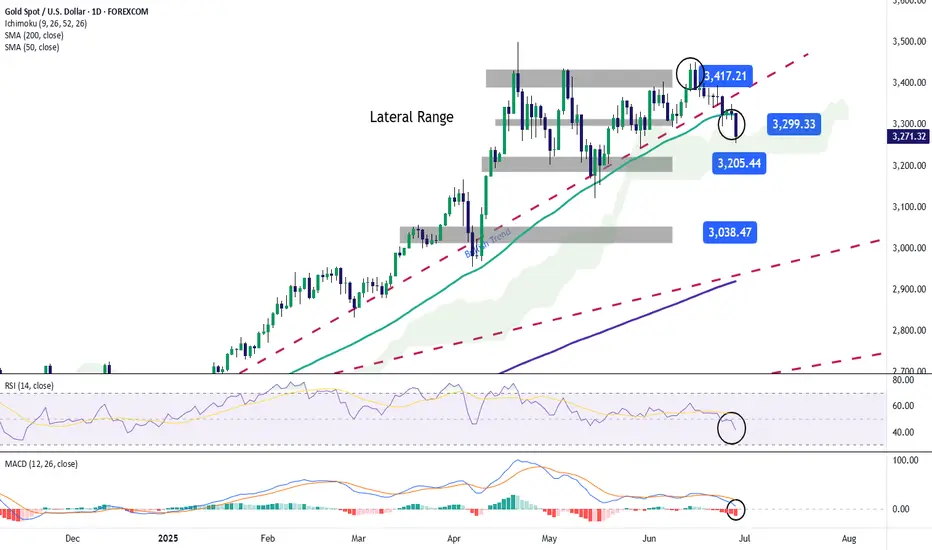
Gold Continues to Fall Below $3,300As the week comes to a close, gold is on track for a decline of more than 1.5% during the latest trading session. So far, the bearish bias remains firmly in place in the movements of the precious metal, as demand for safe-haven assets continues to fade, mainly due to the ceasefire agreement in the Middle East conflict, which has helped restore market confidence. Since gold is a classic safe-haven asset, demand has steadily weakened in recent sessions, and as long as this situation holds, selling pressure on gold may continue to intensify.
Uptrend Breaks:
Recent selling activity has played a crucial role, as it has led to a bearish breakout below the short-term trendline, which had been consistently holding on the chart. This breakdown has now opened the door for a lateral channel to form, suggesting that market sentiment has entered a more neutral zone in the short term. If bearish pressure continues, it could pave the way for a more dominant downtrend to take shape in the sessions ahead.
Indicators:
RSI: The RSI line has started oscillating steadily below the 50 level, signaling that downward momentum is beginning to dominate. If the line continues to move away from the neutral 50 level, we could expect more consistent bearish pressure on the chart.
MACD: A similar setup is emerging on the MACD. The indicator's histogram has dropped below the neutral line at zero and is showing persistent negative readings. This signals that selling momentum remains dominant, based on the average strength of the moving averages. If this continues, it would confirm a clear bearish bias.
Key Levels to Watch:
$3,300 – Current barrier: This level aligns with the midpoint of the short-term lateral channel. Price action around this area could reinforce the neutral outlook in the near term.
$3,400 – Key resistance zone: This level marks the historical highs of the gold market. A return to this level would revive the recently abandoned bullish trend and could reestablish a more optimistic outlook.
$3,200 – Critical support: This marks the lower boundary of the short-term channel. A breakdown below this level could trigger a fresh selling trend in the coming sessions.
Written by Julian Pineda, CFA – Market Analyst
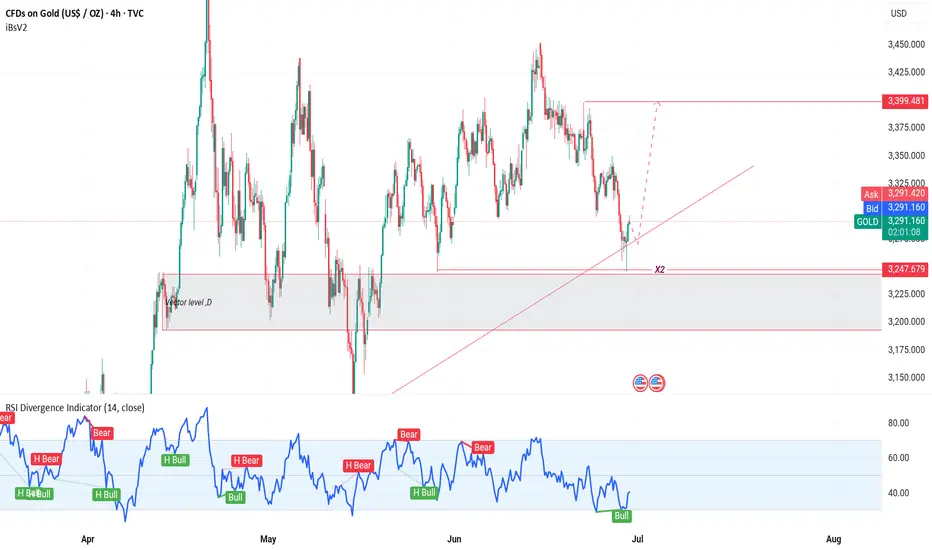
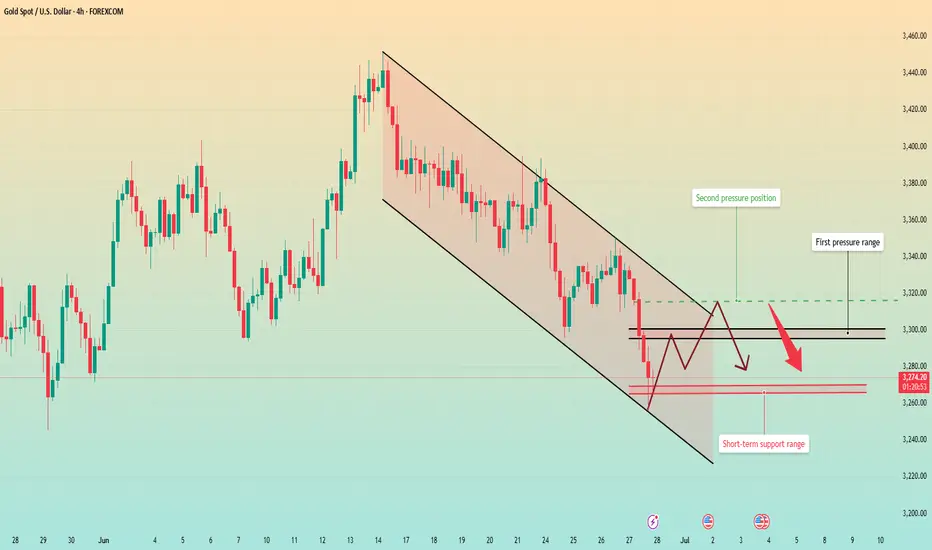
The data is negative. Will the price rebound from the bottom?Gold prices have continued to fall since the high near 3450. This trading day started the downward mode near 3328, and the European session continued to fall, breaking a new low. The negative PCE data also continued the downward mode. So far, it has rebounded after hitting the lowest level near 3255. However, the rebound is small, and the upper pressure is still very strong.
From the 4-hour chart, short-term resistance focuses on the vicinity of 3295-3300, followed by important pressure near 3315. The short-term support below focuses on the vicinity of 3265-3270. The overall strategy of shorting at high positions remains unchanged based on this range.
Operation strategy:
Short at the price rebound near 3295, short covering at the high point of 3315, stop loss 3325, profit range 3370-3360.
At present, the price fluctuates greatly. If you want to try scalping transactions, you can trade with a light position and float up and down 5 points to stop loss or profit in time.
This is the last trading day of this week. I hope you all will gain something and have a happy weekend with your family.
XauusdWill work may be. There is break of structure in smaller time frame so will go up to touch previous highs.
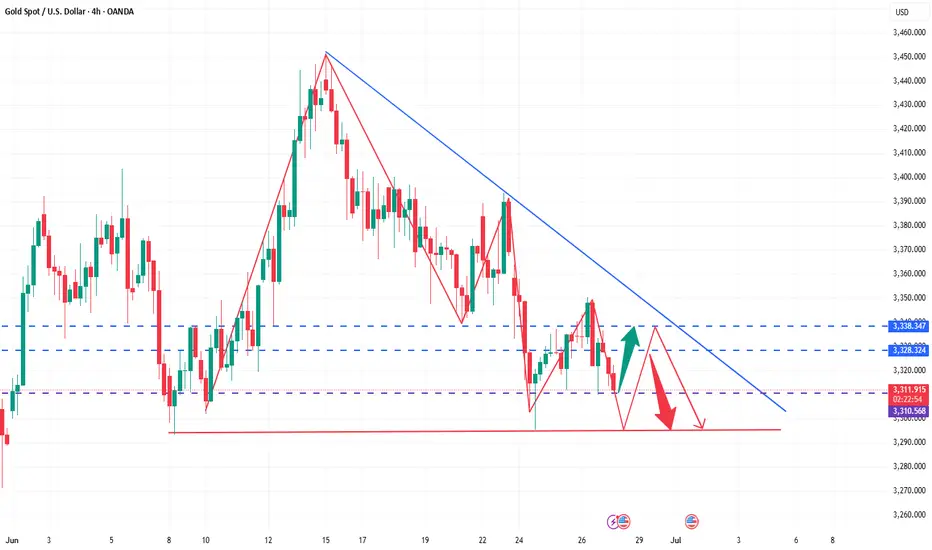
There are opportunities for both bulls and bears in gold!Gold fell back and closed lower yesterday. The daily line closed with a negative cross overnight. The overall market has not changed much. The short-term repeated tug-of-war is temporarily consolidating. Today is the closing of the weekly line, and we will continue to maintain the volatile thinking. In the 4H cycle, the Bollinger Bands closed, temporarily exerting pressure on the middle track. After rebounding to 3350 yesterday, it failed to continue and remained in a weak shock pattern. Therefore, today's operation is mainly short and supplemented by long. The upper pressure is at 3328 and 3336. Short according to the rebound strength, pay attention to the rise and fall of 3310 below. A breakthrough may see the previous low of 3295. If the support is not broken, you can consider going long.🔔For more specific operation details and strategy updates, please pay attention to the notification 🌐 at the bottom.
Gold operation suggestion: short gold around 3328-3338, target 3315-3310.
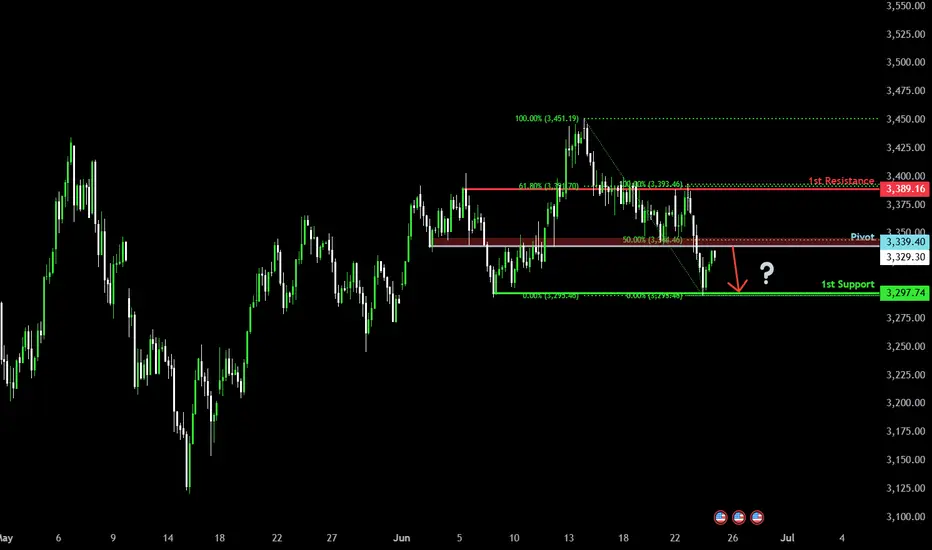
Bearish drop?The Gold (XAU/USD) is rising towards the pivot, which has been identified as an overlap resistance, and could drop to the 1st support, acting as a pullback support.
Pivot: 3,339.40
1st Support: 3,297.74
1st Resistance: 3,389.16
Risk Warning:
Trading Forex and CFDs carries a high level of risk to your capital and you should only trade with money you can afford to lose. Trading Forex and CFDs may not be suitable for all investors, so please ensure that you fully understand the risks involved and seek independent advice if necessary.
Disclaimer:
The above opinions given constitute general market commentary, and do not constitute the opinion or advice of IC Markets or any form of personal or investment advice.
Any opinions, news, research, analyses, prices, other information, or links to third-party sites contained on this website are provided on an "as-is" basis, are intended only to be informative, is not an advice nor a recommendation, nor research, or a record of our trading prices, or an offer of, or solicitation for a transaction in any financial instrument and thus should not be treated as such. The information provided does not involve any specific investment objectives, financial situation and needs of any specific person who may receive it. Please be aware, that past performance is not a reliable indicator of future performance and/or results. Past Performance or Forward-looking scenarios based upon the reasonable beliefs of the third-party provider are not a guarantee of future performance. Actual results may differ materially from those anticipated in forward-looking or past performance statements. IC Markets makes no representation or warranty and assumes no liability as to the accuracy or completeness of the information provided, nor any loss arising from any investment based on a recommendation, forecast or any information supplied by any third-party.
How to grasp the key entry opportunity in the gold market?The market is changing rapidly, and going with the trend is the kingly way. When the trend comes, just do it. Don't buy at the bottom against the trend, so as not to suffer. Remember not to act on impulse when trading. The market is good at dealing with all kinds of dissatisfaction, so you must not hold on to orders. I believe many people have experienced this deeply. The more you resist, the more panic you will feel, and your floating losses will continue to magnify. You will not be able to eat or sleep well, and you will miss many opportunities in vain. If you also have these troubles, then you might as well keep up with my pace and try to see if it can make you suddenly enlightened.
The non-agricultural data was unexpectedly cold, with a large negative impact. The stochastic indicator in the daily chart formed a golden cross, which was a main multi-signal. The BOLL range shrank, and the range shrank to 3418-3280. This range is the main range. The price pierced up and down the central axis and hovered, waiting for the news data to stimulate. The upper track of the 4-hour Bollinger band is at $3380, and the integer mark of $3400 is also near the high point of gold prices last week. The 5-day moving average and the MACD indicator cross upward, and the KDJ and RSI indicators cross upward. In the short-term technical aspect, gold has a trend of further rebound. At present, the upper resistance is at 3360-3365, and the support position is around 3310-3300.
Gold operation strategy: It is recommended to go long near 3312-3315, with a target of 3330-3340. It is recommended to go short once it touches 3340 for the first time, with a target of 3320-3310.
Will gold be corrected or revoked next?1. What happened yesterday
As expected, Gold started to rise after finding support at 3250. The move up played out perfectly, reaching the resistance area highlighted in yesterday’s analysis — around 3320–3340.
________________________________________
2. The key question today
Is this just a correction in a bearish trend, or the start of reversal?
________________________________________
3. Why I remain bearish
• On the weekly chart, structure still leans bearish
• On lower time frames, the bounce looks corrective — not impulsive
• No breakout above 3360 yet, which would be needed to shift the bias
• A move back below 3320 would likely trigger renewed selling
• If that happens, 3250 could be tested again quickly
We need to respect the bounce — but not overreact to it.
________________________________________
4. Trading plan
My bias remains bearish as long as price stays under 3360.
However, if we get a daily close above 3360, I’ll pause and re-evaluate the short bias. The market would then be signaling a potential trend shift.
________________________________________
5. Final thoughts
This is a key moment for gold. We’re at resistance zone but not broken above yet.
Until proven otherwise, the trend remains down — and rallies into 3340 zone should be considered selling opportunities.
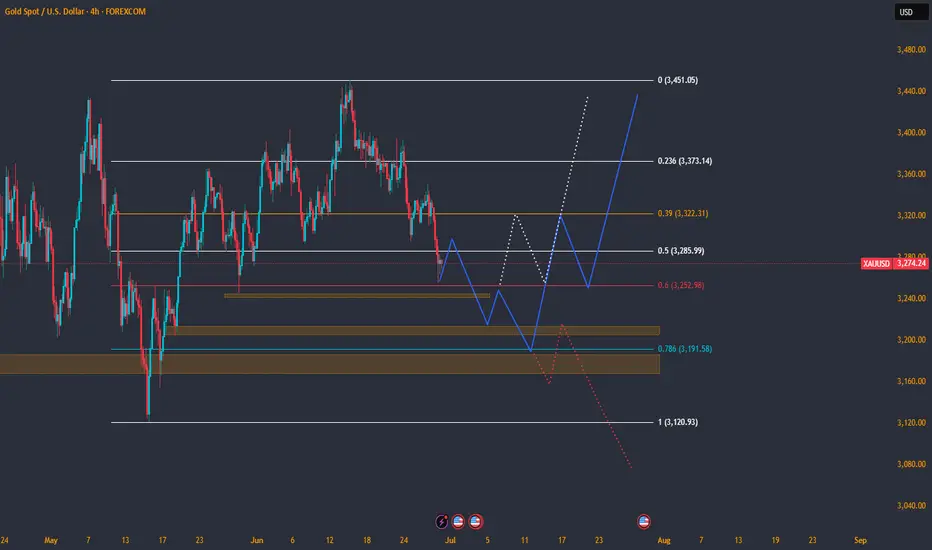
XAUUSD Update 29th JUNE 2025Last week, pullback has reached 62% fibonaci.
It have an opportunity to continue the correction in to 3205 support or more lower at 3190 level support.
So we need to becarefull on next week and we looking for a reversal / rejection signal from the market as a confirmation.
We need to give our attention to a fundamental data also. If there is a big news on war / geopolitical or global economic in July, we could be more convidence about gold price direction.
If 3155 lose...it would be more deep, but it would be unlikely.
Have a good luck !
P.S : If you agree, Boost it
Gold is in the Bearish DirectionHello Traders
In This Chart GOLD HOURLY Forex Forecast By FOREX PLANET
today Gold analysis 👆
🟢This Chart includes_ (GOLD market update)
🟢What is The Next Opportunity on GOLD Market
🟢how to Enter to the Valid Entry With Assurance Profit
This CHART is For Trader's that Want to Improve Their Technical Analysis Skills and Their Trading By Understanding How To Analyze The Market Using Multiple Timeframes and Understanding The Bigger Picture on the Charts
U.S. stocks are closed, how to operate gold volatility📰 News information:
1. Geopolitical situation
2. Tariff implementation and interest rate cut bill
📈 Technical Analysis:
Gold has maintained a volatile pattern recently, lacking a sustained unilateral trend. The unclear short-term direction of DXY has limited the volatility of gold. The market has repeatedly shown a mixture of high-rise decline and downward recovery. It is unable to effectively break through the previous high and lacks the momentum to break downward. The short-term pressure during the day is concentrated on the 3340-3345 line, and the upper middle track is at 3350. If it fails to effectively break above 3350, then gold may fall further. On the contrary, if it can stand above the middle track 33350, then gold may rise further. The short-term support below is near the 3323 line. If it fluctuates during the day, maintain a high-altitude low-multiple cycle.
🎯 Trading Points:
SELL 3340-3350
TP 3330-3320-3310
BUY 3320-3310
TP 3340-3350
In addition to investment, life also includes poetry, distant places, and Allen. Facing the market is actually facing yourself, correcting your shortcomings, confronting your mistakes, and strictly disciplining yourself. I hope my analysis can help you🌐.
FXOPEN:XAUUSD PEPPERSTONE:XAUUSD FOREXCOM:XAUUSD FX:XAUUSD OANDA:XAUUSD TVC:GOLD
Excellent NFP sessionAs discussed throughout yesterday's session commentary: "My position: Gold is Trading within #3,350's belt which represents crossroads for the Short-term. Either #3,362.80 - #3,368.80 break-out to the upside towards #3,377.80 strong Resistance, or #3,342.80 - #3,352.80 break-out to the downside towards #3,327.80 Support. Current Price-action is ideal for Scalping since I don't expect major movement until tomorrow's NFP numbers."
Firstly I have re-Sold Gold almost all Wednesday's Asian session from #3,360's (Wednesday - Thursday) closing my orders on #3,352.80 then re-Bought Gold with set of aggressive Scalping orders from #3,345.80 towards #3,352.80. As NFP numbers were delivered, I have waited for decline to find a Support and Bought Gold aggressively from #3,312.80 and closed on #3,320.80. Later on, #3,332.80 Sold again (#4 aggressive Scalps) and closed on #3,327.80 and with mentioned order finalized excellent NFP session.
Technical analysis: The Short-term Price-action is Trading within #3,327.80 - #3,352.80 belt as I can easily spot idle movements on Hourly 4 chart with #3,327.80 Support bounces but regardless, Gold is Trading within my predicted values. Spot though on the Hourly 4 chart how Technicals are showcasing different / mixed values, and Gold is isolated within Neutral Rectangle with detectable Higher Low’s Upper and Lower zone. This is what I described on my commentary as an Bearish Divergence (BD) and is usually a first alert that the trend might be pointing to even stronger takedown. See how the very same divergence has Traded since November - April. On the November #12 Low, the Price-action started rising on an Ascending Channel but only once the structure formed a new Low. Then again after mentioned Low’s, Gold started rising until the next Bullish Divergence (which means, after local Low's tested, Gold engaged parabolic uptrend). I am monitoring closely #MA50 on Daily chart which is pointer for new #1 - #3 Month cycle.
My position: I will take no new orders as I am Highly satisfied with my returns / also it is holiday in U.S. as I do not expect major moves throughout the session (only ranging candles with Low Volume). Enjoy the Profits and have a great weekend!
XAUUSD CHART PATTERN 2\HTrade Setup (Buy Position):
Entry Point: 3330
Target 1: 3380
Target 2: 3420
Stop Loss: 3290
Strategy Insight
You’re targeting a +50 pip move to Target 1 and +90 pip move to Target 2.
Risk is -40 pips from the entry (3330 → 3290).
Risk-Reward Ratio:
To Target 1: 1.25 : 1
To Target 2: 2.25 : 1
This is a moderately aggressive setup with a good reward potential.
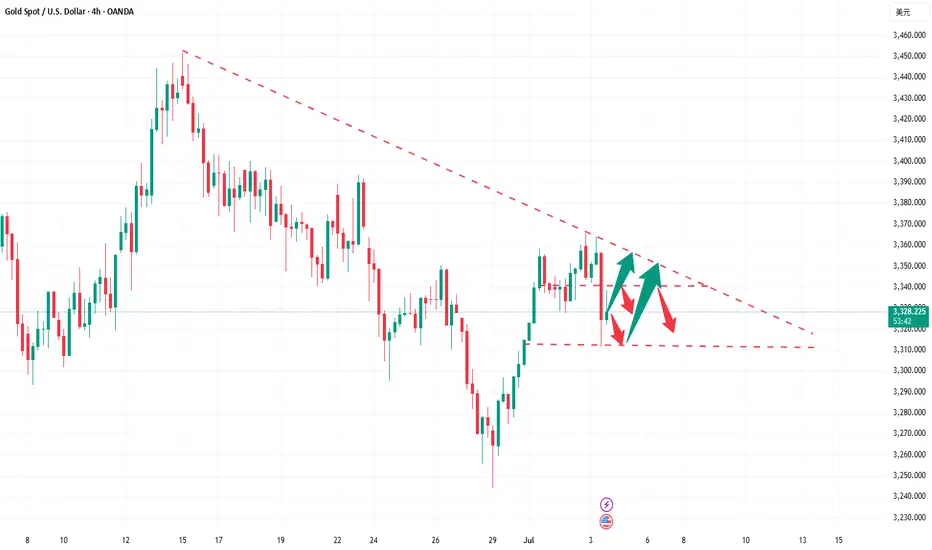
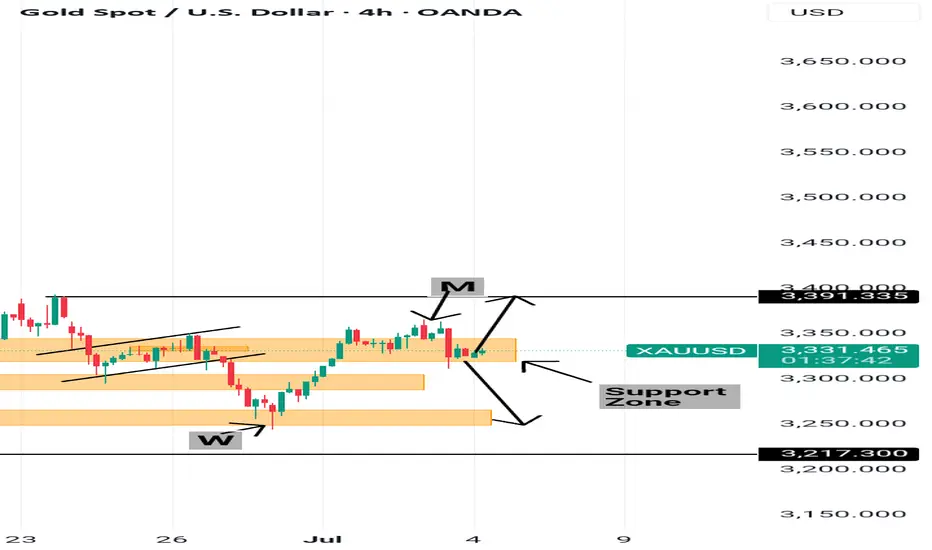
Neutral probabilities Gold seems to be forming the right shoulder of and inverse head and shoulders pattern (IH&S) which would thus translate to a push upwards to 3391.355 to complete the pattern.
Equally there is a bullish channel with a clear M at the top where the bearish movement began.
There is a consolidation without a clear indication of whether its a continuous bearish pattern that will drop all the way to 3249.416 or it form a W formation.
Only time will tell.
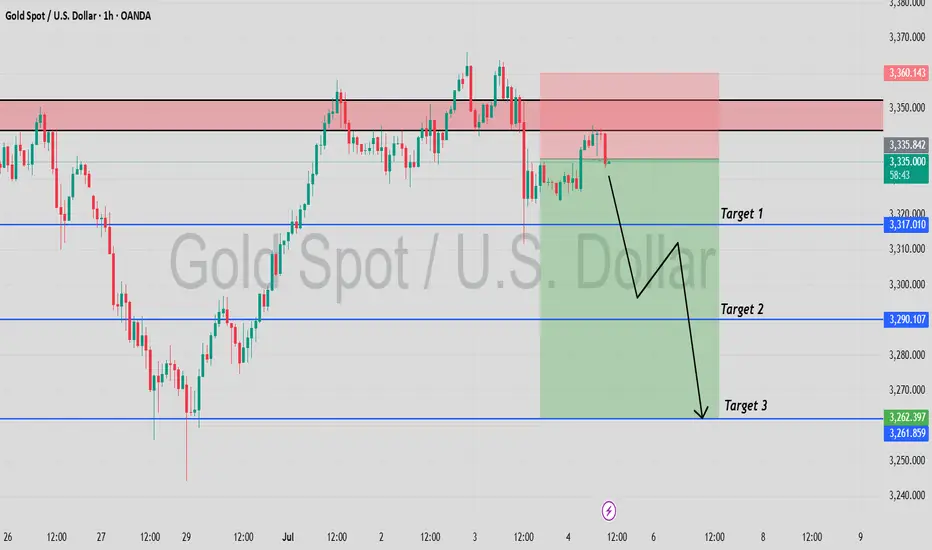
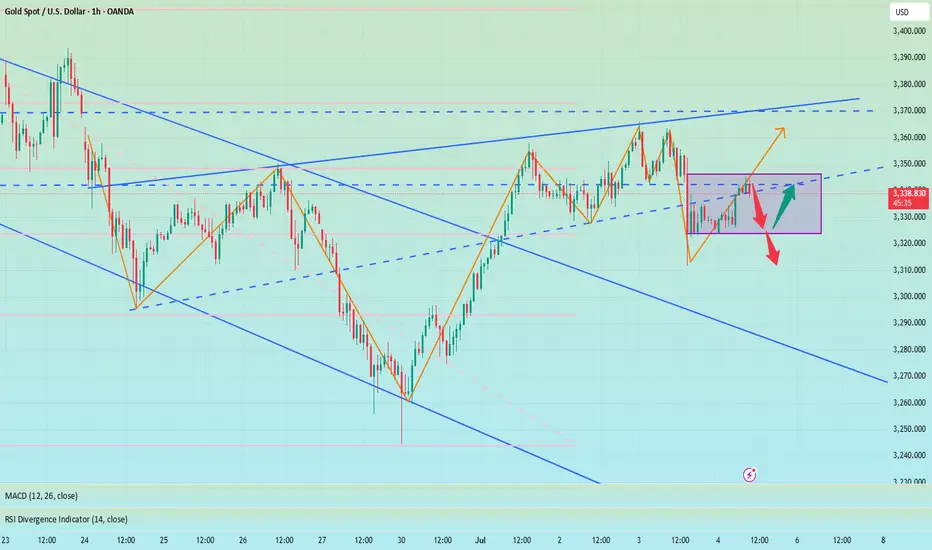
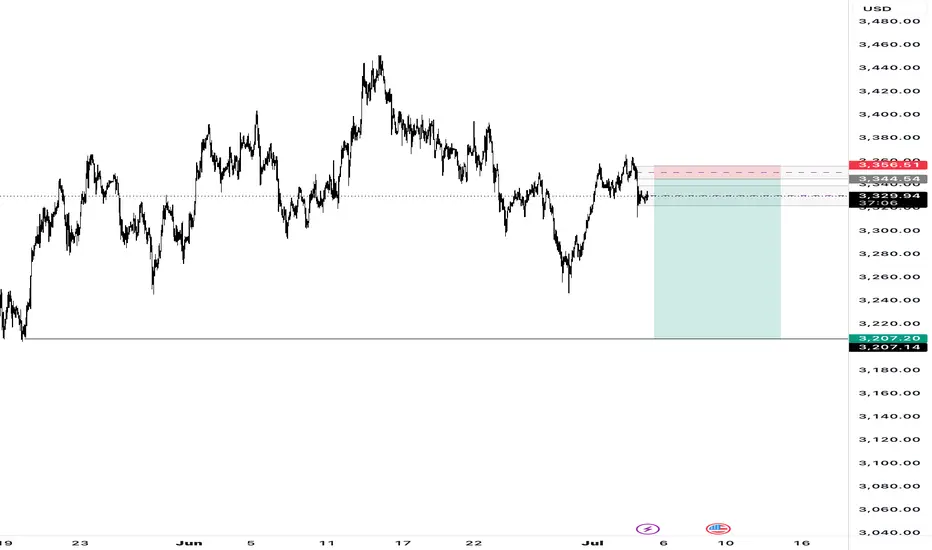
Bait. Trigger. Collapse!🎯 XAUUSD 1H – Anticipating the Upside Fakeout Before the Real Drop
📉 Trade Breakdown:
Gold is consolidating just beneath a 1H supply zone (3344–3356), forming the classic structure for a liquidity trap. The expectation: price fakes out to the upside, taps the supply zone, and then reverses with a clean bearish move toward 3207. This isn’t just a technical setup — it’s fundamentally fueled by a blowout NFP report.
⸻
📍 Key Technical Confluences:
• 🔸 1H supply zone: 3344–3356 (clean bearish reaction)
• 🔸 Consolidation beneath supply = energy buildup
• 🔸 Likely upside fakeout into supply → then rejection
• 🔸 Equal lows + inefficiency below = target-rich zone
• 🔸 3207 = next major demand / clean target
⸻
📰 Fundamental Fuel:
• 🔹 NFP came in strong (206K vs. expected ~190K)
• 🔹 Dollar surged, yields rebounded → gold dropped
• 🔹 Rate cut hopes fading = bullish for USD, bearish for XAU/USD
• 🔹 Market is now adjusting expectations → selling gold aggressively
• 🔹 Gold already fell post-NFP, but this pullback into supply gives sellers a second entry
⸻
📈 Execution Plan:
• Entry: After upside sweep into 3344–3356 with M15–H1 rejection
• Stop Loss: Above 3356 (supply invalidation)
• Take Profit: 3207 (clean structure + news-driven momentum)
• Optional sniper trigger: Wick rejection during NY session or USD news spike
⸻
🧠 Mindset:
This setup is time-sensitive. It’s not just about structure — it’s about who’s trapped and what the market believes post-NFP. Don’t chase candles. Wait for the manipulation to finish — then strike with precision.
“Trade Simple. Live Lavish.”
-Quil Lavish
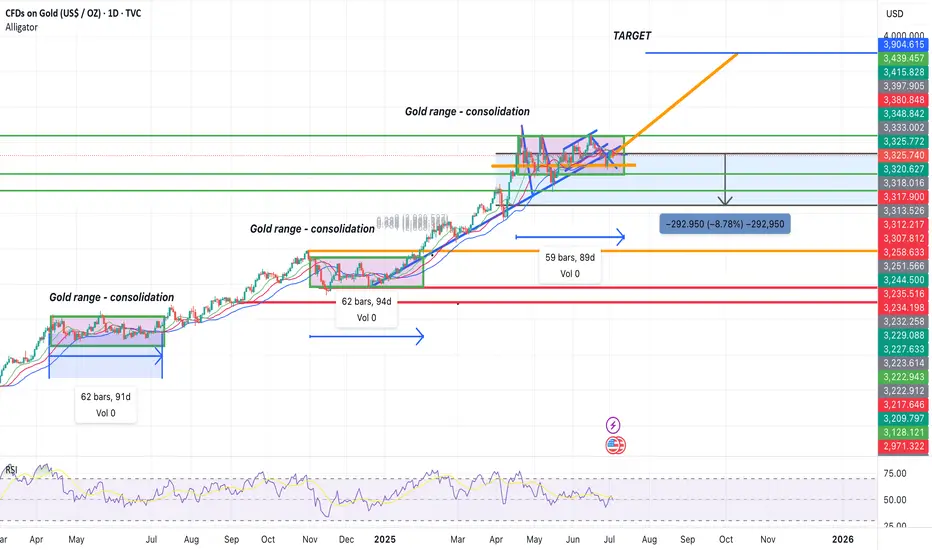
XAU Tarde idea | GOLD Trade CallGold is showing long consolidation and following previous structure of 60 bars and 90 days which shows massive upward projection as per previous history. Possible targets are highlighted.
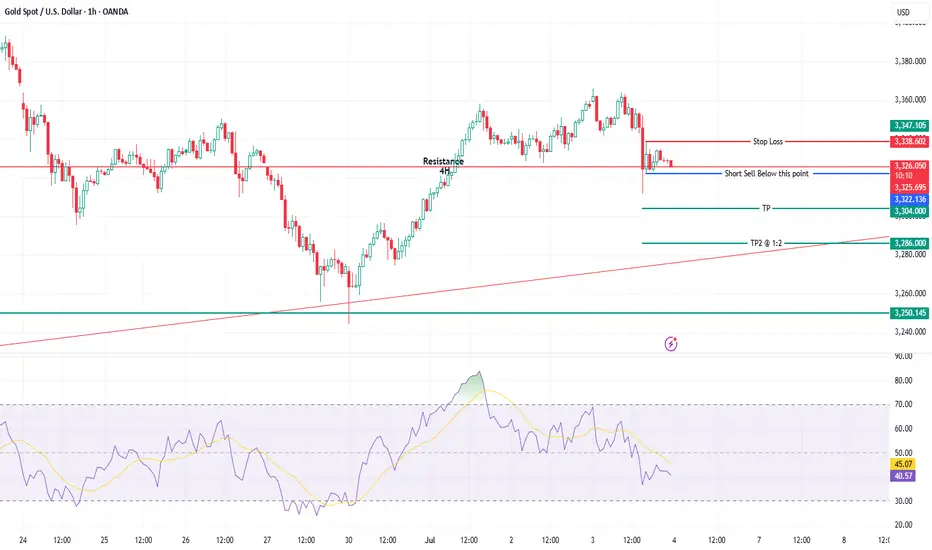
XAUUSD Glitter is fading away. Gold has been under pressure for quite a few days. In the day it shed a handful of money from its value. In this process it had an intraday penetration of 4 hour support and resistance level. Albeit it retraced back quickly but it is trading in the range. If it brakes the range downward we may initiate the short sell.
For convenience all the levels have been marked on the chart.
Have profitable trading
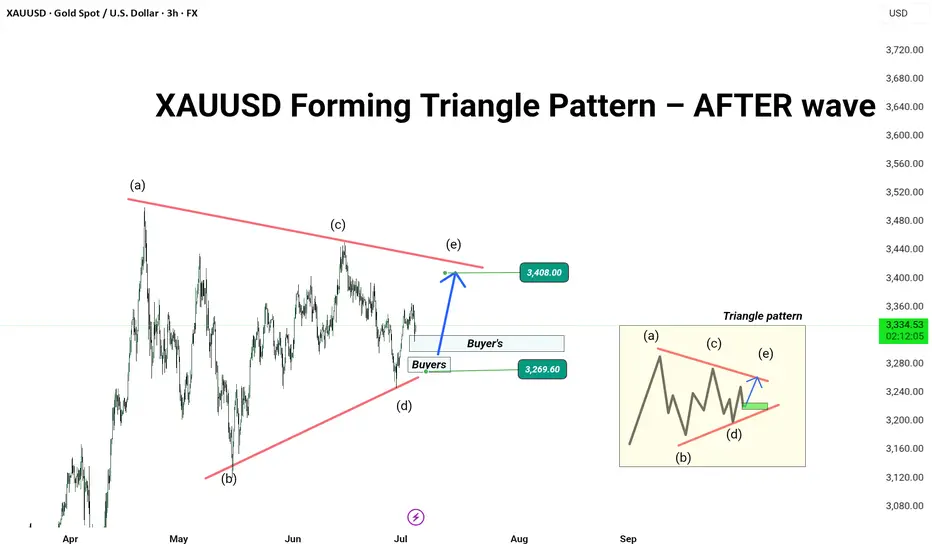
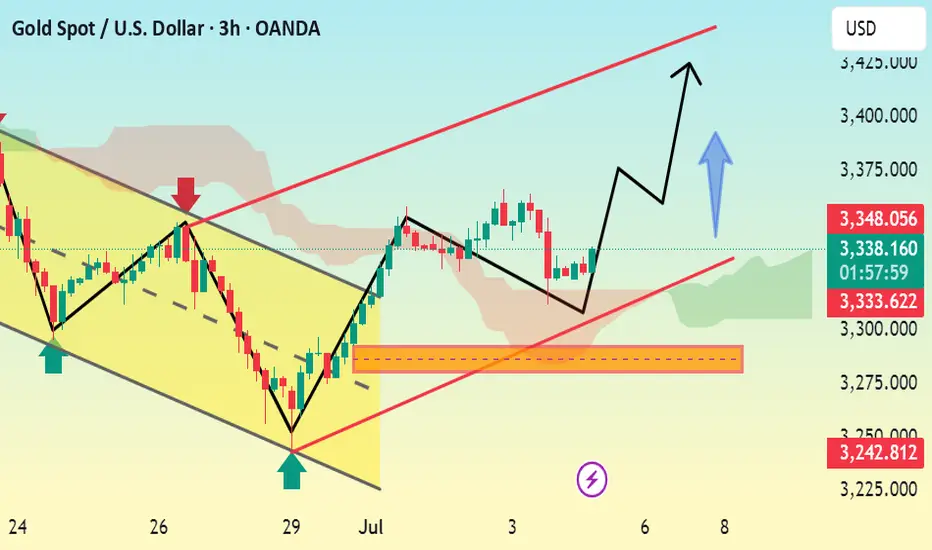
XAUUSD Forming Triangle Pattern – Eyeing Breakout After Wave (e)🚨 Gold (XAUUSD) Technical Analysis – 3H Chart
Gold is currently forming a classic contracting triangle pattern (ABCDE), with wave (e) in progress. Price is bouncing from a strong buyers’ zone near 3269.60, showing signs of upward pressure.
📊 Current Structure:
Wave count: (a)-(b)-(c)-(d)-(e)
Consolidation within a symmetrical triangle
Key support: 3269.60
Resistance zone to watch: 3408.00
📈 Potential Scenario:
If price holds above the buyer’s zone, we can expect a bullish wave (e) push towards the upper trendline at 3408, potentially leading to a breakout continuation.
📍 Trade Plan (Educational Purpose):
Long Setup Valid Above: 3269.60
Target: 3408.00
Stop Loss (SL): Below 3260 (based on your risk profile)
---
🧠 Why This Matters?
This triangle setup often leads to strong breakout moves, especially in commodities like gold during fundamental uncertainty or dollar index shifts. The market is compressing — be prepared for the breakout move.
---
📢 Follow for more clean Elliott Wave + Price Action setups!
💬 Drop your analysis in the comments. Let’s grow together!