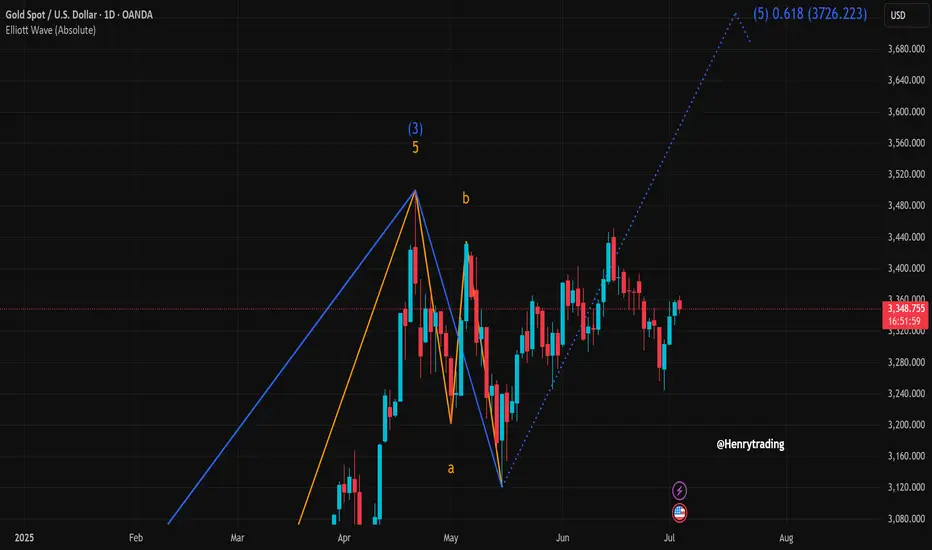
Elliott Wave Analysis of XAUUSDOn the daily chart of XAUUSD, we are witnessing a clearly defined Elliott Wave structure, with the potential formation of an extended wave (5) targeting the $3,726 region — aligned with the 0.618 Fibonacci extension. This is a key technical signal that could capture the attention of both long-term investors and strategic swing traders.
1. Elliott Wave Overview:
Wave (3) concluded at the peak around $3,365, followed by a textbook a-b-c corrective pattern.
Waves "a" and "b" are clearly identifiable, with wave "c" appearing to have completed.
The current price action suggests a rebound from the bottom of wave c — a strong indication of a possible start to wave (5).
2. Wave (5) Target Zone:
The Fibonacci 0.618 extension projects a target near $3,726 — a significant price level the market could approach if bullish momentum builds up.
This level also serves as a psychological resistance zone, so expect possible volatility as the price nears this area.
3. Price Behavior & Confirmation Signals:
Recent candlestick formations reveal renewed buying interest, with multiple bullish candles showing long bodies and lower wicks.
Holding above the key support around $3,300 is crucial for confirming the formation of an uptrend.
A breakout above the $3,365 high (wave (3) peak) would be a strong signal that wave (5) is in motion.
4. Suggested Trading Strategies:
Buy limit: Consider entries around the $3,310 – $3,320 support zone on a retest.
Buy breakout: Trigger entries if price breaks decisively above $3,365 with strong volume.
Take profit: Gradually scale out positions around the $3,680 – $3,726 area.
Stop loss: Place stops below the wave c bottom — under $3,245.
5. Conclusion:
XAUUSD is currently in a sensitive phase with a high probability of a bullish breakout. The Elliott Wave structure shows that there is still considerable upside potential. However, traders should maintain strict risk management, as wave (5) formations often involve significant price swings.
XAUUSD.F trade ideas
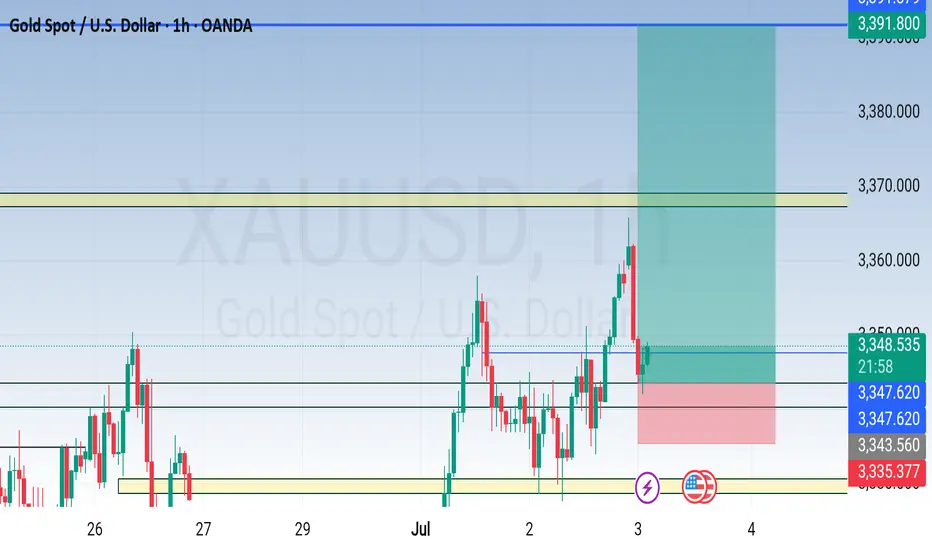
Gold next target NFP News As you know, today is NFP news and my target in the news is that gold should go to 3391 which is becoming the best position for a buy. If you are satisfied with my analysis, then you can play and this is my analysis.
GOLD The ADP Non-Farm Employment Change for July 2,have a forecast of 99,000 jobs, compared to the previous month’s very weak result of 37,000—the lowest since March 2023. The ADP National Employment Report is a monthly indicator that tracks changes in non-farm private sector employment in the US, based on anonymized payroll data from ADP’s clients, covering about one-fifth of all US private employment.
Who is responsible?
The report is produced by the ADP Research Institute, part of Automatic Data Processing (ADP), in partnership with the Stanford Digital Economy Lab.
Why it matters:
The ADP report is viewed as a leading indicator for the official Non-Farm Payrolls (NFP) report from the Bureau of Labor Statistics (BLS), released two days later.
It provides early insight into US private sector job growth and labor market health, and significant deviations from forecasts can move financial markets.
Note that the ADP report covers only private sector jobs, not government employment, so its numbers can differ from the official NFP.
Summary Table:
Report Date Forecast Previous Responsible Department
July 2, 2025 99,000 37,000 ADP Research Institute (ADP)
In summary:
The ADP Non-Farm Employment Change report, produced by the ADP Research Institute, forecasted a rebound to 99,000 jobs in June after a very weak 37,000 in May, providing an early signal on the health of US private sector employment.
(2)US10Y drops to historical low to 4.193% and currently broken 1hr descending trendline at 4.281% ,4.3% resistance will be watched for breakout buy bond buyers.
(3) DXY Key Points:
The DXY measures the US dollar’s strength against a basket of six major currencies: the euro (57.6% weight), Japanese yen (13.6%), British pound (11.9%), Canadian dollar (9.1%), Swedish krona (4.2%), and Swiss franc (3.6%).
After peaking near 110.075$ in January 2025, the index has softened , trading near 96.600-101.966.on weekly TF 101.966 was a retest to broken weekly demand floor .
The dollar’s decline reflects market expectations of Federal Reserve rate cuts later in 2025, easing inflation pressures, and some geopolitical easing.
the DXY to rebound will henge and depend on Fed policy and global economic conditions.
GOLD buyers are watching for the direction of trade ,
Chinese Demand and Policy:
China is one of the largest gold consumers and holders. Domestic demand, central bank gold purchases, and monetary policy in China heavily influence XAU/RMB. If China’s economy slows or trade tensions with the US worsen, demand for gold as a safe haven may increase, supporting XAU/RMB even if the dollar is strong.
China's recent opening of the Shanghai Gold Exchange's (SGE) first offshore gold vault in Hong Kong on June 26, 2025, represents a significant development with potential, albeit indirect, implications for XAU/USD (gold priced in US dollars) .
Key Aspects of the Hong Kong Gold Vault:
Location and Operation: The vault is located in Hong Kong and operated by Bank of China's Hong Kong unit .
Yuan-Denominated Trading: All transactions and settlements in the vault are denominated exclusively in yuan, either via cash or physical bullion delivery . Two new yuan-denominated gold trading contracts were launched alongside the vault .
Strategic Objectives:
Increased Influence on Gold Pricing: China, as the world's leading gold producer and consumer, aims to gain greater control and influence over global gold pricing mechanisms .
Yuan Internationalization: The initiative seeks to accelerate the international usage of the yuan, supporting China's broader de-dollarization efforts . This allows China to import gold in yuan, reducing reliance on the US dollar for commodity trading .
Enhanced Global Reach: The vault expands the SGE's physical infrastructure beyond mainland China, creating a new gateway for international gold trading and solidifying Hong Kong's role as a key financial hub .
Physical Settlement: It facilitates the physical settlement of gold contracts outside mainland China .
Implications for XAU/USD:
While the new vault directly promotes yuan-denominated gold trading, its implications for XAU/USD are primarily indirect and long-term:
De-dollarization Efforts: By promoting yuan-denominated gold trading, China is actively working to reduce global reliance on the US dollar in commodity markets . If successful, a more diversified global gold trading landscape could gradually diminish the dollar's sole influence over gold prices, potentially leading to less direct inverse correlation between the dollar and gold .
Increased Demand and Liquidity: The vault aims to attract more international participants to yuan-denominated gold markets, potentially increasing overall gold demand and liquidity in the Asia-Pacific region . While this demand is primarily yuan-driven, a generally stronger global gold market could indirectly support XAU/USD .
Price Discovery: The establishment of offshore yuan-denominated gold trading creates an alternative price discovery mechanism . This could, over time, offer a benchmark that is less directly tied to dollar-centric factors, which might subtly influence XAU/USD by diversifying global pricing inputs .
Market Fragmentation vs. Integration: This move could be seen as a step towards fragmenting the global gold market by creating a distinct yuan-based ecosystem, or conversely, as a way to integrate China more deeply into the international gold market by offering new access points . The ultimate effect on XAU/USD would depend on whether this leads to more cohesive or more disparate global gold price movements.
In summary: China's new Hong Kong gold vault is a strategic move to boost the yuan's role in commodity trading and increase China's influence in global gold pricing. While it primarily impacts yuan-denominated gold, its long-term success in de-dollarization efforts could indirectly, over time, alter the dynamics and correlations currently observed in XAU/USD.
XAU/USDPrice action trading is a methodology where traders make decisions based on the interpretation of actual price movements on a chart, rather than relying primarily on lagging indicators. It involves observing and analyzing candlestick patterns, trend lines, support and resistance levels, and volume to identify potential trading opportunities and manage risk. The focus is on understanding the story the market is telling through its price behavior.
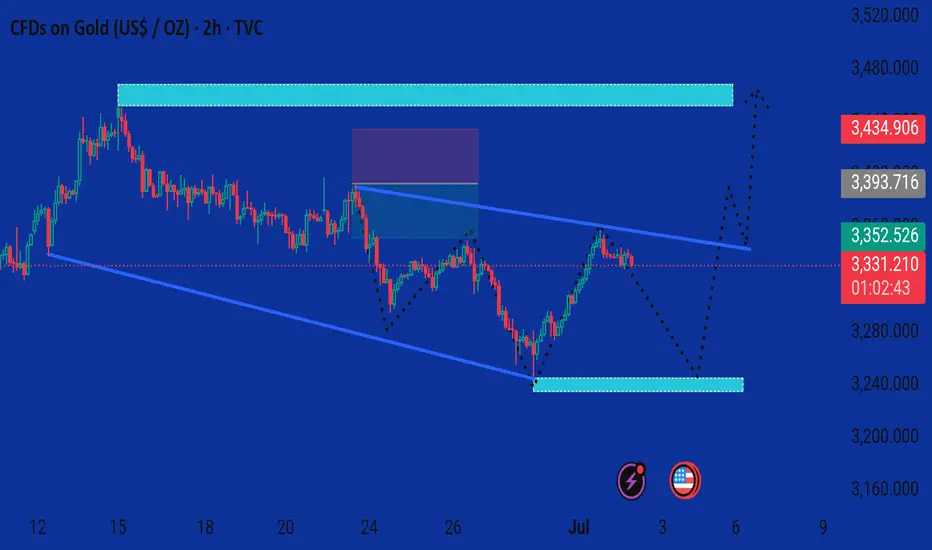
Xauusd market This chart presents a bullish analysis for Gold (CFDs on Gold, 2h timeframe), with the price currently at 3,332.110, showing a slight decline of 0.20%.
Key Observations:
1. Support Zone (~3,250):
A strong demand zone is highlighted near 3,250, where price previously rebounded.
This zone is marked with icons (lightning bolt and U.S. flag), possibly indicating high-impact news or events expected around that area.
2. Current Price Action:
Price recently broke a downtrend line and rallied.
Currently pulling back near the 3,330 level, indicating a potential short-term retracement.
3. Projected Scenarios (Dotted Lines):
Primary Path (Bearish Short-Term → Bullish Mid-Term):
Price may dip back into the 3,250 support zone.
From there, a bullish reversal is anticipated, targeting:
First resistance: ~3,400
Second resistance: ~3,450
4. Resistance Zones:
Two clear supply zones are marked:
~3,400: First target zone after a bounce.
~3,450: Final target zone if bullish momentum continues.
---
Summary:
The chart suggests a potential bullish continuation after a pullback. A retracement to around 3,250 could provide a strong buying opportunity with upside targets near 3,400–3,450, depending on price action and upcoming news catalysts.
Would you like a trading plan based on this setup (e.g., entry, stop-loss, targets)?
GOLD Massive Short! SELL!
My dear followers,
This is my opinion on the GOLD next move:
The asset is approaching an important pivot point 3350.4
Bias - Bearish
Safe Stop Loss - 3363.2
Technical Indicators: Supper Trend generates a clear short signal while Pivot Point HL is currently determining the overall Bearish trend of the market.
Goal - 3328.2
About Used Indicators:
For more efficient signals, super-trend is used in combination with other indicators like Pivot Points.
Disclosure: I am part of Trade Nation's Influencer program and receive a monthly fee for using their TradingView charts in my analysis.
———————————
WISH YOU ALL LUCK
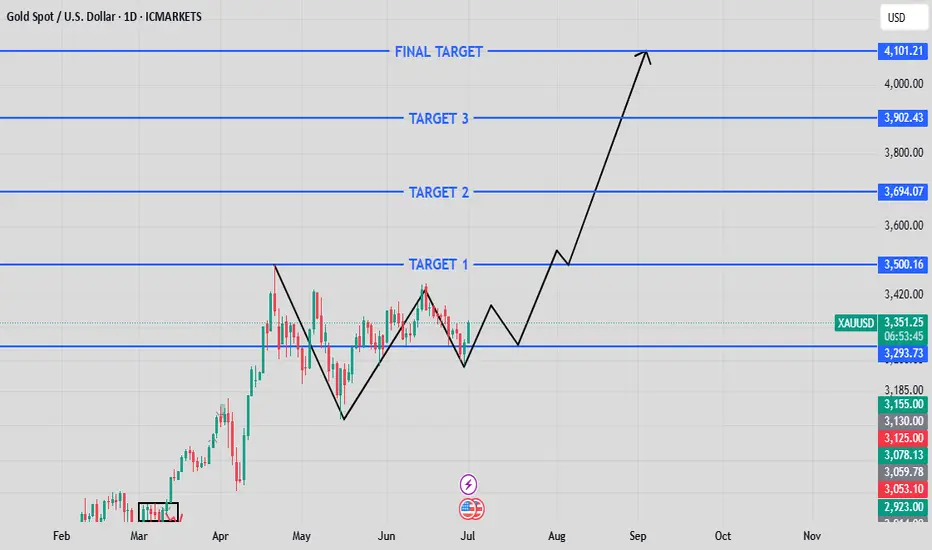
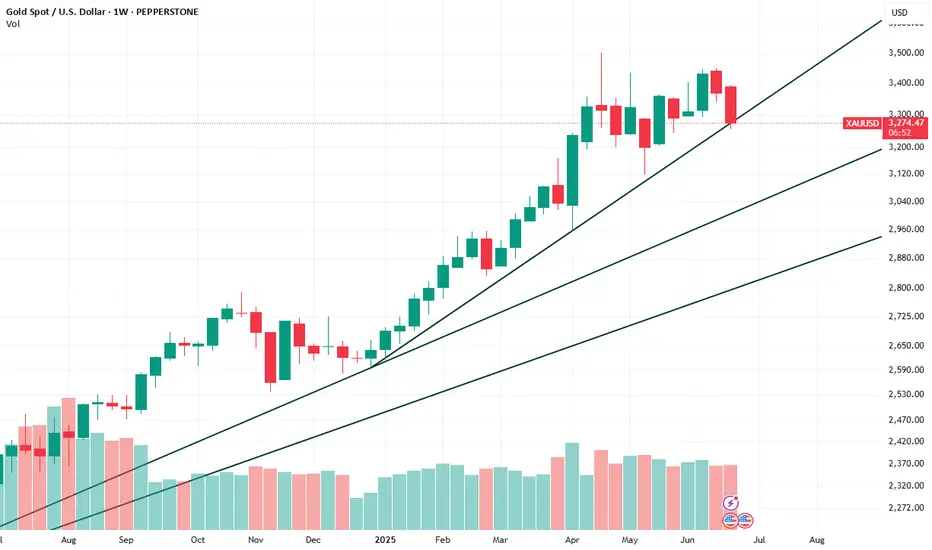
XAUUSD MONTHLY/WEEKLY ANALYSISWhat we’re seeing here on **XAUUSD (Gold Spot)** is a **classic higher-timeframe accumulation pattern** followed by **a potential explosive bullish leg**.
After a strong move up in April, we witnessed a **textbook V-reversal**, consolidation, and now — **a higher low** forming around the \$3,290 zone. That’s our key demand level. 💥
✅ If this higher low holds and price starts pushing with volume, we may be gearing up for a **multi-phase breakout** with the following potential targets:
🔹 **Target 1:** \$3,500
🔹 **Target 2:** \$3,694
🔹 **Target 3:** \$3,902
🎯 **Final Target:** \$4,101+
This isn’t just a short-term scalp setup. This is a **position trade opportunity** for those with patience and precision. The structure is clean, momentum is returning, and the levels are marked.
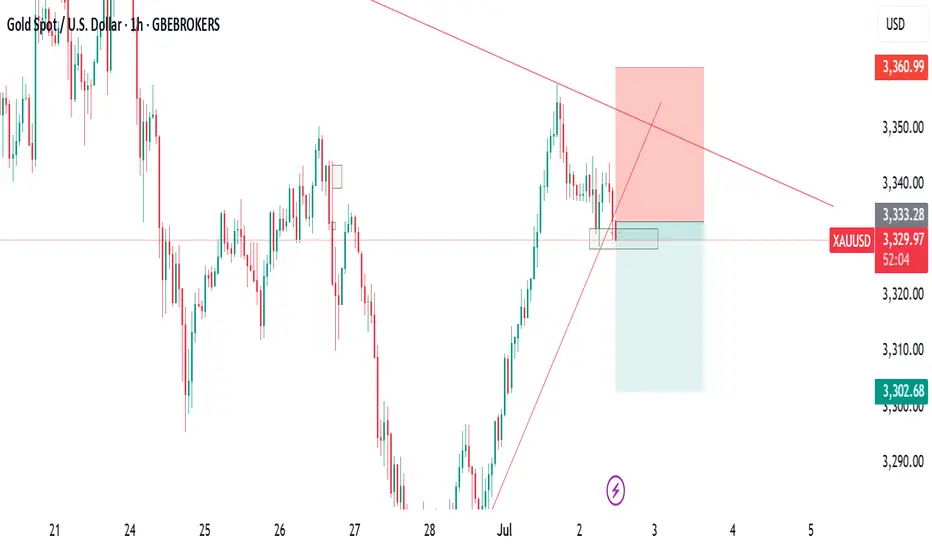
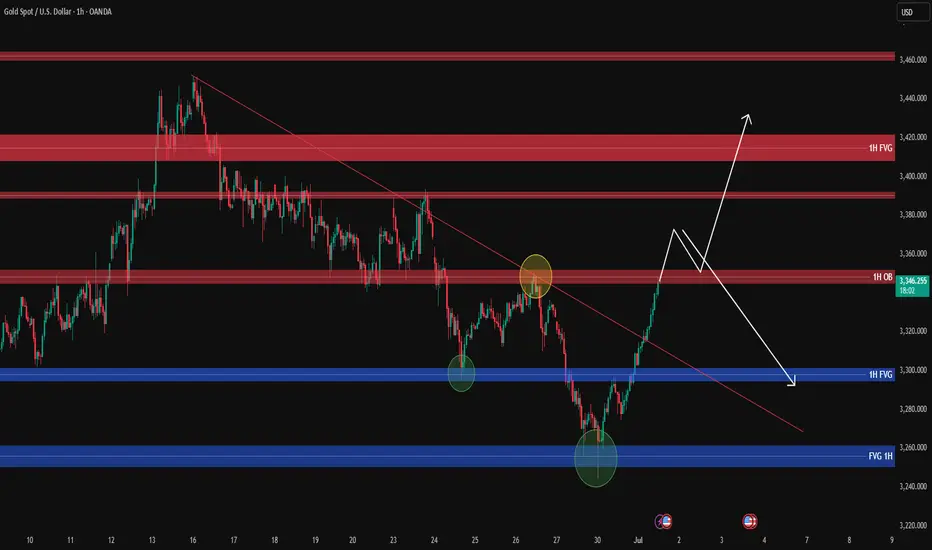
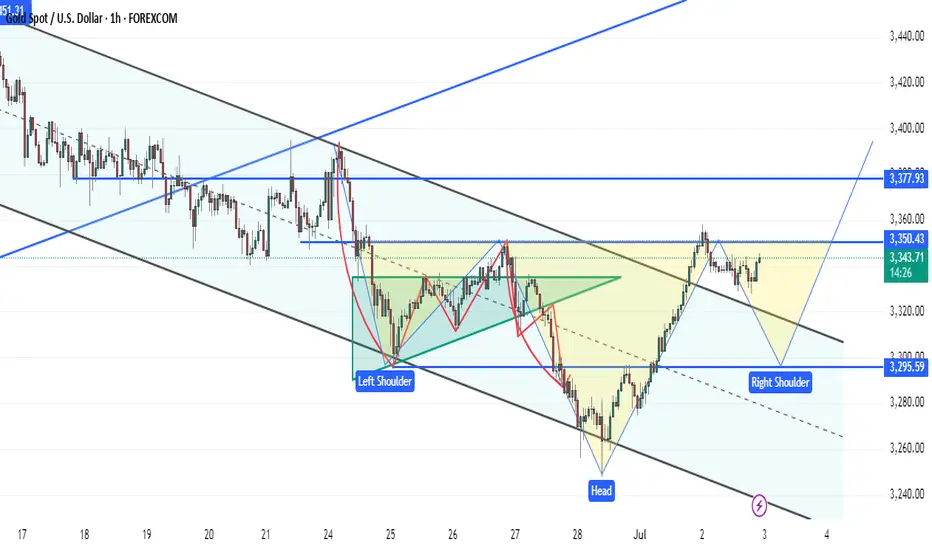
XAUUSD analysis - 1H FVG and OB SetupsBack after a few days with our gold update.
We’re on the 1-hour timeframe, and price has been respecting our levels perfectly, especially in the two blue boxes (1H FVGs) where we got precise reactions. These reactions are marked with green circles, showing areas where we entered on lower timeframes like 3m or 5m.
Currently, gold is sitting at a key area marked with a yellow circle (1H supply zone / resistance). If this area breaks strongly without a fakeout, we could potentially target higher resistance zones above.
Stay sharp and ready to catch clean reactions.
Key levels for confirmation:
3345-3358 (current important zone)
3300 (major 1H OB / support)
3420 (major 1H OB / resistance)
—
📊 ProfitaminFX | Gold, BTC & EUR/USD
📚 Daily setups & educational trades
📱 IG: @profitamin.fx
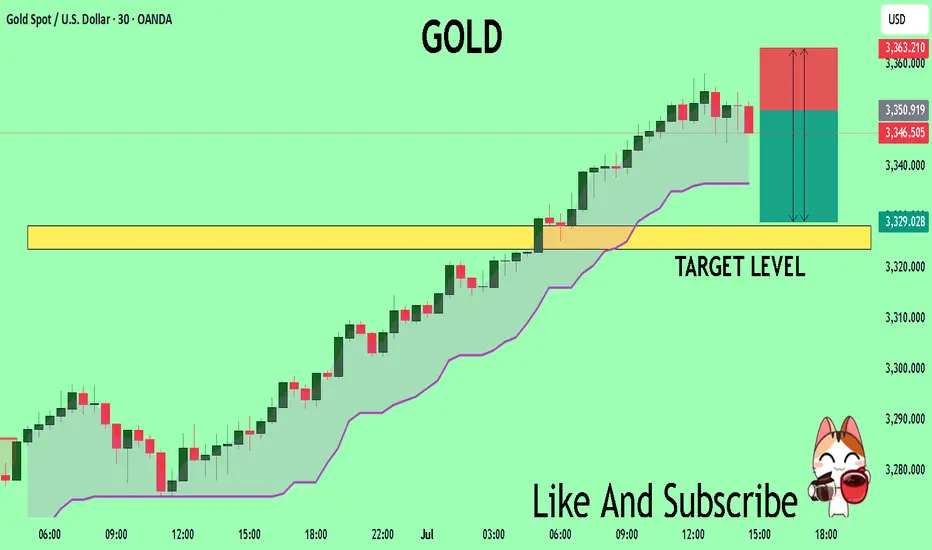
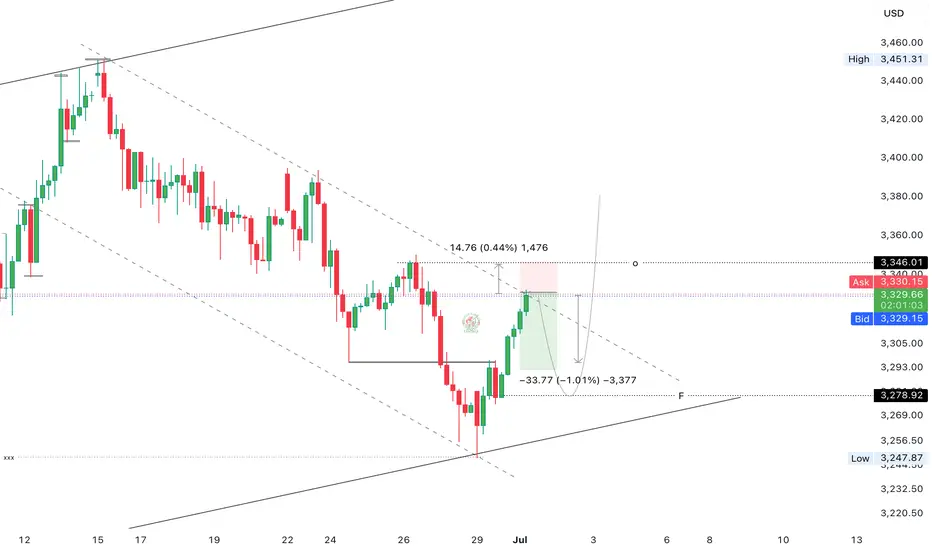
Gold Completes Move to 3330s, Poises for Second-Half ShiftGold market price fills through 3330's from 3270's, aligning with the second-half of the year’s candle formation. A bullish build-up is being poised around 3296, yet caution remains as price trades within a bearish channel between 3250’s and 3330’s. A breakout could signal a shift in market sentiment going forward. follow for more insights ,comment for more opinions , and boost idea
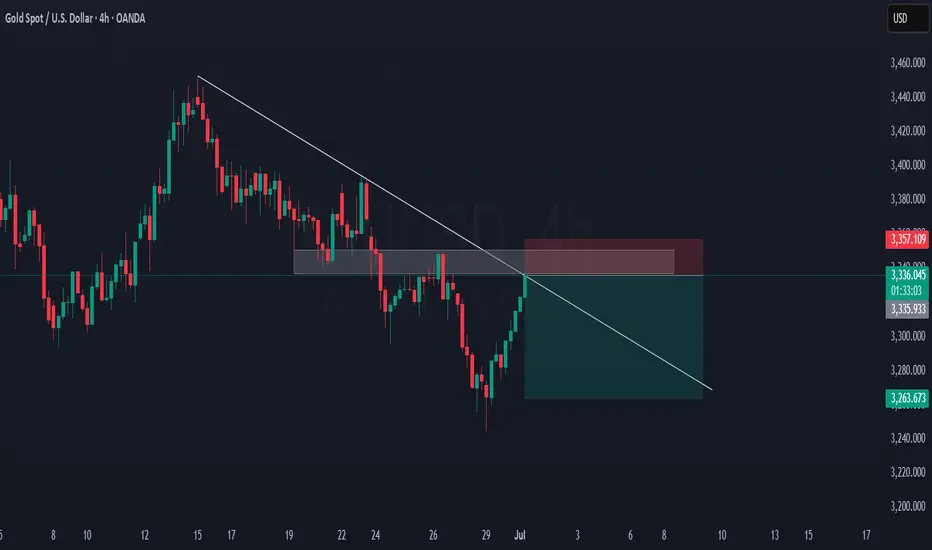
GOLD Sell OpportunityHey guys. Longer term outlook on Gold today.
The 4h chart is showing a short opportunity. You can see that it is following the trendline and price came back to test an area of interest.
I will suggest to look for entries on the 15min chart.
Good luck!
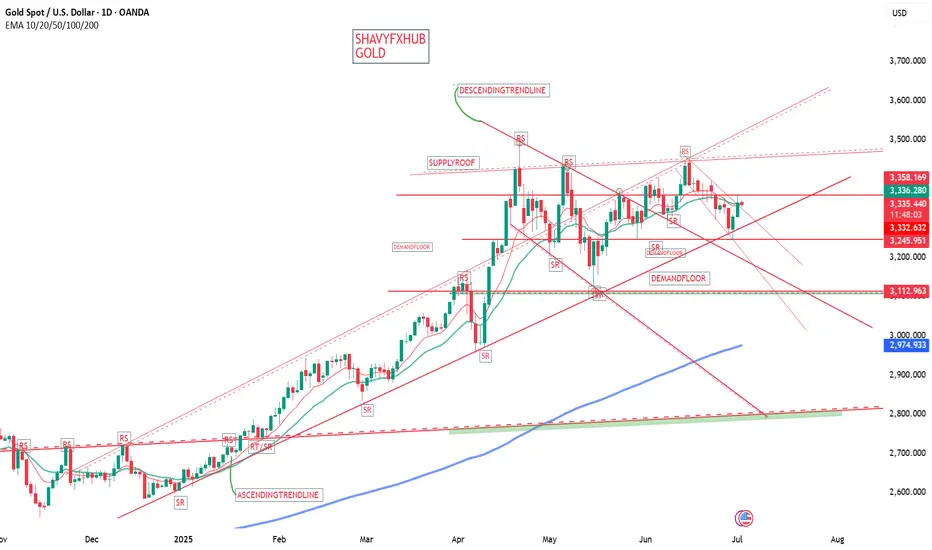
XAUUSD 4H – Full Technical & Fundamental Deep Dive🔷 Chart Structure & Trendlines
Since early June, gold has formed a clean descending channel on the 4‑hour chart. Each bounce and rejection has respected these channel edges, which reflect consistent lower highs and lower lows.
A long-term ascending trendline (from late March lows) was recently broken. This broken support has now flipped into resistance, and price is currently retesting it.
The intersection of the descending channel’s top, the trendline resistance, and the 200 EMA creates a major triple-confluence zone—a classic area of institutional interest.
🔷200 EMA
The 200 EMA on the 4H chart is acting as dynamic overhead resistance, which price is currently testing.
Historically, during bearish regime, retests of the 200 EMA from below often trigger strong rejections.
If price breaks above and holds, it would mark a significant shift in market sentiment. If rejected, it adds weight to the bearish trend.
🔷Fair Value Gap (FVG) & Supply Order Blocks
A Fair Value Gap (vicinity of $3,340–3,350) remains structurally unfilled from the previous breakdown.
Price is now re-entering that FVG region—an area often used by smart money to target liquidity and trap retail traders.
This is a logical zone for sell orders, as price frequently reacts where gaps exist.
🔷Volume Profile: High/Low Volume Nodes
A High-Volume Node (HVN) sits around $3,360, where most sustained trading has occurred. This acts as a strong resistance/distribution area.
The current zone ($3,330–3,340) is a low-volume pocket, meaning moves through here can be fast, but rejections are still frequently seen.
Below, there's another HVN around $3,280–3,290—a logical demand area and intermediate target for retracement.
🔷Fundamental Perspective – This Week to Friday
🔸 U.S. Fed Outlook & Dollar Dynamics
U.S. dollar is weak, with growing speculation on imminent Fed rate cuts, partly due to pressure from political sources
Fed remains cautious—no July cut likely, more probable in September
Persistent volatility in Fed messaging means gold remains in play as a hedge.
🔸 Geopolitical & Macro Drivers
Geopolitical tensions (Middle East, trade) continue to add safe-haven support
Central banks, especially Australia, are upping gold purchases—may add structural support
🔸 Market Sentiment & Investment Flows
ETF inflows remain robust—global central bank demand offsetting retail weakness
Some macro research houses expect sideways action into early July, with range likely between $3,200–3,350
🔸 Risks Ahead of Friday
Watch for U.S. jobs data, Fed speakers, and geopolitical headlines—any surprise could spark sharp moves.
If Fed hints at delays in rate cuts or geopolitical risk cools, gold could see a rapid reactive drop.
🔷🤔 Possible Scenarios into Friday
✅ Bearish Rejection
Price fails to clear $3,340–$3,360 zone.
A strong rejection candle retests $3,280–$3,290.
Could accelerate down to $3,240 if momentum picks up.
⚠️ Bullish Breakout
Clean, high-volume break above 200 EMA and $3,360 HVN.
Likely continuation to $3,380–3,400, especially if supported by fundamentals (e.g., inflation, Fed dovish pivot).
🔷My Personal Bias into Friday
Slight bearish lean due to triple resistance confluence.
Fundamentals are mixed: Fed caution supports gold structurally but no immediate catalyst.
I will monitor price action closely: a sharp rejection off the 200 EMA area would confirm suspicion; but a clean breakout would require reassessment.
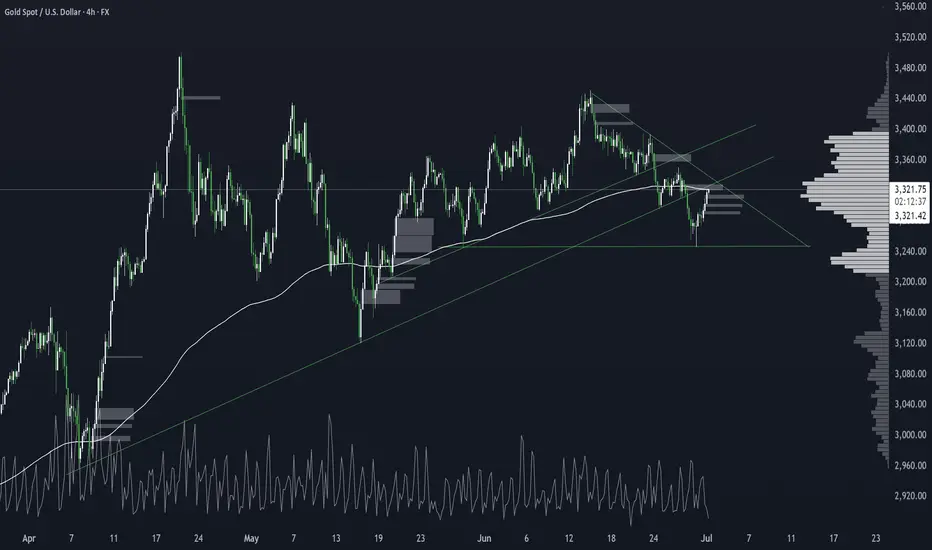
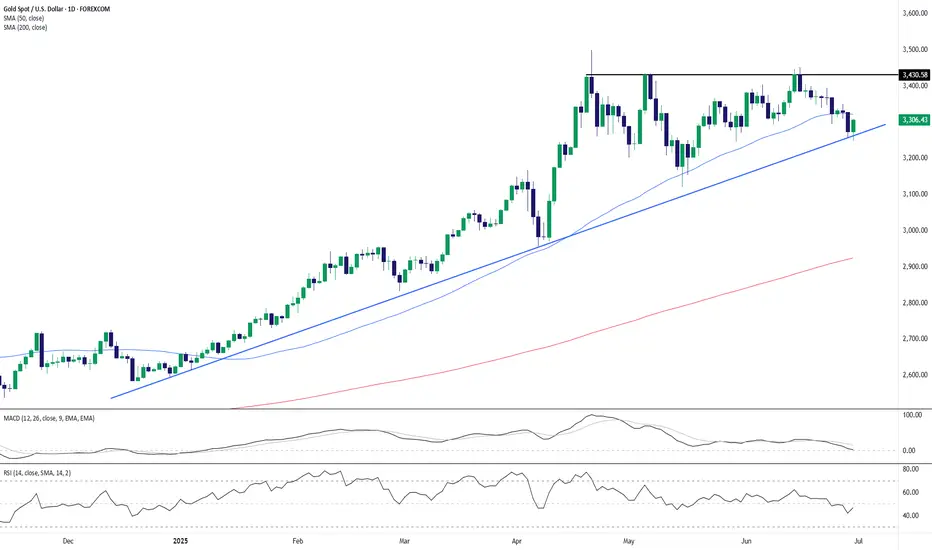
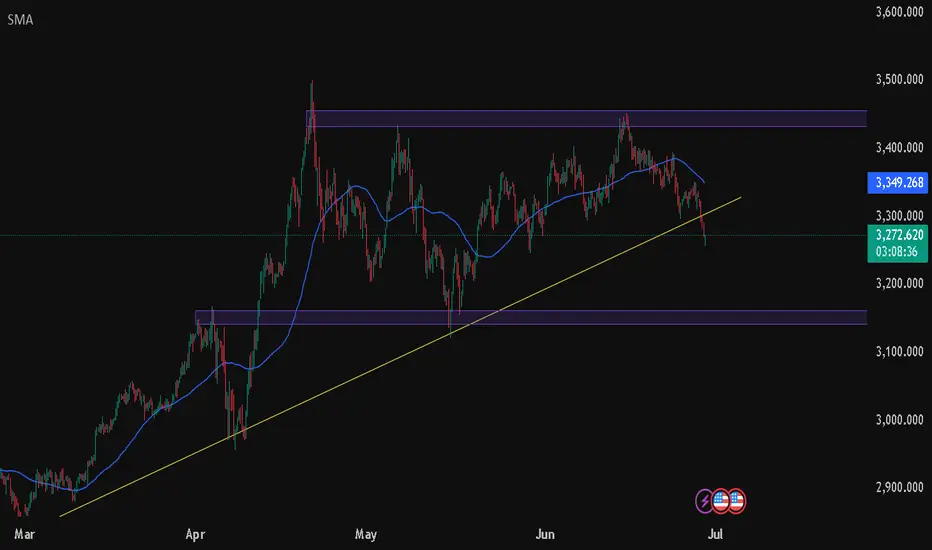
Gold Bounces Off Trendline as Bulls Defend Structure Ahead of $3Gold (XAU/USD) has rebounded sharply from its rising trendline support and 50-day SMA (around $3,221), suggesting that the broader bullish trend remains intact despite recent consolidation below the $3,430 resistance.
The uptrend from the December 2024 lows continues to hold, anchored by a sequence of higher lows and a clear ascending trendline. The recent dip toward the trendline was met with firm buying, resulting in a strong bullish candle on the daily chart. Price action now sets up a potential retest of the $3,430 horizontal resistance — a key level that has capped multiple rallies over the past few months.
Momentum indicators paint a mixed but improving picture. The RSI has bounced from just below 40 to 46.64, avoiding oversold territory and hinting at a potential momentum recovery. Meanwhile, the MACD remains in negative territory but is beginning to flatten, signaling a possible shift in short-term momentum.
A confirmed breakout above $3,430 would mark a resumption of the broader bullish leg and expose gold to new highs. However, a breakdown below trendline support would invalidate the current structure and shift focus toward the 200-day SMA near $2,924.
For now, the trendline bounce gives bulls the upper hand, keeping the upside scenario in play.
-MW
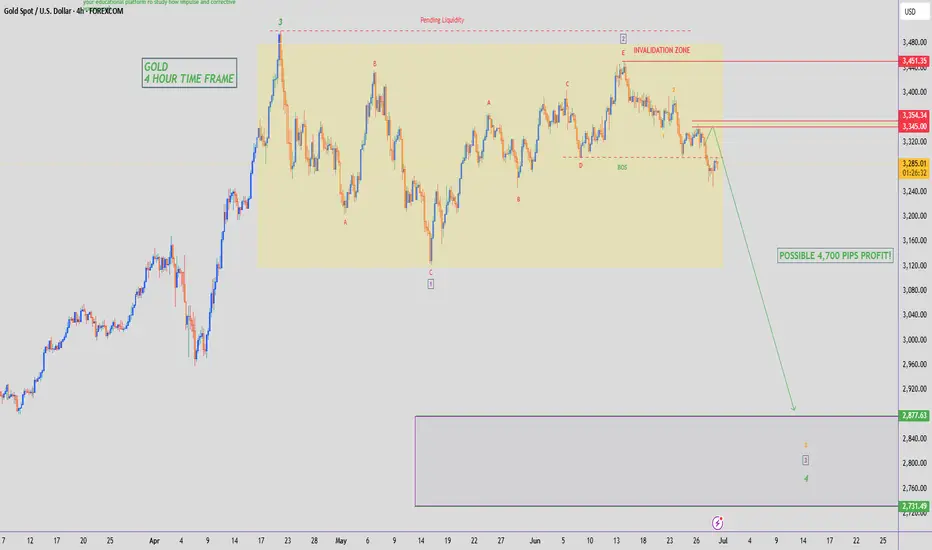
GOLD - SHORT TO $2,800 (UPDATE)As expected last week Gold climbed into our 'Supply Zone' of $3,347 & rejected as I said it would on our video analysis. It even managed to close below our 'BOS' zone.
The game plan this week is to keep an eye on market structure for further sells. With every pump up we should be looking at how price can sell off again & how we can join the sell trend to profit off it.

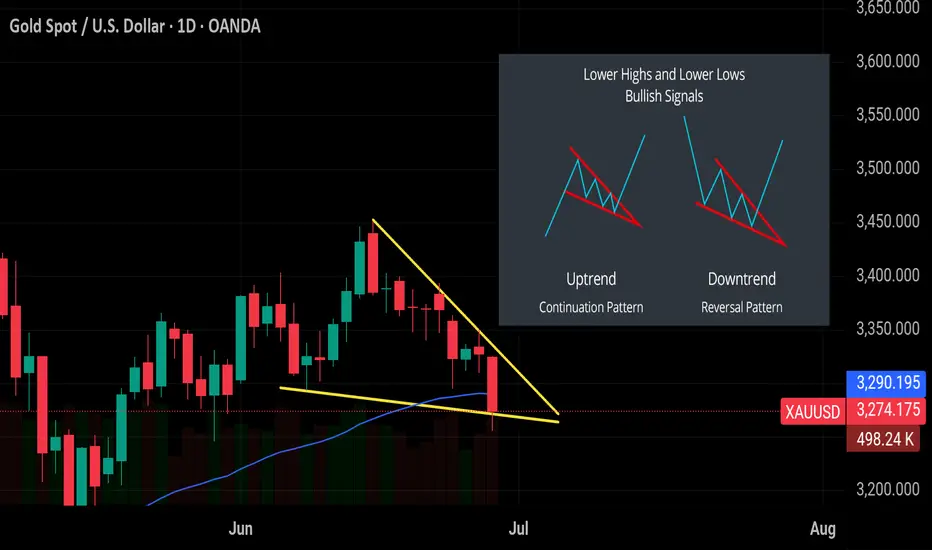
Falling Wedge: The Bullish Pattern Most Traders Miss Falling Wedge: The Bullish Pattern Most Traders Miss
A falling wedge is a bullish pattern that forms when price action contracts between two downward-sloping lines. Both highs and lows are getting lower, but the lower trendline declines more slowly. This shows that sellers are losing momentum.
There are two types of falling wedges:
🟢In an uptrend, it acts as a continuation pattern. The price pauses and consolidates before breaking out upward again.
🔴In a downtrend, it acts as a reversal pattern, often signaling a bottom before a trend change.
Both versions look similar on the chart — a narrowing wedge sloping down. The breakout usually happens to the upside. To trade it 👇
1️⃣Wait for a confirmed breakout above the upper resistance line.
2️⃣Look for strong volume on the breakout to confirm the move.
3️⃣You can enter on the breakout or wait for a retest of the trendline.
4️⃣Place your stop below the recent low.
5️⃣Set a target based on the height of the wedge.
Falling wedges work best in strong trends and become more reliable the longer they form ✍️
#FAQ
Is this the end of the bears of XAUUSD?2 weeks in a row, the sellers were in control. The downward force this week is strong. The possibility of a further drop in the future is highly probable. However, there's also a potential recovery next week. Overall, it's still an uptrend; however, I won't ignore the new LH that formed this week as well.
XAUUSDGold has been under pressure from the Fed's cautious stance on rate cuts amid strong US employment data, the recovery of the US Dollar, and rising bond yields. Additionally, the relative easing of Iran-Israel tensions in the Middle East has weakened safe-haven demand and increased selling pressure.
Technically, a break below the yellow rising trend line of around 3,290-3,300, loss of EMA50 support, RSI below 50, and weakening momentum on MACD suggest a bearish scenario.
Therefore, gold may retreat to the 3,260-3,240 range, and if the breakout continues, 3,200-3,210 or even 3,130-3,100 levels can be targeted
However, if there is a reaction in the 3,260-3,280 support band, accompanied by a recovery in the RSI and MACD indicators, a rebound scenario towards 3,340-3,350, 3,430-3,450 in case of a break above 3,430-3,450 - eventually 3,500 may come into play.
QQQ, SPY, NVDA & GOLD Daily Trade SetupsIn this update we review the price action in the QQQ, SPY, Nvidia & Gold and identify the next high-probability trade setups and price objectives to target. To review today's video analysis, click here!

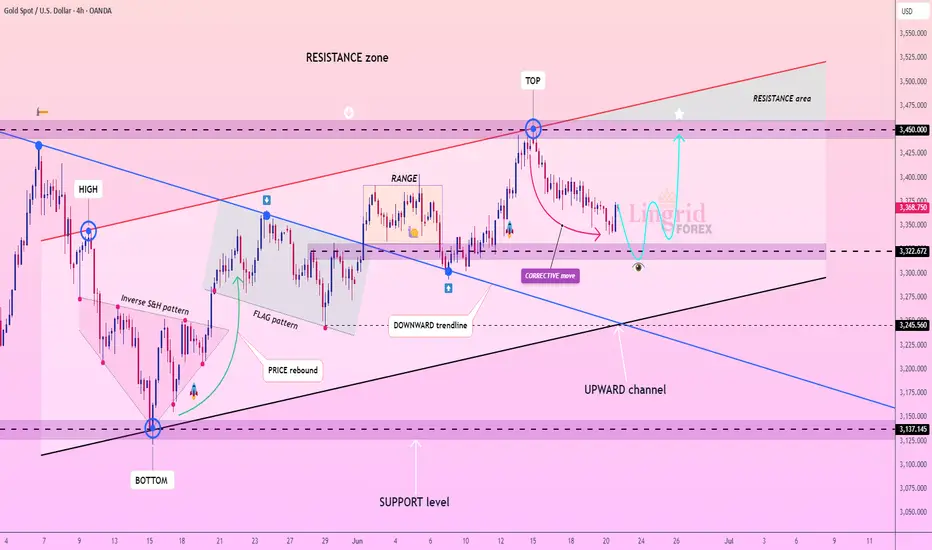
Lingrid | GOLD Weekly Outlook: Corrective Phase Tests SupportOANDA:XAUUSD experienced a notable pullback this week, retreating from the $3,450 resistance zone as profit-taking emerged following the recent geopolitical rally. The market appears to be entering a healthy corrective phase after the strong upward momentum driven by Middle Eastern tensions and safe-haven demand.
The 4H chart reveals gold testing the critical $3,320 support level, which coincides with the lower boundary of the established upward channel. This corrective move was anticipated after the sharp rally to the resistance area marked as "TOP" on the chart. The current price action suggests a natural retracement within the broader bullish structure.
Technically, the downward trendline from the recent high is being respected, indicating the correction may continue toward the $3,240-$3,270 range before finding stronger support. The flag pattern that previously drove the rally now serves as a reference point for this pullback phase.
Key levels to monitor include the $3,320 immediate support and the more substantial $3,200 level below. A decisive break below these supports could extend the correction further, while a bounce from current levels would reinforce the underlying bullish bias. The market remains within the broader upward channel, suggesting this correction is likely temporary before the next leg higher toward the resistance zone above $3,450.
Traders, if you liked this idea or if you have your own opinion about it, write in the comments.
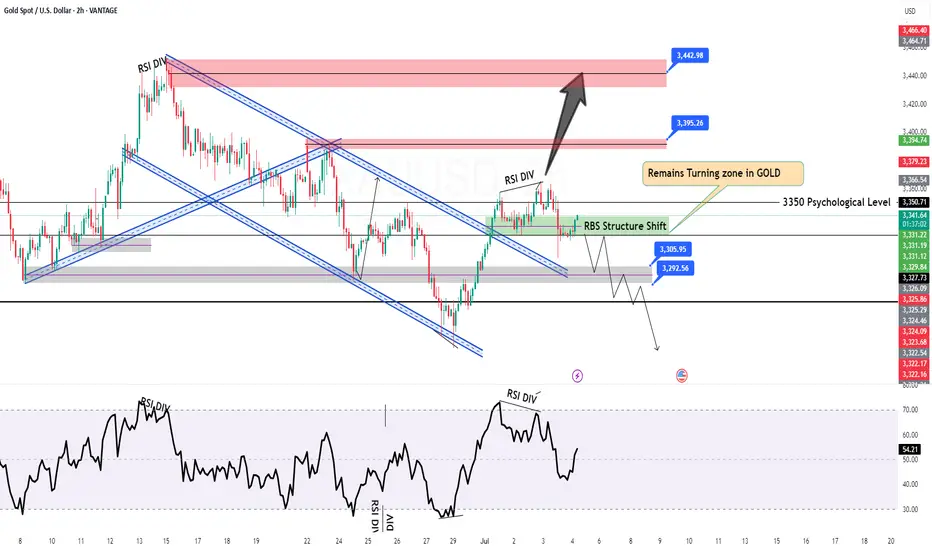
GOLD H2 Intraday Chart Update For 4 July 2025As you can see that GOLD is still in consolidation range above 3300 Psychological Level
Currently prices are still standing @ 3340 nearby Psychological Level, only if market breaks 3368 clearly then it will consider Bullish other below 3368 market still in Bearish Move
Reminder: Today is US Bank Holiday
Disclaimer: Forex is Risky
How I Lost -$837 Trading GoldYou have to understand everyday is different in the markets control your emotions bounce back and play smarter

Tariff shadow and gold's safe-haven game
This week, market sentiment was stirred up and down by Trump's tariff stick. This unconventional president, while firing at Canada and Japan, let the July 9 tariff deadline hang like a knife over the heads of risky assets. If the suspension order is not extended, the market may have to relive the chaos of "Liberation Day" in April - gold will become the "safe-haven spare tire" at this time.
Although the situation in the Middle East has cooled down, gold has stabilized at $3,340 due to the weakness of the US dollar and tariff anxiety. After falling to 3,245 at the beginning of the week, it rebounded quickly, and the bulls were briefly revelry, but the real test will be on Thursday's non-agricultural data - whether it will rush to 3,400 or return to 3,300, it all depends on the face of the US dollar and Trump's next move. If the tariff powder keg is ignited, gold will rise; if it is postponed, this precious metal is afraid to "fall out of favor" again.
Technically, the daily line is long, with short-term support at 3,330-3,336 and resistance at 3,358-3,365. In terms of operation, continue to follow the trend and buy low at night, ambush near 3336-3330, and look at 3400 if it breaks.
The script of gold always switches between "panic" and "greed" - and Trump may be the most competent "director" at the moment.
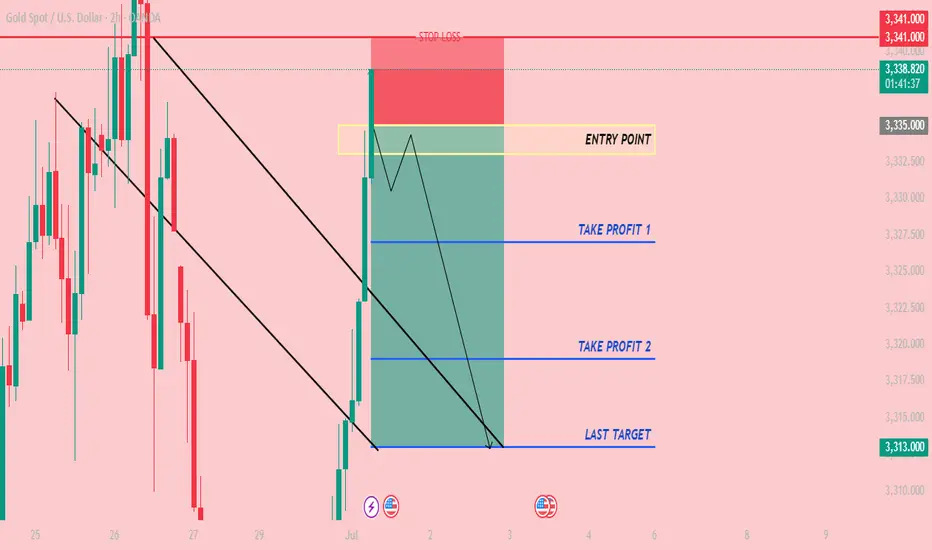
CHECK XAUUSD SIGNAL READ CAPTAINxauusd ) sell zone
( trade satup)
entry point (3335) to (3333) 📊
first tp (3327)📊
2nd target (3319) 📊
last target (3313) 📊
stop loss (3341)❌