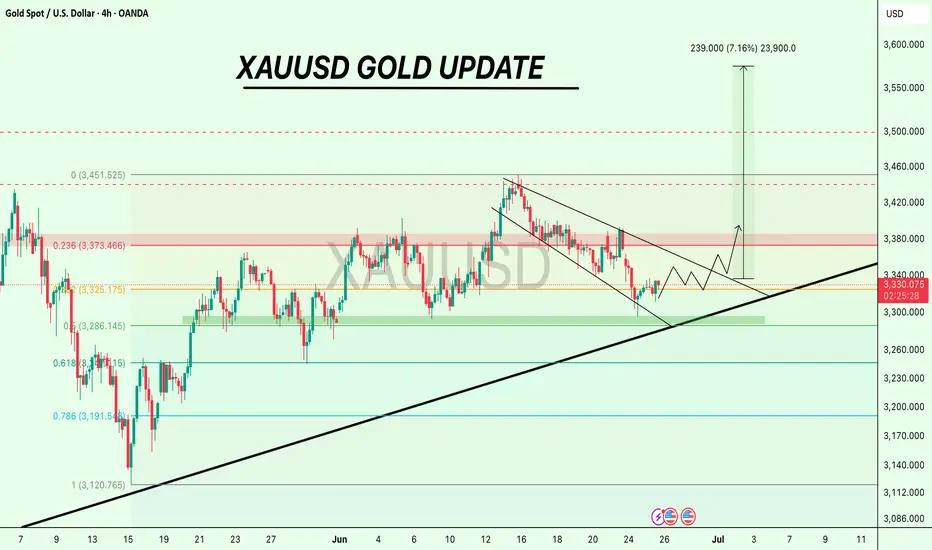
Gold remains strong, and we continue to buy on pullbacks!ADP employment unexpectedly turned negative, and the probability of a rate cut increased again
The ADP employment report released on the same day showed that the number of private sector jobs in the United States decreased by 33,000 in June, the first net loss since March 2023, and the May data was also significantly revised down to +29,000. After the release of the ADP data, the probability of the Federal Reserve's interest rate cut in July quickly rose from 20% before the data was released to about 27.4%. The market's bet on a rate cut before September has almost been fully factored in, and federal funds futures also show that the possibility of a 50 basis point rate cut has risen to 22%.
This "frown-making" data released a strong signal of cooling in the labor market before Thursday's non-farm report. If today's non-farm continues to be weaker than expected, it may force the Federal Reserve to act faster.
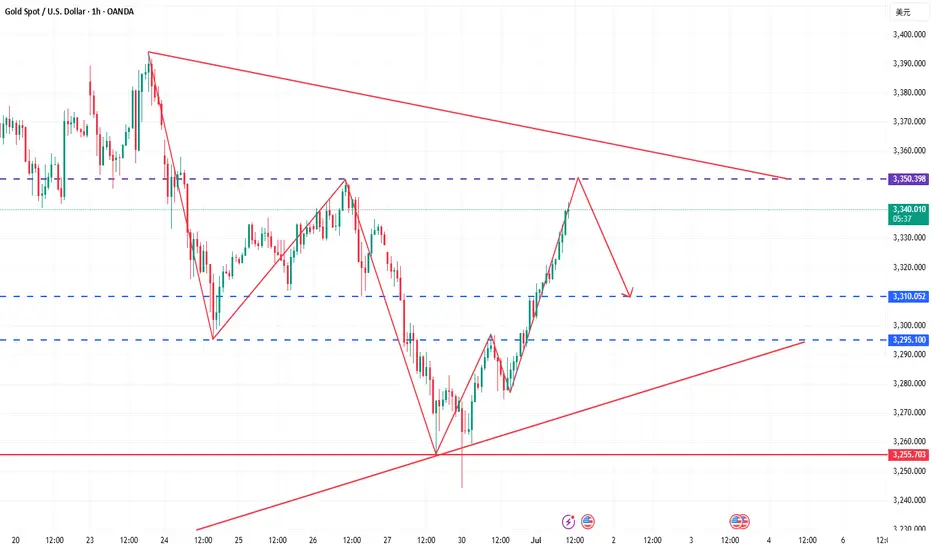
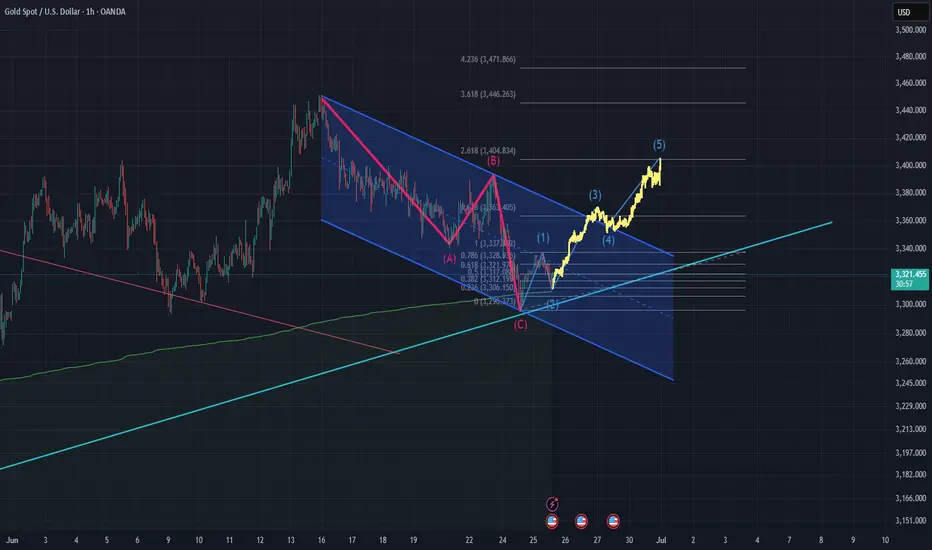
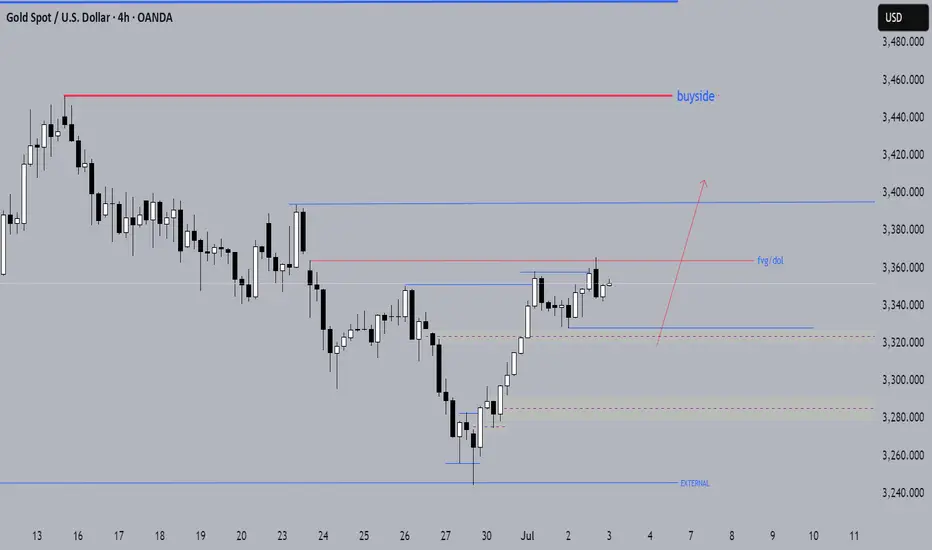
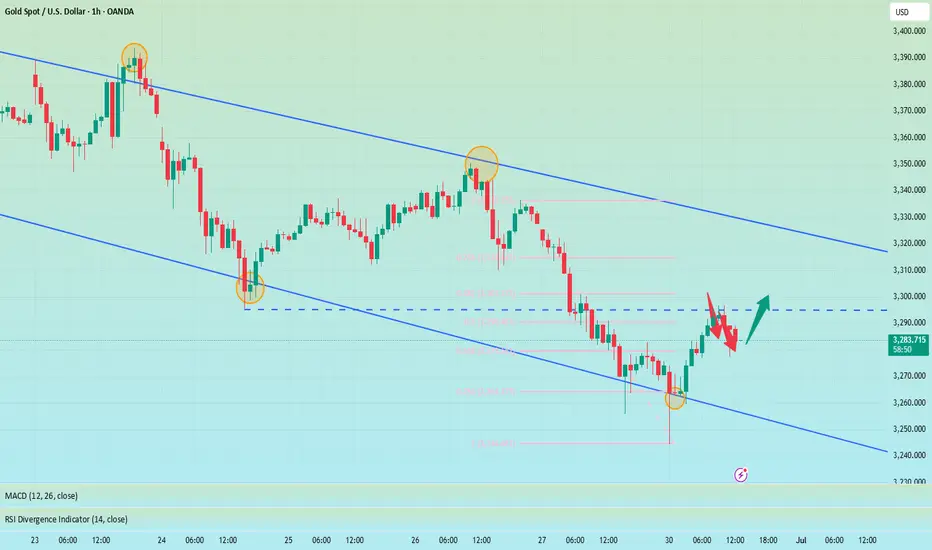
Gold opened high and then retreated continuously. From the daily chart, gold is still in an upward trend in the long term. The previous market rebounded effectively after touching the downward trend line, and the rebound force was considerable. With the restart of the bullish force, the main idea can carry the trend and do more on dips. In addition, from the 4-hour chart, gold has broken through the previous downward trend line and has gone out of the V-shaped reversal pattern, which means that the previous short-term downward trend has ended. At present, a new trend is also opening up in the 4-hour chart. The rise of gold has also established an upward trend line. You can consider buying on dips based on the upward trend line 3332. However, due to insufficient bottoming time in the previous stage, it may still face the risk of decline, so you should set the stop loss with caution. From the 1-hour chart, gold fell after opening high, and the bullish trend remains unchanged. The points for long orders can consider 3334 and 3328.
Gold operation suggestions: Go long on gold near 3325-3335, with a target of 3350-3360.
XAUUSD.F trade ideas
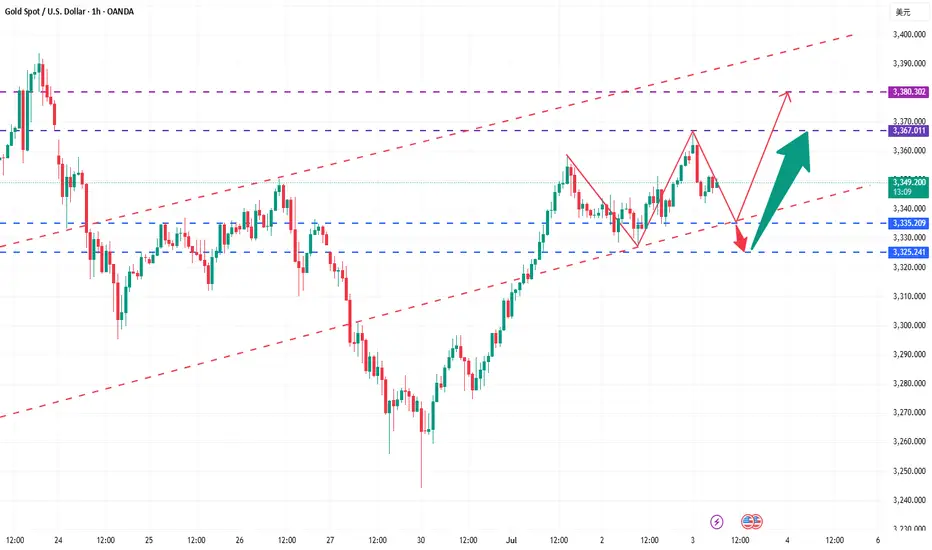
Gold Gains Strength as the Dollar Wobbles – What’s Next?Hello, my dear friends – let’s take a fresh look at gold after yesterday’s moves!
At the moment, gold is trading steadily around 3,345 USD as the market awaits tonight’s highly anticipated U.S. Nonfarm Payrolls report. Yesterday’s ADP data caused a mild shake in sentiment, showing the first drop in private sector employment in over two years. This immediately fueled expectations that the Federal Reserve could move to cut interest rates sooner than expected — putting pressure on the U.S. dollar and offering support to gold as a non-yielding safe haven.
Meanwhile, the DXY (U.S. Dollar Index) has slipped to its lowest level in nearly three years, making dollar-denominated assets like gold more attractive to international investors. On top of that, lingering geopolitical tensions and ongoing strong central bank buying continue to reinforce gold’s role as a long-term store of value.
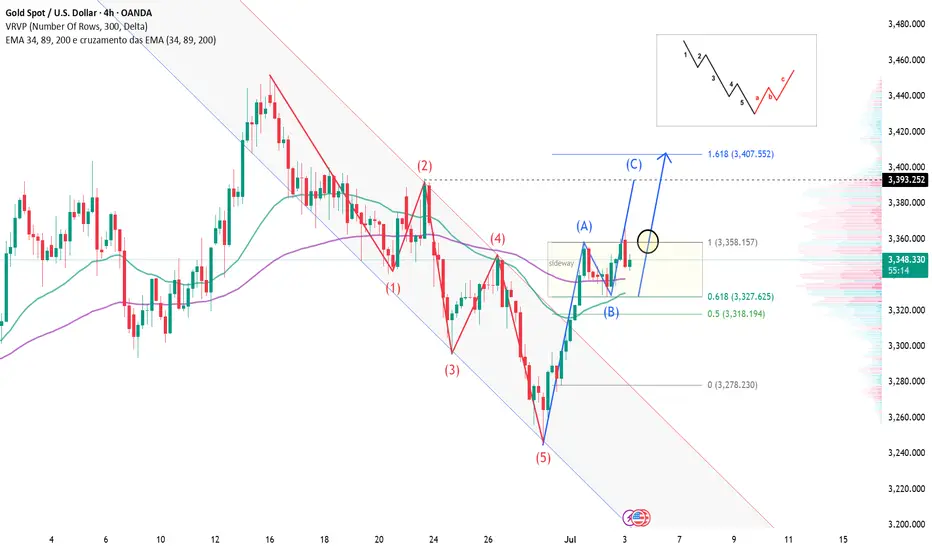
From a technical perspective on the H4 timeframe, gold is showing a very tight structure after breaking out of a prolonged downtrend channel. Price is currently consolidating between 3,330 and 3,360 USD, with a clearly defined bullish formation: higher highs and higher lows — a strong signal that the uptrend is starting to take shape again.
The key level to watch now is 3,358 USD. If price breaks above this level with convincing buying momentum, I expect gold to enter a new bullish leg toward 3,390 – 3,407 USD, aligning with the Fibonacci 1.618 extension — often a magnet for price during strong trends. On the other hand, if there’s a short-term pullback, the support zone around 3,327 – 3,318 USD will be critical, offering a potential re-entry point for buyers looking to ride the next wave up.
This is not a phase for impulsive decisions — but it’s definitely not a moment to be passive either. The breakout could come fast, and only prepared traders will be ready to act.
Gold move Account to my analysis this move possible gold running caratly said war and selling area 3300 o reach 3270
Weekly Analysis on GOLDFor next week trading session i will be looking for sell trade opportunities this is because of how candles are closing on daily and weekly timeframe.
The bearish trend is confirmed, it’s time to participate.Gold overnight short orders have been stopped at a loss, because it broke through the key pressure of 3325. However, we must grasp the trend of the market, adhere to the idea of technical analysis as the main and news as the auxiliary, and make a comprehensive judgment. Don't be at a loss about the market analysis because of the stop loss. There is nothing wrong with waiting for the market to step back and do more, but the market does not give opportunities, but forces you to chase the rise. Of course, from the perspective of risk ratio, high altitude is definitely more stable than chasing more.
From the current gold trend analysis, the focus on the upper side is the 3340-3350 line of pressure, the short-term support on the lower side is around 3310-3320, and the key support on the 3295-3301 line is focused. Relying on this range as a whole, the main tone of high-altitude and low-multiple participation remains unchanged. In the middle position, it is recommended to wait and see, chase orders cautiously, and wait patiently for key points to enter the market.
Operation strategy 1: Short gold near 3340-3350, target 3325-3315.
Operation strategy 2: Go long on gold around 3310-3320, target 3330-3340.
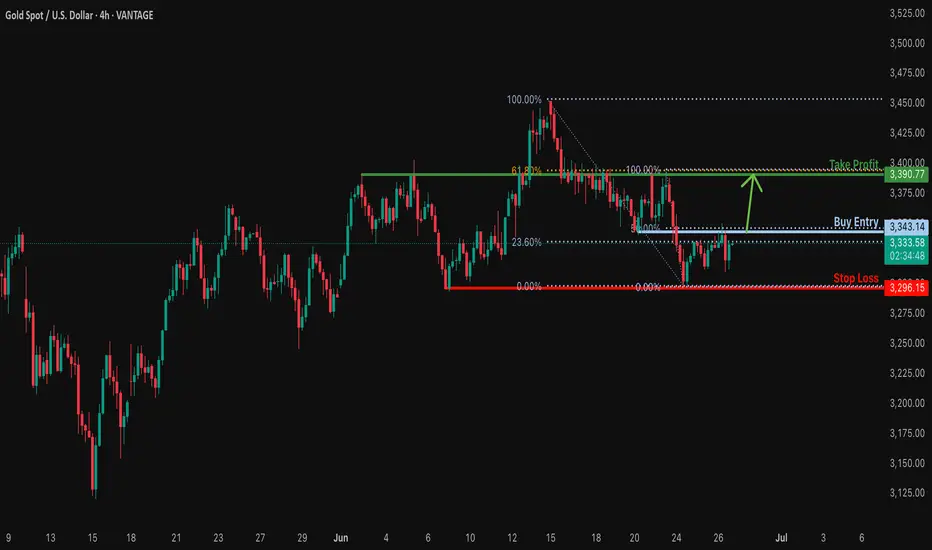
Bullish breakout for the Gold?The price is reacting off the resistance level which is a pullback resistance that aligns with the 50% Fibonacci retracement and a breakout of this level could lead the price from this level to our take profit.
Entry: 3,343.14
Why we like it:
There is a pullback resistance level that lines up with the 50% Fibonacci retracement.
Stop loss: 3,296.15
Why we like it:
There is a pullback support level.
Take profit: 3,390.77
Why we like it:
There is a pullback resistance level that aligns with the 61.8% Fibonacci retracement.
Enjoying your TradingView experience? Review us!
Please be advised that the information presented on TradingView is provided to Vantage (‘Vantage Global Limited’, ‘we’) by a third-party provider (‘Everest Fortune Group’). Please be reminded that you are solely responsible for the trading decisions on your account. There is a very high degree of risk involved in trading. Any information and/or content is intended entirely for research, educational and informational purposes only and does not constitute investment or consultation advice or investment strategy. The information is not tailored to the investment needs of any specific person and therefore does not involve a consideration of any of the investment objectives, financial situation or needs of any viewer that may receive it. Kindly also note that past performance is not a reliable indicator of future results. Actual results may differ materially from those anticipated in forward-looking or past performance statements. We assume no liability as to the accuracy or completeness of any of the information and/or content provided herein and the Company cannot be held responsible for any omission, mistake nor for any loss or damage including without limitation to any loss of profit which may arise from reliance on any information supplied by Everest Fortune Group.
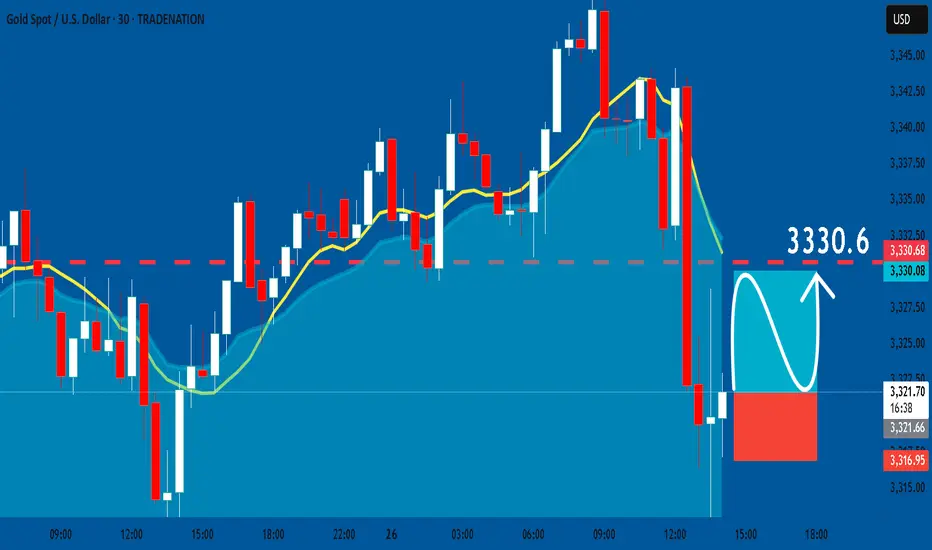
GOLD: Long Trade with Entry/SL/TP
GOLD
- Classic bullish setup
- Our team expects bullish continuation
SUGGESTED TRADE:
Swing Trade
Long GOLD
Entry Point - 3321.6
Stop Loss - 3316.9
Take Profit - 3330.6
Our Risk - 1%
Start protection of your profits from lower levels
Disclosure: I am part of Trade Nation's Influencer program and receive a monthly fee for using their TradingView charts in my analysis.
❤️ Please, support our work with like & comment! ❤️
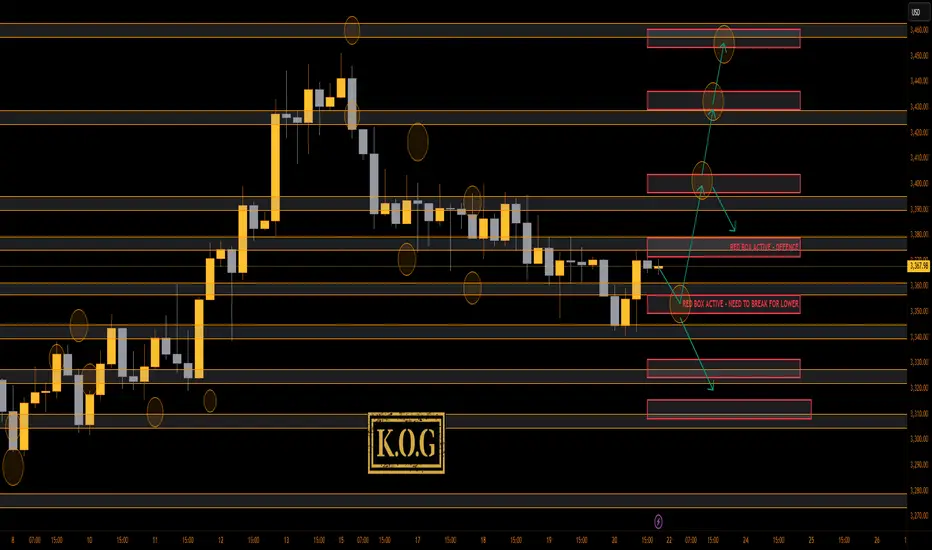
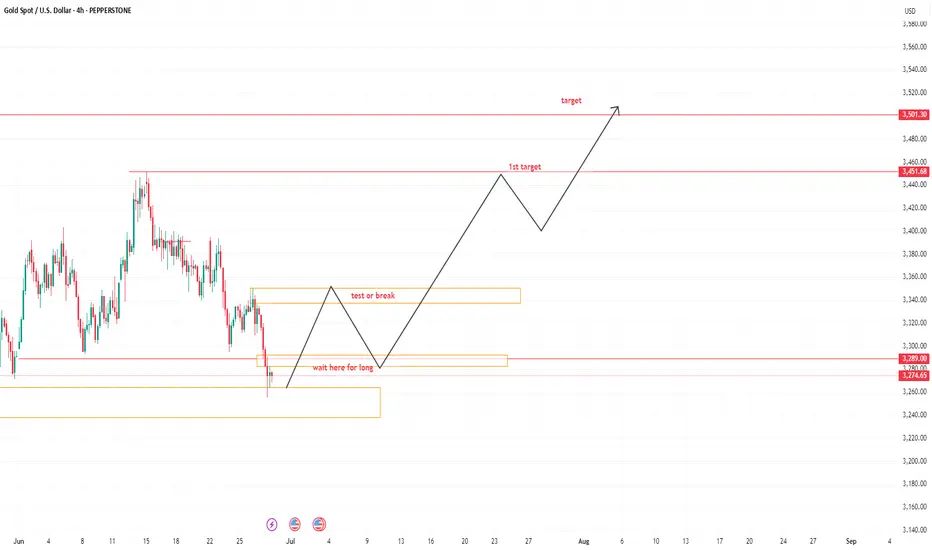
THE KOG REPORTTHE KOG REPORT:
In last week’s KOG Report we said we would be ideally be looking for the market to open, give us a high into that red box region 3455-60 and then give the reaction we wanted for the short trade. We didn’t quite hit that level falling just shy, but the move did present itself and as you can see all the bearish below red box targets were completed as well as KOG’s bias of the week targets which was bearish below 3465.
We then posted the FOMC KOG Report in which we suggested looking for price to continue the move as long as the bias level stood, which it did and we got another move downside, but again, falling just shy of the level we wanted to then attempt that swing long.
So, what can we expect in the week ahead?
As we suggested on Friday, it would be a good idea for traders to be sitting neutral on the markets with minimum to zero exposure anticipating gaps and glitches across the markets on open. This news was expected so those who played discipline should be cash in account, which is also a position in the markets.
We have key levels now 3350-55 support with extension 3340 which will need to break downside for us to go lower, while support there should take us up towards the 3385-90 level initially, which is the level to look for a potential RIP for the scalp short. This will give us the flip, red box activation 3380-75 which if held should allow us to complete the move to break through the 3400 level with red box target 3445 and above that 3451. This is based on there being a completely aggressive move from the open upside.
On the flip, break below key level here 3335 and 3320 is the first level to consider which will continue the path we wanted from last week. Ideally, not for this news and potential for this to spike upside, we would have stuck with the plan from last week. Difference now, we need more buyers higher up and a potential test on that high again.
Key Levels:
Red box defence 3375-80, needs to be broken
Red box defence 3350, needs to be broken
KOG’s bias of the week:
Bullish above 3340 with targets above 3375, 3390, 3395 and above that 3410
Bearish on break of 3340 with targets below 3330, 3320, 3310, 3306 and below that 3298
RED BOX TARGETS:
Break above 3375 for 3378, 3390, 3395, 3406, 3410 and 3419 in extension of the move
Break below 3365 for 3355, 3350, 3340, 3336, 3330 and 3323 in extension of the move
Please do support us by hitting the like button, leaving a comment, and giving us a follow. We’ve been doing this for a long time now providing traders with in-depth free analysis on Gold, so your likes and comments are very much appreciated.
As always, trade safe.
KOG
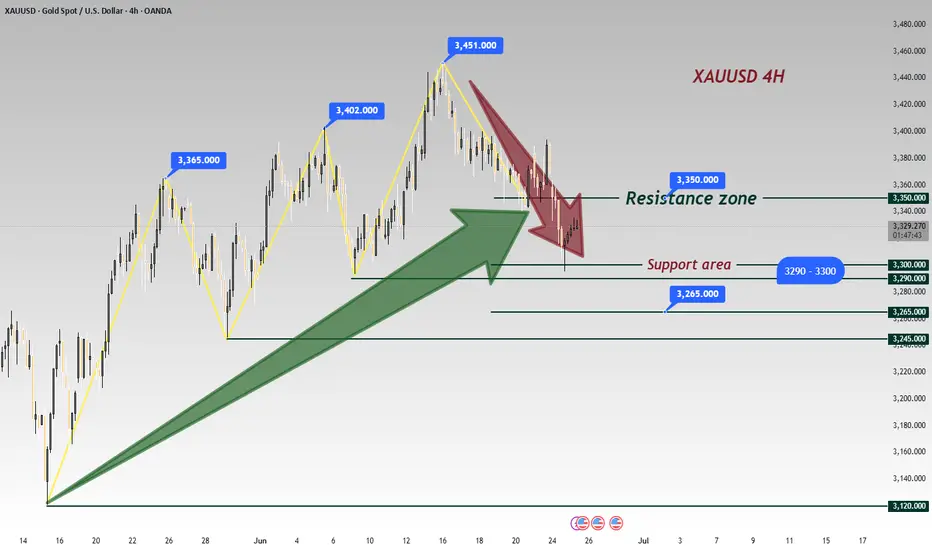
The Direction After Sideways Fluctuation at 3330Trump's announcement of an Israel-Iran ceasefire dented safe-haven sentiment, curbing safe-haven buying 🛑. Gold opened with a sharp plunge, then extended losses as Powell later stated that more time is needed before considering rate cuts—dovish expectations eased, sending gold further lower ⬇️. The price briefly fell below the 3,300 level, nearing 3,295 at its lowest, but failed to breach the 3,290-3,300 support zone 📊. As I indicated yesterday, traders could test rebound strength near support; once news impacts faded, gold rebounded to close at 3,323 🔄.
Currently trading sideways around 3,330, gold faces resistance at 3,350 while downside support remains at 3,290-3,300 📈📉. We therefore maintain a bearish stance
⚡️⚡️⚡️ XAUUSD ⚡️⚡️⚡️
🚀 Sell@3345 - 3335
🚀 TP 3325 - 3315 - 3305
Accurate signals are updated every day 📈 If you encounter any problems during trading, these signals can serve as your reliable guide 🧭 Feel free to refer to them! I sincerely hope they'll be of great help to you 🌟 👇
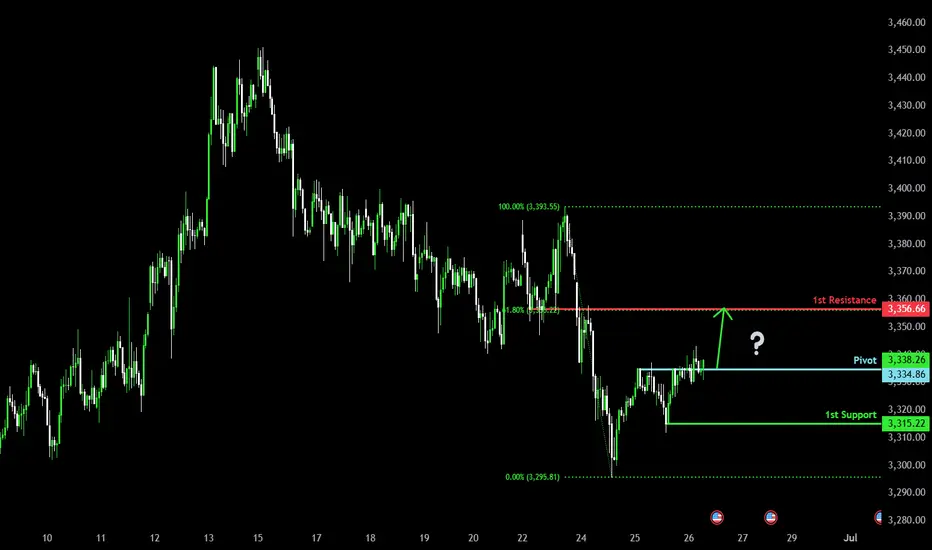
Potential bullish rise?The Gold (XAU/USD) is reacting off the pivot and could rise to the 1st resistance.
Pivot: 3,334.86
1st Support: 3,315.22
1st Resistance: 3,356.66
Risk Warning:
Trading Forex and CFDs carries a high level of risk to your capital and you should only trade with money you can afford to lose. Trading Forex and CFDs may not be suitable for all investors, so please ensure that you fully understand the risks involved and seek independent advice if necessary.
Disclaimer:
The above opinions given constitute general market commentary, and do not constitute the opinion or advice of IC Markets or any form of personal or investment advice.
Any opinions, news, research, analyses, prices, other information, or links to third-party sites contained on this website are provided on an "as-is" basis, are intended only to be informative, is not an advice nor a recommendation, nor research, or a record of our trading prices, or an offer of, or solicitation for a transaction in any financial instrument and thus should not be treated as such. The information provided does not involve any specific investment objectives, financial situation and needs of any specific person who may receive it. Please be aware, that past performance is not a reliable indicator of future performance and/or results. Past Performance or Forward-looking scenarios based upon the reasonable beliefs of the third-party provider are not a guarantee of future performance. Actual results may differ materially from those anticipated in forward-looking or past performance statements. IC Markets makes no representation or warranty and assumes no liability as to the accuracy or completeness of the information provided, nor any loss arising from any investment based on a recommendation, forecast or any information supplied by any third-party.
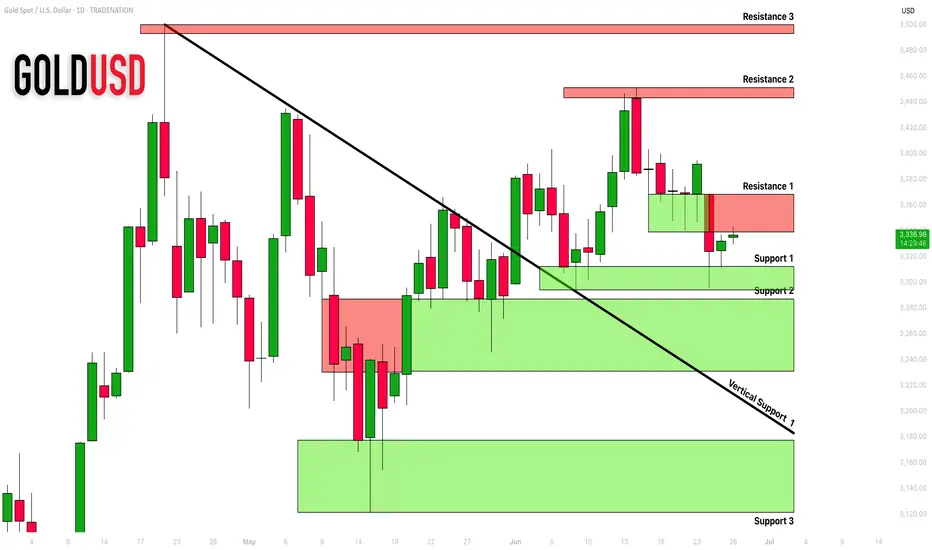
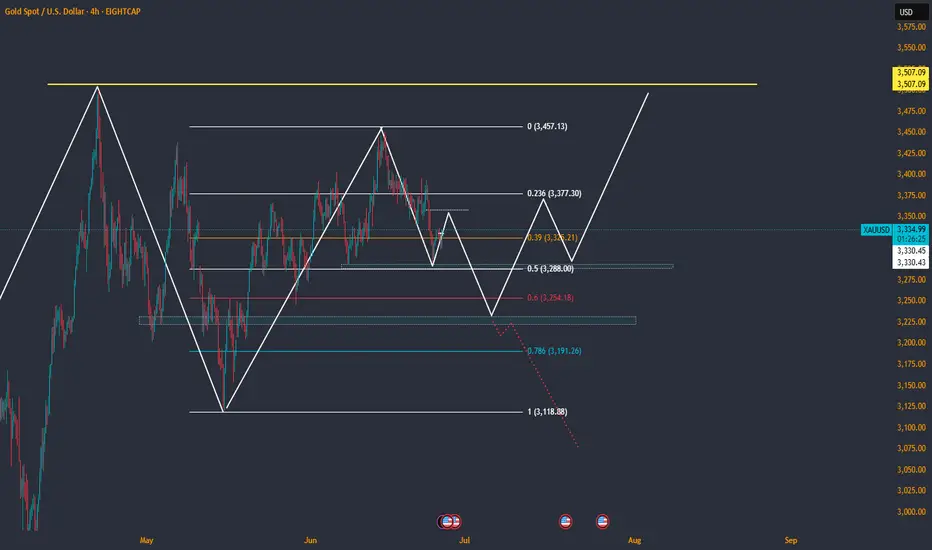
GOLD (XAUUSD): Updated Support & Resistance Analysis
Here is my latest support and resistance analysis for Gold.
Horizontal Structures
Support 1: 3294 - 3312 area
Support 2: 3231 - 3287 area
Support 3: 3121 - 3176 area
Resistance 1: 3338 - 3368 area
Resistance 2: 3441 - 3451 area
Resistance 3: 3493 - 3500 area
Vertical Structures
Vertical Support 1: Falling trend line
Consider these structures for pullback/breakout trading.
❤️Please, support my work with like, thank you!❤️
I am part of Trade Nation's Influencer program and receive a monthly fee for using their TradingView charts in my analysis.
[XAUUSD] GOLD – Bullish Setup in Play🟡 *Key Context*
- Geopolitical calm (Trump ceasefire remarks) lowered risk aversion, pushing Gold down — but key support is holding.
- Fed uncertainty continues, yet technicals point to a possible reversal.
📉 *Price Structure*
- Price dropped into a falling wedge, testing 3285–3295 (H4 demand zone).
- RSI bullish divergence + harmonic ABCD pattern seen on 30m.
📌 *Trade Setup – Long Bias*
🔹Entry: 3285–3295 zone (watch for bullish candle confirmation)
🔹Stop Loss: Below 3280 (structure invalidation)
🔹Target 1: 3320–3330
🔹Target 2: 3390 (longer-term move)
⚠️ Volume confirmation is key — wait for breakout strength. Avoid entries during news events. Risk must be managed tightly.
#XAUUSD #Gold #TradingSignal #TeconLab #BuyTheDip
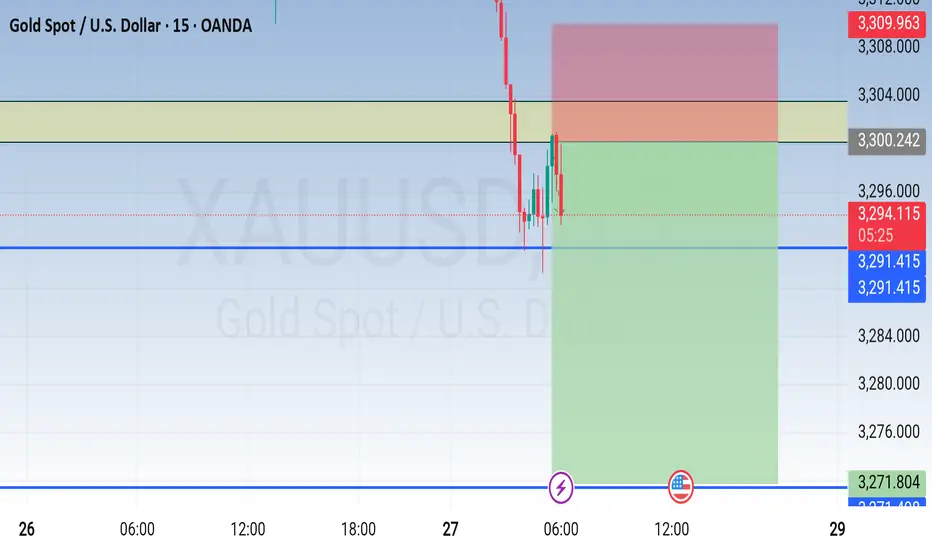
UPDATE 26th June 2025 Consolidation Phase Consolidation Phase still running.
It have a potential to retest a lower support.
During this consolidation period, we will continue to monitor any fluctuations ( war, geopolitic, US economic, etc ) that will affect the movement of gold prices.
So becareful at support level / key level.
Goodluck !
If you agree...click Boost
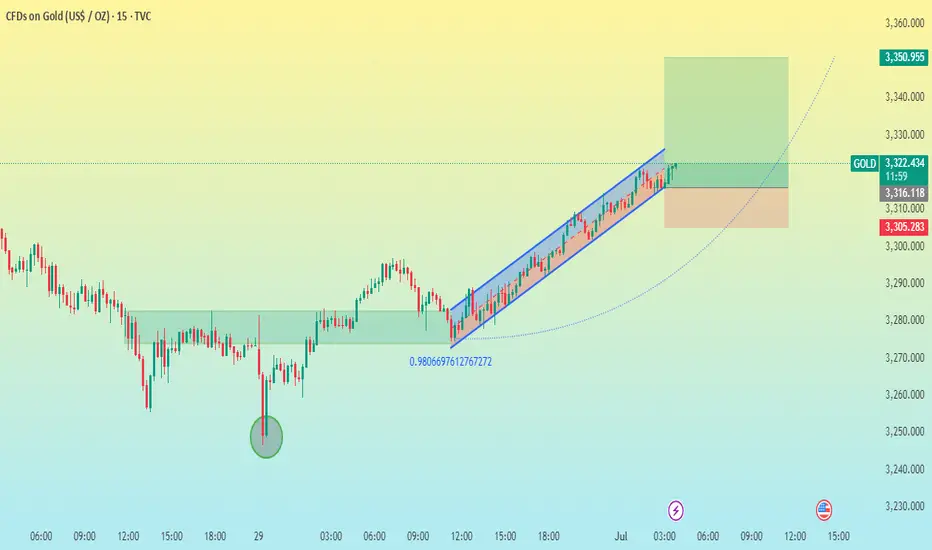
XAU/USD 15M CHART PATTERNHere's a breakdown of your XAUUSD (Gold vs USD) Buy trade setup:
---
🟢 Trade Type: Buy (Long)
Entry Price: 3321
---
🎯 Take Profit Levels:
1. TP1: 3330 (9 pips gain)
2. TP2: 3340 (19 pips gain)
3. TP3: 3350 (29 pips gain)
---
🔴 Stop Loss:
SL: 3305 (16 pips risk)
---
📊 Risk-Reward Ratios:
TP1: ~1:0.56
TP2: ~1:1.19
TP3: ~1:1.81
---
✅ Analysis:
The setup shows a moderate risk with potential for compounding gains.
Ensure there's enough momentum or support confirmation at or around 3321.
Your stop loss is fairly tight (16 pips) — consider volatility during news hours (like NFP or Fed announcements).
---
Would you like a chart analysis, help with position sizing, or automating this setup (e.g., for MetaTrader/TradingView)?
$XAUUSD Holding Key Support, Bounce Incoming?Gold is still holding the key support zone around $3,285–$3,290, which aligns closely with the 0.5 Fib retracement level.
As long as this area holds, we could see a push toward $3,320, and if momentum follows through, $3,373 (Fib 0.236) is the next key level to watch.
The structure looks solid, and buyers are showing interest.
Keep an eye on a breakout above the descending trendline. 👀
DYOR, NFA
#XAUUSD #GOLD
GOLD DISTRIBUTION TYPEHello folks. its been a while I am posting. Been dealing with this idea last week.
wait for a rally to 3344, if it breaks above 3351 then we still waiting below our main Entry 3280-3289 zone. less stoploss below the friday low.
Trade it swing if we see monday rally. then wait our entry.
Goodluck and have fun trading,
If trading is a lifestyle this is it.
this is your lifestyle.
waiting here is boring.
thats why we need to be more patience.
xiaaaaooo.
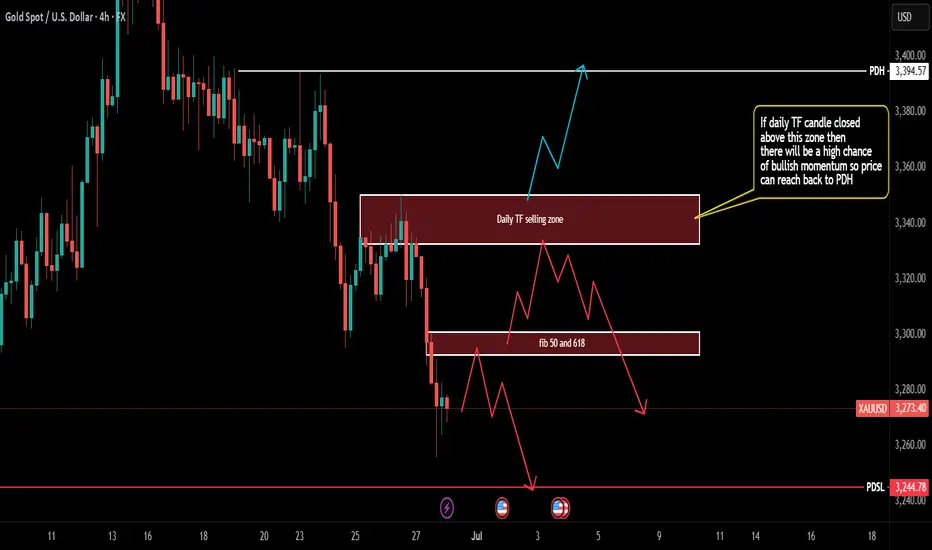
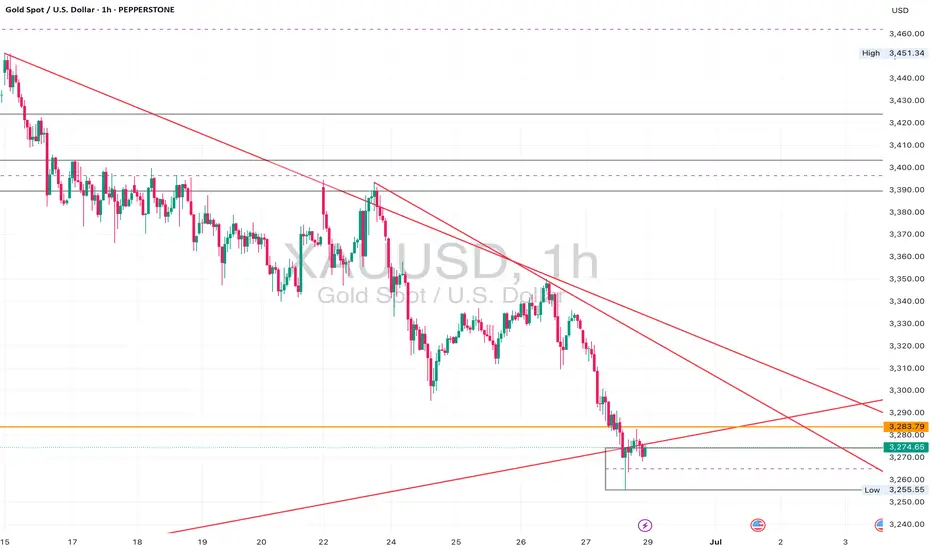
XAUUSD Breakdown: Daily Support Under Fire – Bearish MomentumGold (XAUUSD) is pressing deep into key daily support around $3,275 after a sharp drop from the $3,450s. The daily trendline that’s defined this bullish run since January is now being tested for the first time in months, signaling a possible structural shift.
On the Daily chart, price has decisively broken below the mid-range of the recent consolidation box and is holding near trendline support.
On the 4H and 1H, bearish impulsive waves have formed clear lower highs and lower lows, with the current move stalling at the support zone around $3,265–$3,275.
The 23M chart shows tight consolidation just above this support area, suggesting a potential breakdown if sellers stay in control.
📌 If this level gives way, watch for price to move quickly toward the next major support near $3,150–$3,200. Bulls must reclaim $3,300+ and break above the descending trendline to flip the bias back to bullish.
🚨 Current Bias: Bearish below $3,300; watching for confirmation of breakdown or strong reversal signals.
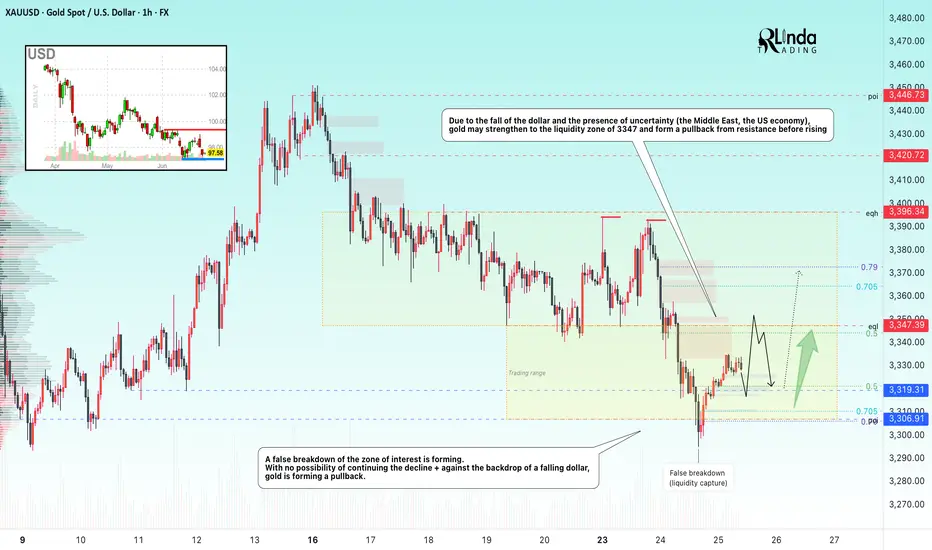
GOLD → Attempt to buy back the fall. Uncertainty factorFX:XAUUSD is falling within our expectations. After breaking through the trigger-level of 3340, the price fell to the liquidity zone of 3306. There is uncertainty in the market...
Gold is rising after a false break of support at 3300-3306, interrupting a three-day decline amid a weakening dollar and ongoing tensions in the Middle East. Investors are cautious due to the unstable truce between Iran and Israel, while the decline in USD/JPY after the Bank of Japan's statements and the rise in PPI in Japan are further supporting demand for gold. Powell's comments on the need for caution in monetary policy only temporarily strengthened the dollar. Now the market is focused on US housing data and the second day of Powell's speech
Technically, the price may consolidate at 3306-3347 for some time and only then show us (against the backdrop of the fundamental sentiment that has formed) which direction it will then take
Resistance levels: 3347, 3364, 3372
Support levels: 3319, 3307
The market is trying to buy back the decline. Tuesday's daily session closed with a long shadow, indicating interest in this price range. A pullback to 3320-3310 is possible before growth to 3340-3347.
Best regards, R. Linda!
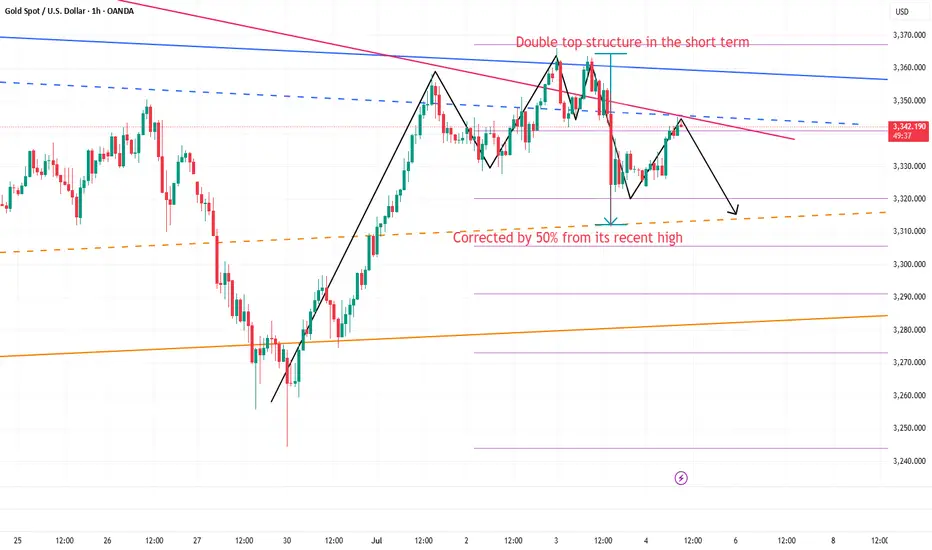
Still short gold before breaking 3355After the release of NFP yesterday, gold began to fall sharply from 3352, reaching a low of around 3312; although it has gradually rebounded above 3340, the time span is not short, so the rebound is not strong; and the double top structure successfully constructed by gold in the 3365-3360 area in the short term still plays a technical suppression role in the short term, greatly weakening the rebound potential; and with the decline of gold yesterday, I think before gold recovers the 3352 starting point, gold will also be under pressure in the 3345-3355 area in the short term. If gold cannot successfully break through this area during the rebound, gold is expected to retest the 3330-3320 area again.
Because of the US Independence Day, the gold market will be closed in advance today. It is expected that gold will not have a breakthrough today, so it may be difficult to break through the 3345-3355 area in the short term, so we can still continue to maintain the trading rhythm of shorting gold in terms of trading.
So I think shorting gold still has a lot of profit potential. We can short gold with 3345-3355 area as resistance and look to the target area: 3335-3325-3315.
Liquidity Grab Complete – Eyes on 3390 Price just grabbed liquidity and is now targeting the 3390 zone.
Wait for the pullback – the next move could be big.
Smart money waits, not chases. Watch how price reacts.
Go long on dips and short on rallies📰 News information:
1. Gold market liquidity at the end of the month
2. Impact of geopolitical situation
📈 Technical Analysis:
Last week we predicted that gold would rebound. Today, after gold rebounded as expected, we gave a short trading strategy. Gold fell precisely at the point we gave, 3295, and successfully hit our TP3280-3270. The result confirmed the correctness of our trading strategy. Next, we will focus on the long trading opportunities below 3270-3260.
🎯 Trading Points:
BUY 3270-3260
TP 3290-3300
SELL 3295-3300-3310
TP 3280-3270
In addition to investment, life also includes poetry, distant places, and Allen. Facing the market is actually facing yourself, correcting your shortcomings, confronting your mistakes, and strictly disciplining yourself. I hope my analysis can help you🌐.
TVC:GOLD FXOPEN:XAUUSD PEPPERSTONE:XAUUSD FX:XAUUSD FOREXCOM:XAUUSD OANDA:XAUUSD
Gold Holding Strong – Eyes on $3400 and Beyond! (READ)By analyzing the gold chart on the 4-hour timeframe, we can see that after our last analysis, the price corrected down to $3341, then rallied back up to $3399. Currently, gold is trading around $3373, and if it manages to hold above $3355, we can expect further upside movement.
Potential bullish targets are $3400, $3417, $3450, and $3468.

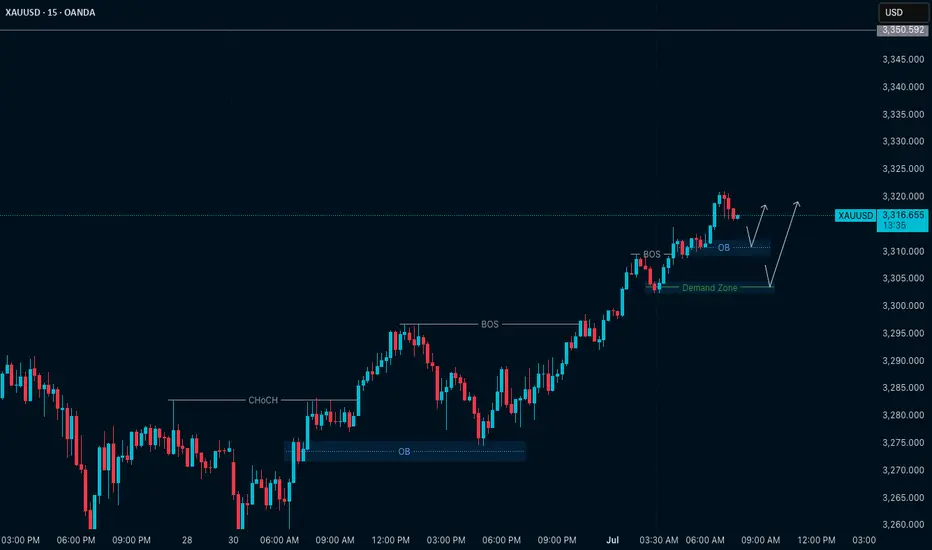
Gold (XAUUSD) – July 1 Analysis📍 H4 Key LH Zone: 3348.500 – 3350.500
This is a major decision zone.
Current market structure:
🔸 M15 is in an uptrend with confirmed ChoCh + BoS
What to watch:
We’re approaching the H4 LH supply zone — now we observe how price behaves here.
🔹 If price breaks above this H4 LH zone:
→ HTF and LTF trends align to the upside
→ Potential continuation of the bullish move
🔹 If price respects and stays below this LH zone:
→ Then this recent up-move could be a pullback
→ We may see a new low forming — so be cautious
📍 M15 Zones for Long Setup (if confirmed):
• 3309.500 – 3312.500 (Order Block Zone)
• 3302.500 – 3304.600 (Demand Zone)
We will watch these levels closely.
If price respects these zones and gives M1 confirmation (ChoCh + BoS) — we’ll plan for long entries accordingly.
📖 Let structure guide your decisions. Let price speak first.
📘 Shared by @ChartIsMirror
Author of The Chart Is The Mirror — a structure-first, mindset-grounded book for traders