GOLD DAILYThe ADP Non-Farm Employment Change report for today showed a surprising decline of 33,000 jobs, well below the forecast of a 99,000 forecast and down from the previous month’s modest gain of 29,000 jobs.
Key Details:
This negative figure indicates that private businesses in the US shed 33,000 jobs in June, marking a contraction in private-sector employment—the weakest report since March 2023.
The report is produced by the ADP Research Institute, which uses anonymized payroll data from about 26 million workers to estimate private-sector employment changes ahead of the official government Non-Farm Payrolls (NFP) report.
The decline reflects ongoing uncertainty among employers amid policy and economic challenges, including tariff impacts and consumer caution.
Market Implications:
The unexpected job losses may raise concerns about the health of the US labor market and the broader economy.
This data could increase expectations for Federal Reserve rate cuts or a more dovish stance, potentially weighing on the US dollar and boosting safe-haven assets like gold and silver.
However, the ADP report often diverges from the official NFP, so markets will closely watch the upcoming government jobs data for confirmation.
In summary:
June’s ADP report revealed a contraction of 33,000 private-sector jobs, far below expectations, signaling caution in US labor market hiring and adding uncertainty to the economic outlook ahead of the official payrolls release.
#gold #xauusd
XAUUSD.F trade ideas

Gold is moving in a range-bound consolidation.The ADP employment data in the U.S. unexpectedly cooled down, with private sector employment dropping by 33,000 in June, far below the market expectation of an increase of 95,000. The previous value was revised down from 37,000 to 29,000, marking the largest single-month decline since March 2023. Meanwhile, the Challenger Enterprise Layoff Report showed that the number of layoffs in June was 48,000, with a monthly rate decrease of 48.84% and an annual rate decrease of 1.6%. Compared with the previous value of 93,800, it has significantly declined, indicating that the layoff pressure has eased. After the release of the ADP data, the U.S. Dollar Index fell sharply in the short term, and gold, as a safe-haven asset, rose rapidly. Gold showed a high-level consolidation trend. After repeatedly stabilizing in the 3,327 area, it rebounded and hit the resistance at around 3,351 U.S. dollars, lingering there. It is expected that the range consolidation of gold may face pressure.
you are currently struggling with losses,or are unsure which of the numerous trading strategies to follow,You have the option to join our VIP program. I will assist you and provide you with accurate trading signals, enabling you to navigate the financial markets with greater confidence and potentially achieve optimal trading results.
Trading Strategy:
buy@3330-3335
TP:3360-3365
Will Gold Continue Its Strong Rally or Face a Pullback?XAUUSD 02/07: Will Gold Continue Its Strong Rally or Face a Pullback?
📉 Technical Analysis – Gold Faces Short-Term Pullback After Strong Rally
Gold has been experiencing a clear rally in recent days, but it’s currently undergoing a brief correction. The price has recently dropped slightly, prompting traders to keep a close eye on key levels for potential reversal or continuation of the bullish move.
🌍 Macroeconomic Context – Factors Impacting Gold's Price
USD Fluctuation: The weakness in the US Dollar continues to affect gold prices, creating opportunities for the precious metal to maintain its upward movement.
Geopolitical Tensions: Ongoing global tensions, including the US-Iran conflict, act as a safe-haven factor, supporting gold demand.
Interest Rate Expectations: The market is closely watching for any changes in interest rate policies. Any future rate cuts by the Fed could further bolster gold's price.
📊 Technical Outlook (H1 – H4 – D1)
Short-Term Trend: On the H1 timeframe, the price of gold touched a key level near 3340. From there, the price began to experience a pullback. However, the upward momentum remains strong on higher timeframes.
Key Support Levels: The 3300 level remains a crucial support. If the price stays above this, there’s a chance for gold to continue rising towards higher levels.
Key Resistance Levels: 3360 and 3380 are critical resistance levels. If breached, gold could move towards new highs.
📍 Important Support and Resistance Levels:
🔺 Resistance: 3345 – 3360 – 3380 – 3400
🔻 Support: 3300 – 3290 – 3270 – 3250
💡 Trading Plan for Today, 02/07:
🔵 BUY ZONE:
📈 Entry: 3305 – 3303
📉 SL: 3297
💰 TP: 3315 → 3325 → 3340 → 3360
🔴 SELL ZONE:
📉 Entry: 3360 – 3362
📈 SL: 3368
💰 TP: 3350 → 3340 → 3320
📣 Conclusion:
Gold is showing signs of short-term correction but remains a strong asset due to geopolitical factors and monetary policies. Buying opportunities continue to be attractive at support levels, while key resistances will play a crucial role for any breakout. Keep an eye on the mentioned levels to capitalize on market movements.
Happy trading and best of luck to all traders!
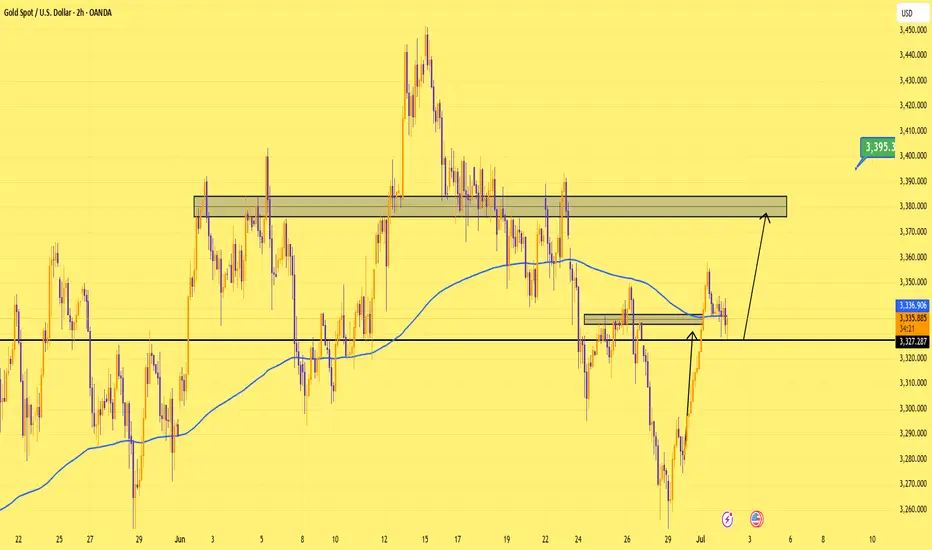
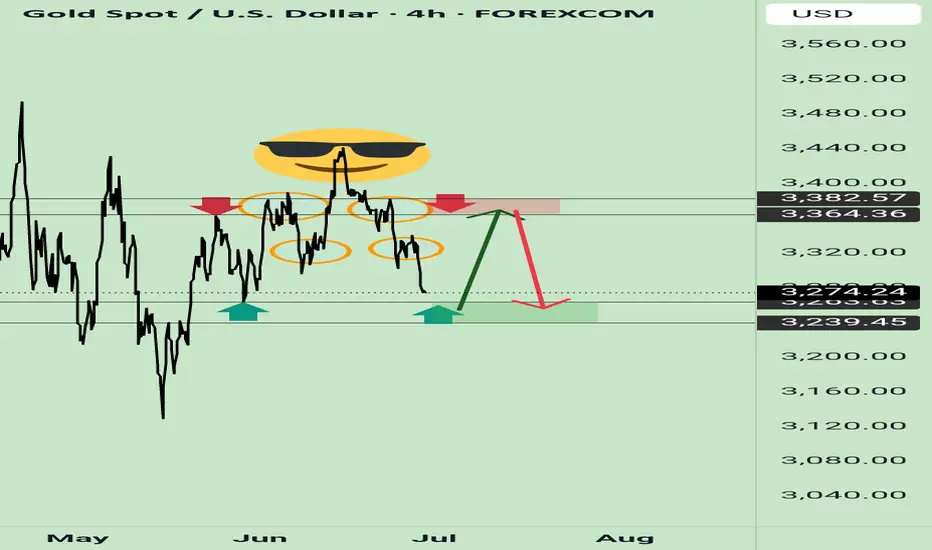
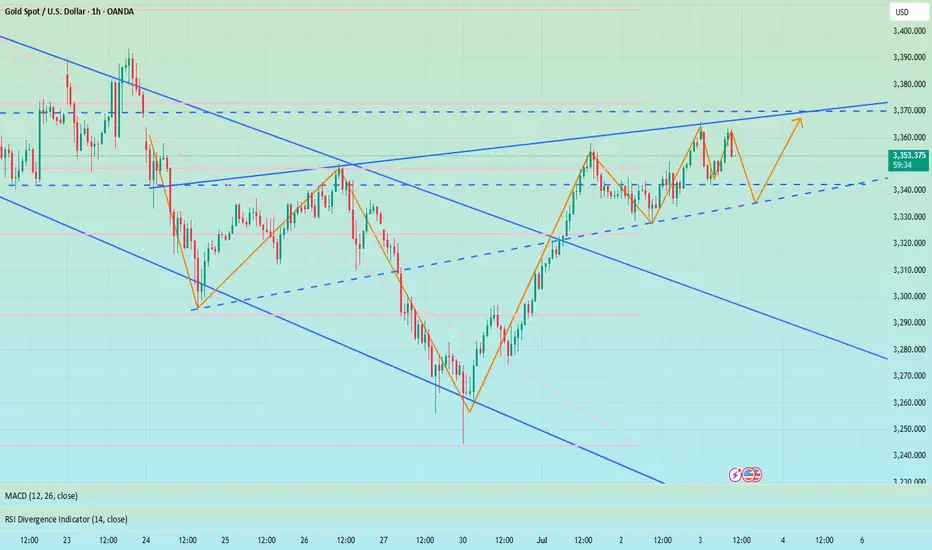
Gold’s Got Legs — as Long as 3,327 Holds Price respected the zone perfectly, bouncing clean off support around 3,327.
Structure still intact — bulls defending well.
I'm personally expecting weaker US data, which could be the catalyst to drive us toward 3,380.
Simple setup. Clear target. Now it’s up to the market to deliver.
XAUUSD SHORT IDEAH4 BEAR ENGULF
TARGET 61.8 FIB LEVEL AND EMA CONFLUENCE
Rejecting EMA
Await 30 min confirmation to enter possibly during asian session
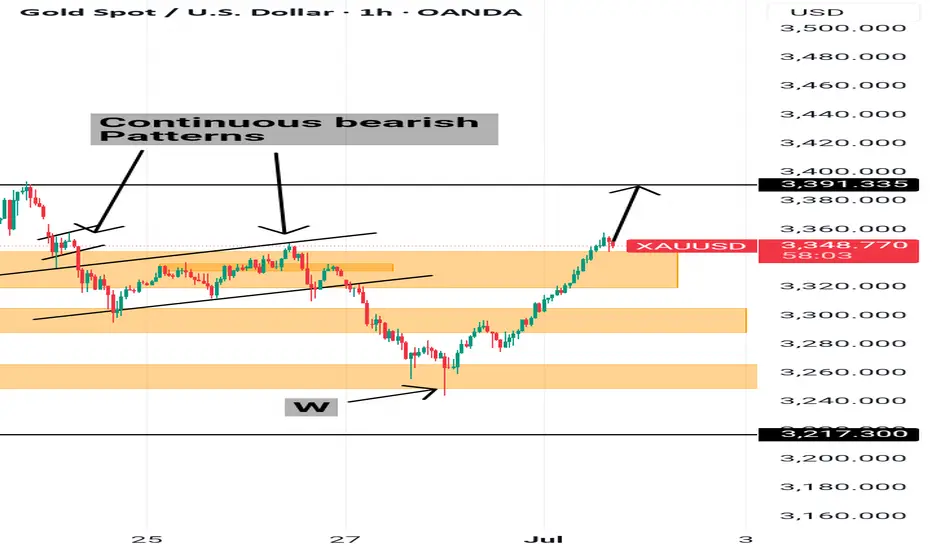
Potential Buy opportunity Gold had formed a W formation and moved upward quite a bit, it has created a pull back with the current bearish candle that has a nice wick.
It is also on a support, which evidence of the continuous bearish pattern on the left.
Entry at this point would be good in order to have a smaller stop loss.
#XAUUSD 30MIN 📉 #XAUUSD 30m Sell Setup – Bearish Continuation Ahead
Gold is currently retracing after a strong drop, consolidating within a short-term Supply Zone. We anticipate a temporary bullish push toward the 3345–3350 premium area, where the broader bearish trend is expected to resume.
🔻 Sell Zone: 3345 – 3350 (Supply / OB Zone)
🎯 Targets: 3300 → 3260
❌ Stop Loss: Above 3358
⚠ Note: This is a short-term retracement, not a trend reversal.
We expect selling pressure to return once price taps into the 3350 Order Block, in line with the higher timeframe bearish structure.
#gold #XAUUSD #forexsignals #SmartMoney

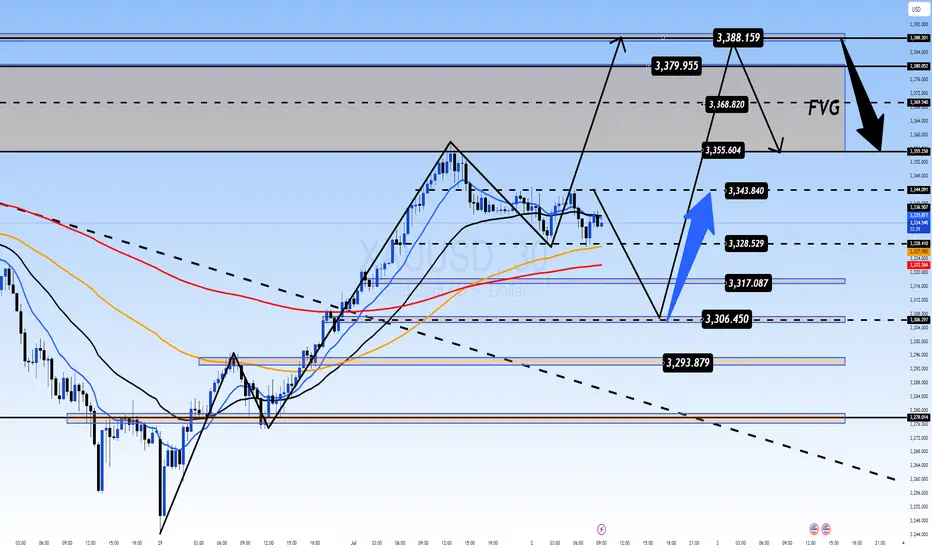
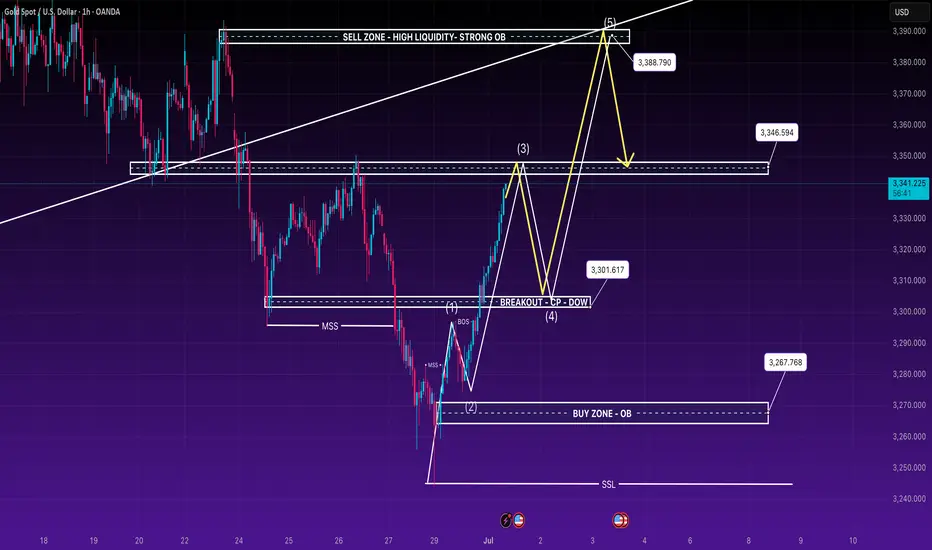
XAUUSD 01 July - Price pushing into premium zone 🔹 Macro Structure:
Gold has successfully broken structure (BOS) after forming a bullish shift in market structure (MSS) around the 326x – 327x zone.
Current price action is respecting internal bullish order flow, with higher highs and higher lows being maintained.
Breakout above 3300 psychological level + recent BOS confirms bullish intent.
🔹 Liquidity Map:
Buy-side liquidity is still resting above 3350 and into the strong OB at 3388, where a potential sell-side reaction could occur.
Sell-side liquidity below 3267 has not been swept recently, meaning deeper retracements may still occur after internal liquidity is cleared.
🔹 Expectation:
Current wave is likely in impulse phase (Wave 3 → Wave 5) aiming for 3388 OB.
A retracement into the discount zone (3301 – 3303 OB) is ideal for a continuation trade.
Watch for bearish signs near 3388 – this zone aligns with high liquidity, strong OB, and trendline confluence.
🔵 BUY SETUP (Retracement entry – continuation)
Buy Zone: 3301 – 3303 OB
Entry Trigger: Bullish engulfing / FVG fill
Stop Loss: Below 3297 (below recent swing low)
Targets: 3306 – 3310 – 3315 – 3320 – 3330 – 3346 – 3388
🔴 SELL SETUP (Reversal entry – premium zone)
Sell Zone: 3348 – 3350 (mitigation area)
Entry Trigger: CHoCH + bearish rejection wick
Stop Loss: Above 3354
Targets: 3344 – 3340 – 3335 – 3325 – 3310 – 3300
✅ Alternative Entry (Low sweep)
Buy Limit: 3270 – 3267 (deep OB + SSL zone)
SL: 3262
TP: 3280 – 3290 – 3300 – 3315+
⏳ Wait for price to confirm intention via structure + liquidity reaction before entering trades.
🧠 SMC traders: focus on manipulation zones, OBs, and internal BOS for precision entries.
going longit swept that level expecting going long
and it should move so impulsively
CAPITALCOM:GOLD
XAU/USD Trade Setup – June 30, 2025📉 XAU/USD Trade Setup – June 30, 2025
Bias: Short (Sell Position)
Entry Zone: Around $3,363–$3,370
Stop-Loss: 🔺 $3,259 (Above recent highs)
Take-Profit 1: 🎯 $3,308
Take-Profit 2: 🎯 $3,302
Risk/Reward: Favorable (1.8–2.2:1 depending on entry)
🔍 Technical View
Trend: Bearish below $3,370
Structure: Price rejected key resistance at $3,370–$3,380
Indicators:
RSI weakening near 50 (bearish bias)
MACD crossing down on H1
Key Zone: A break and close below $3,350 will likely drive price toward your TP zones at $3,308 and $3,302.
⚠️ Notes
Volatility expected near NY session open or if macro data hits (e.g. Fed speakers, inflation prints)
Consider scaling out partial profits at TP1 ($3,308) to lock gains
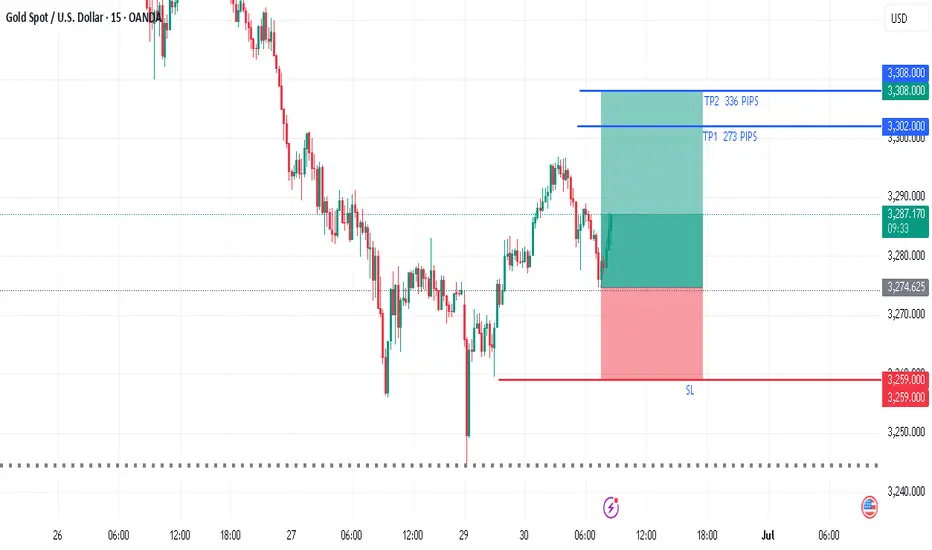
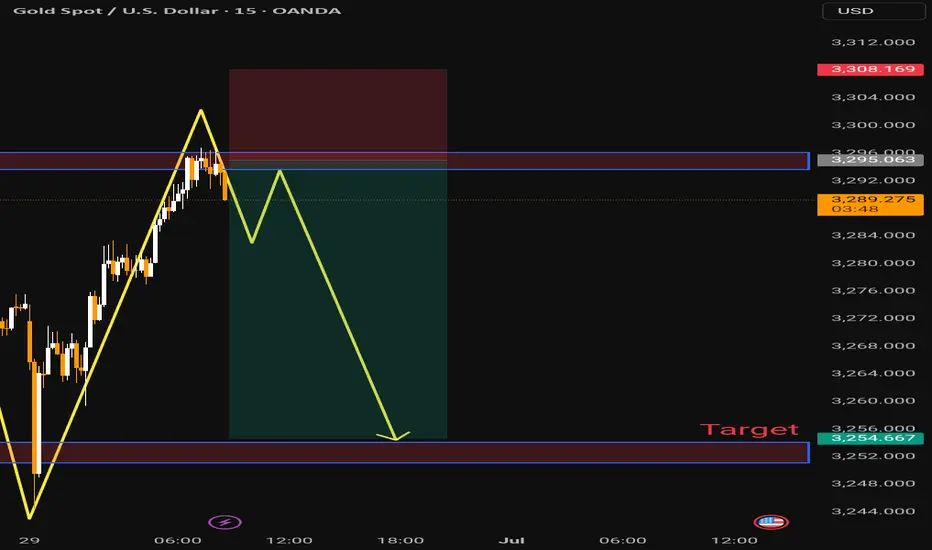
Expecting Gold Selling movement The bearish setup is reinforced by
Rejection at the key resistance zone
Clear lower high and lower low structures
Bearish target marked at $3,254 a strong support level from recent price action
The red zone above represents the stop-loss area suggesting a favorable risk-to-reward ratio for short positions If price breaks above $3,308 the bearish scenario may be invalidated
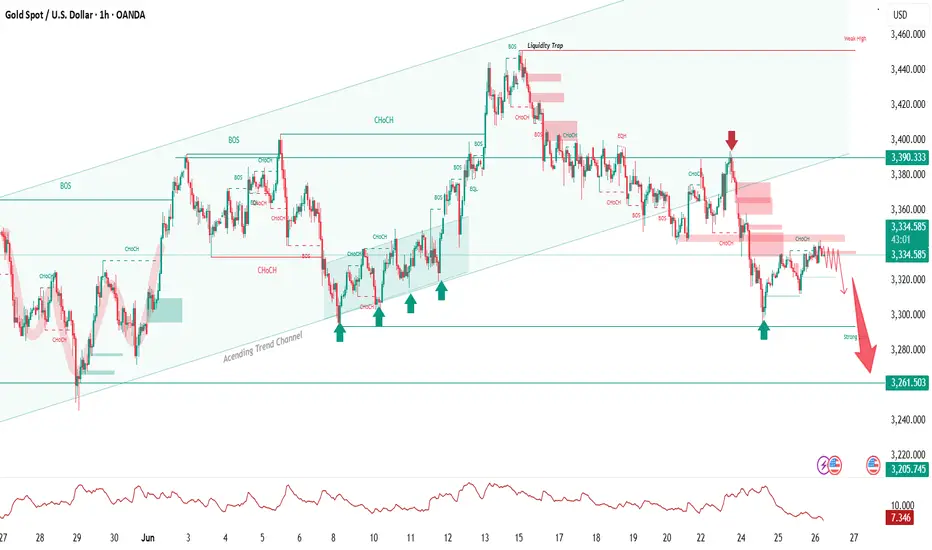
XAUUSD – Bearish Setup Following Liquidity Trap and Channel BreaGold has confirmed a bearish setup after breaking down from the ascending trend channel and trapping buyers near 3,390.
Technical breakdown:
Price engineered a liquidity trap above equal highs, inducing breakout longs near 3,390.
The rejection from that level triggered a clear change of character (CHoCH) and subsequent breaks of structure (BOS) to the downside.
The ascending channel, respected since early June, has now been invalidated with strong bearish momentum.
Lower highs are forming beneath key supply zones around 3,340, reinforcing institutional sell pressure.
Bearish bias:
Price is currently retesting a minor supply zone with signs of weakness.
As long as price holds below 3,340, bearish continuation is likely.
Targeting the strong low at 3,261, followed by the next demand at 3,205 if momentum persists.
This setup reflects smart money principles: engineered liquidity, structure shift, and supply-driven order flow.
Invalidation:
A clean break and close above 3,390 with BOS to the upside would invalidate this setup.
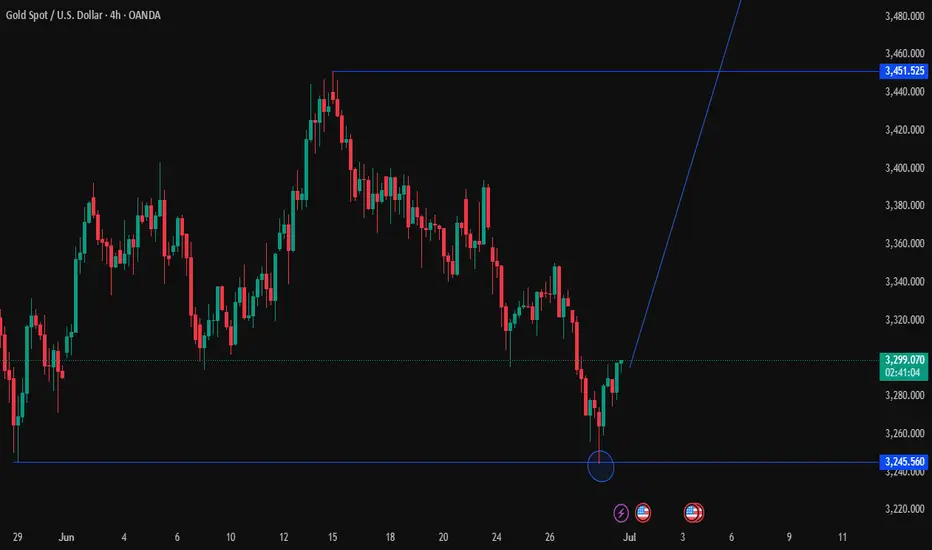
Take this trade GOLD Win i think this is the most suitable scenario for gold , especially during this period; the gold will rush to some all time new high , better be ready and anticipate the weight of this kind of positions ; bless up
XAUMO REPORT: XAUUSD WEEKLY ANALYSIS
Period: Monday June 30 – Friday July 5
Focus: US Independence Day (July 4), NY Market Closure Impact
🟢1. Price Action Context
Last Week (ending June 28):
Weekly bearish engulfing closed near the lows (~3,250 area).
Series of failed rallies above 3,330.
Price compressed in a tight lower range—distribution, not accumulation.
Monday June 30 – Friday July 5:
Market begins in a low-confidence, low-volume environment.
Tuesday–Wednesday: traders will be positioning ahead of July 4 closure.
Thursday (July 4): NY market closed—no COMEX metals futures settlement.
Friday (July 5): NY market reopens—liquidity and volume surge back in.
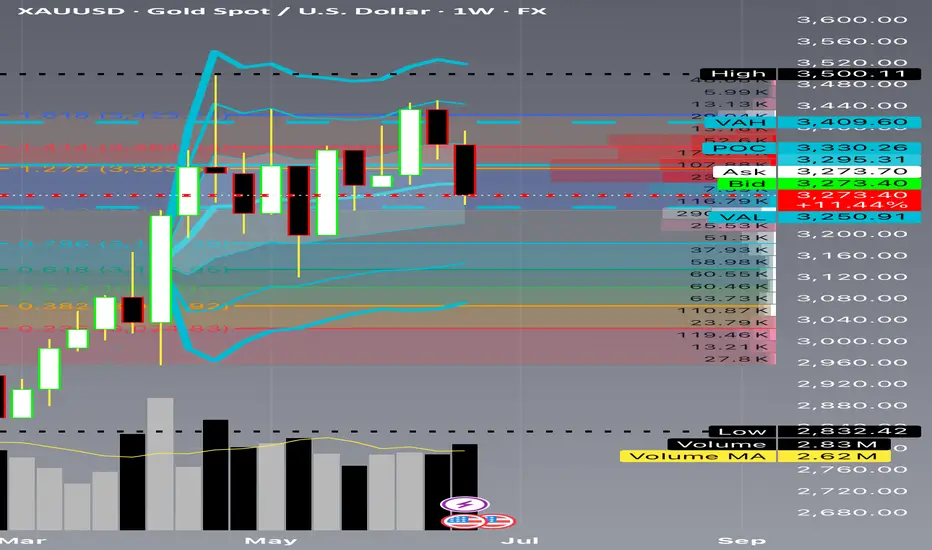
🟡 2. Range, Support & Resistance
Composite Volume Profile:
VAH: ~3,410
POC: ~3,330 (where the heaviest volume has been transacted)
VAL: ~3,250 (final defense)
Support:
3,250: major structural shelf
3,200: next key liquidity target
Resistance:
3,330–3,350: loaded supply zone
3,390–3,420: overhead liquidity from prior weeks
Interpretation:
Price under POC, hugging VAL, is bearish.
Acceptance under 3,250 sets up a vacuum to 3,180–3,200.
🔵 3. Volume Footprint and Delta
Footprint Characteristics:
Strong negative delta (-21K) as price approached 3,250.
Buyers unable to lift offers at 3,300+.
Repeated ask dominance = supply persistence.
Institutional Read:
They’re selling into every bounce, and liquidity thinness around July 4 increases stop-hunt potential.
🟣 4. Trend and Wave Structure
Weekly trend: bearish
Daily trend: bearish with lower highs and lower lows
Wave count:
Wave 1: 3,500 ➡ 3,273
Wave 2: retrace ~3,330
Wave 3: active—projected target 3,180
🟤 5. Stop Hunt Zones
Above:
3,330–3,350: obvious short stops and breakout buy stops.
Below:
3,250: stop cluster from dip buyers and trapped longs.
Expected Behavior:
Institutions use Wednesday and low liquidity Thursday to spike stops before the real move on Friday.
Stop Hunt Scenario:
July 3–4: quick liquidity sweep above 3,330.
July 5 (Friday): NY reopen—supply steps in, drives price back down.
🟢 6. Market Closure & Liquidity Impact
NY Market Closure Schedule:
July 4 (Thursday):
NY COMEX metals closed for Independence Day.
Forex open but liquidity ~40% of normal.
Price can move erratically with minimal volume.
July 3 (Wednesday):
Early close in many US desks.
Position squaring—thin books.
July 5 (Friday):
Liquidity flood back in—true directional follow-through likely.
Implications:
Avoid heavy positioning during July 4 closure.
Expect false breakouts and “ghost candles”.
Major moves likely Friday July 5 during NY session.
🟠 7. Psychological Dynamics
Retail:
FOMO if price spikes above 3,330 on low liquidity.
Fear if price knifes under 3,250 without volume confirmation.
Institutions:
Use the holiday to:
Clear out stops.
Create liquidity pools.
Accumulate positions for Friday’s push.
🔴
8. Tangible Day-Trader Scenarios
🟢 Scenario A: Pre-Holiday Stop Hunt Trap
When: July 3–4
Price spikes over 3,330 on low volume.
Footprint shows negative delta quickly after.
Execution:
Sell limit ~3,340.
SL: 3,375.
TP: 3,200.
Note: Keep size reduced—thin conditions are volatile.
🟣 Scenario B: Post-Holiday Breakdown
When: Friday July 5
NY opens, volume returns.
Price fails to reclaim 3,250 after test.
Execution:
Sell stop 3,249.
SL: 3,310.
TP: 3,180.
Scale in as confirmation strengthens.
🟠 Scenario C: Holiday Range
When: July 4–early July 5 pre-NY
Price likely ranges 3,250–3,330.
Avoid entries unless volatility contraction ends with volume breakout.
🟡 9. Hypothetical Institutional Trade Plan
✅ Order Type: Sell Stop
✅ Entry: 3,249
✅ Stop Loss: 3,310
✅ Take Profit: 3,180
✅ Position Size: Max 0.5–1% account risk
✅ Trigger: NY session reopens Friday with volume confirmation
✅ Confidence: 85% (post-holiday breakdowns historically have high follow-through)
🟢 10. The Executive Recap
✅ Timeframe:June 30–July 5
✅ Trend:Weekly/Daily bearish
✅ Volume:Negative delta clusters
✅ Stop Hunts:
3,330–3,350 (trap)
3,250 (flush)
✅ Liquidity Event:July 4 closure reduces liquidity by ~60%
False moves likely
Major move probable Friday NY session
✅ Execution:
Low liquidity: reduced size
Confirmation: delta + volume
No chasing pre-closure
#GoldTrading #XAUUSD #ForexTrader #PriceActionTrading #TechnicalAnalysis #VolumeProfile #FootprintAnalysis #InstitutionalTrading #DayTrading #MarketAnalysis #ForexSignals #ComexGold #TradingStrategy #MarketPsychology #LiquidityTraps #StopHunt #NYMarketClosure #July4Trading #MetalsMarket #TrendAnalysis #WaveAnalysis #SupplyAndDemand #SmartMoney #ForexEducation #CMEGroup #TradingMindset #RiskManagement
⚠️ Disclaimer : This is a purely educational scenario. You are the only one responsible for your risk.
My idea gold wavesCheck my idea gold waves expected moves as per my readings
Rule SL must use and enjoy
My Weekly Review and Some tierlist for the zones I madeHello guys. its end of the week and I wanna share you my journey since monday until today. I also tell you the real reason why I don't believe the bottom is in yet and holding my swing sell. Thank you for watching.

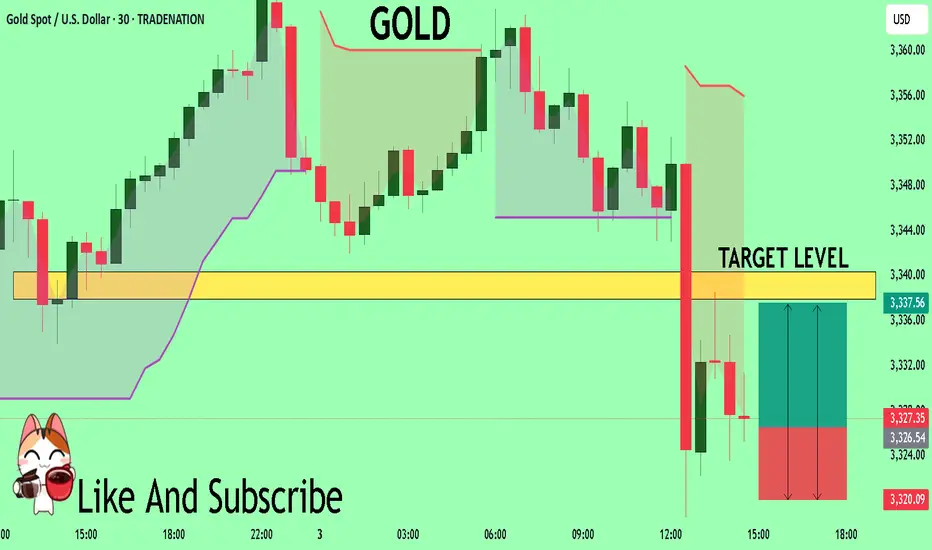
GOLD Massive Long! BUY!
My dear subscribers,
This is my opinion on the GOLD next move:
The instrument tests an important psychological level 3326.7
Bias - Bullish
Technical Indicators: Supper Trend gives a precise Bullish signal, while Pivot Point HL predicts price changes and potential reversals in the market.
Target - 3337.9
My Stop Loss - 3320.0
About Used Indicators:
On the subsequent day, trading above the pivot point is thought to indicate ongoing bullish sentiment, while trading below the pivot point indicates bearish sentiment.
Disclosure: I am part of Trade Nation's Influencer program and receive a monthly fee for using their TradingView charts in my analysis.
———————————
WISH YOU ALL LUCK
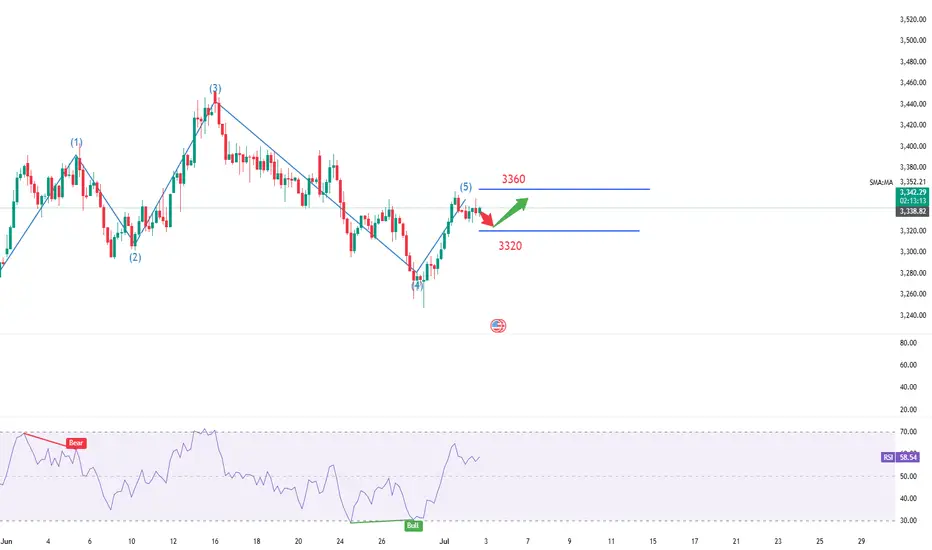
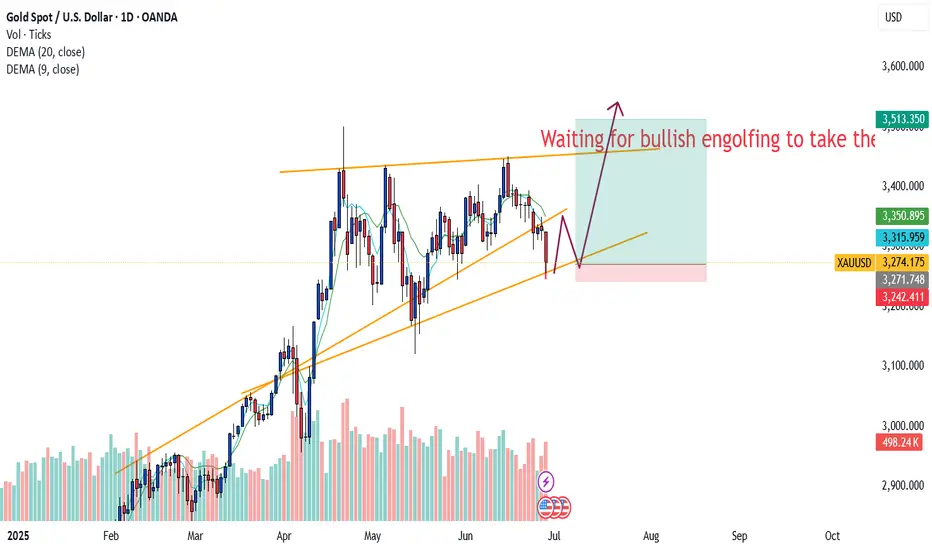
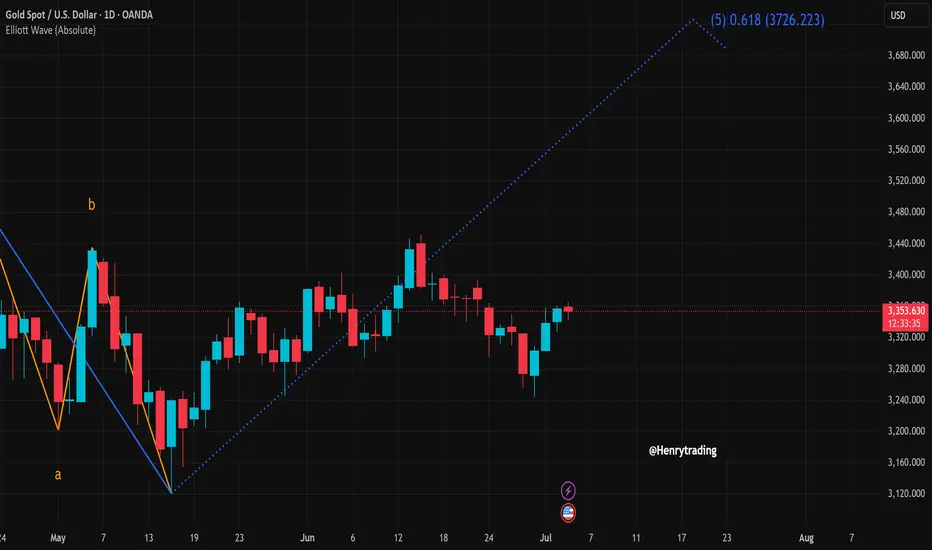
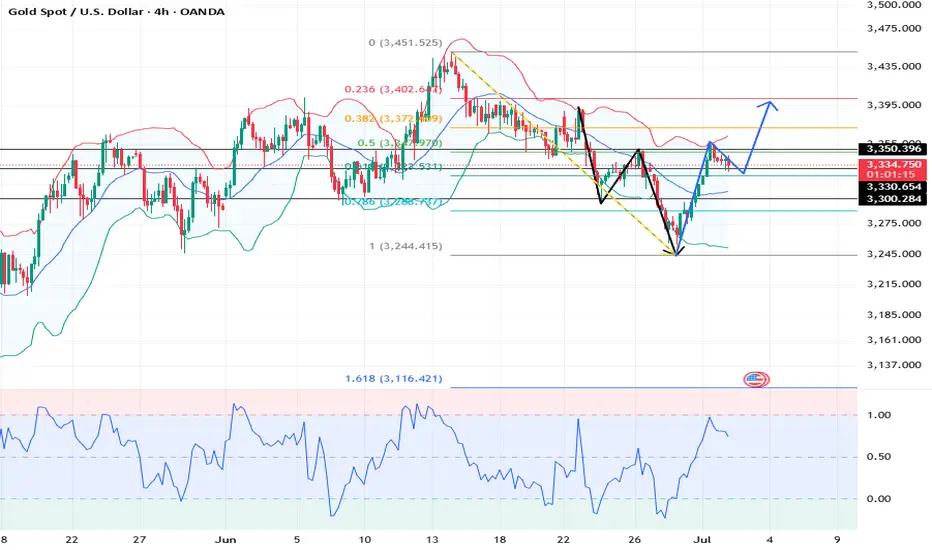
XAUUSD Set for Strong Bullish Wave – Targeting 3,726?Gold (XAUUSD) is showing signs of a bullish recovery after a recent correction between the 3,290–3,340 USD zone. On the daily chart, a clear Elliott Wave formation is unfolding, with the price potentially entering wave 5 aiming for the 0.618 Fibonacci extension at 3,726 USD.
Clear Wave Structure:
The a-b-c corrective wave appears to have completed in mid-May.
The price is now in wave 3 and preparing for a potential extension in wave 5.
Candlestick and Buying Momentum:
Recent candles show strong buying pressure with four consecutive bullish sessions.
The current upward momentum is testing the 3,352 resistance – a breakout could open the path to 3,450 and eventually 3,726 USD.
Support & Resistance Levels:
Immediate support: 3,320 – 3,330 USD
Key resistance: 3,450 USD (recent swing high)
Extended target: 3,726 USD (Fibonacci 0.618 from wave 2 low to wave 3 peak)
Suggested Trading Strategy:
Favor buy on dip strategy, waiting for a minor pullback to the 3,330–3,340 area before entering long.
Set stop-loss below 3,300, with targets at 3,450 and 3,726 USD respectively.
Conclusion:
The XAUUSD chart suggests a potential strong bullish wave according to the Elliott Wave framework, with a breakout likely leading to the 3,726 USD zone. Traders should closely monitor price action around the 3,350 level for confirmation of continued upward momentum.
What’s your view on this analysis? Drop a comment and let’s discuss your trading strategy together!
Gold trend analysis and layout before NFP data📰 News information:
1. Initial jobless claims and NFP data
2. The final decision of the Federal Reserve
📈 Technical Analysis:
Due to the Independence Day holiday this week, the NFP data was released ahead of schedule today, while the policy differences within the Federal Reserve have brought uncertainty to the market. Judging from the market trend, the 4H level shows that the gold price tested the upper track yesterday and then turned to high-level fluctuations after coming under pressure. In the short term, the structure still has bullish momentum after completing the accumulation of power. Although there was a correction in the US market yesterday, it stopped falling and rebounded near 3335, further confirming the strength. At present, the upper resistance in the European session is at 3365-3375, and the short-term support is at 3345-3335 below. Intraday trading still requires good SL to withstand market fluctuations. In terms of trading, it is recommended to mainly go long on callbacks
🎯 Trading Points:
SELL 3365-3375
TP 3350-3340-3335
BUY 3335-3330-3325
TP 3350-3360-3375
In addition to investment, life also includes poetry, distant places, and Allen. Facing the market is actually facing yourself, correcting your shortcomings, confronting your mistakes, and strictly disciplining yourself. I hope my analysis can help you🌐.
FXOPEN:XAUUSD PEPPERSTONE:XAUUSD FOREXCOM:XAUUSD FX:XAUUSD OANDA:XAUUSD TVC:GOLD
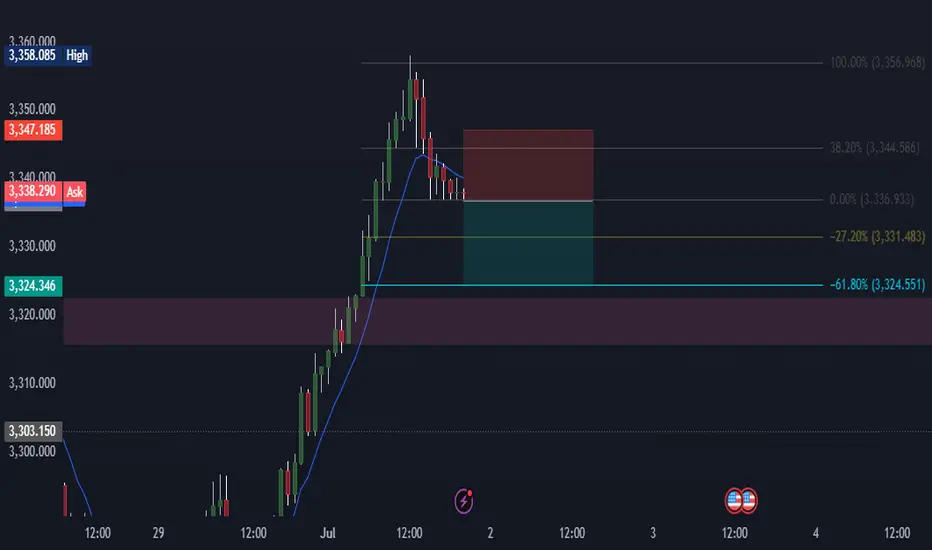
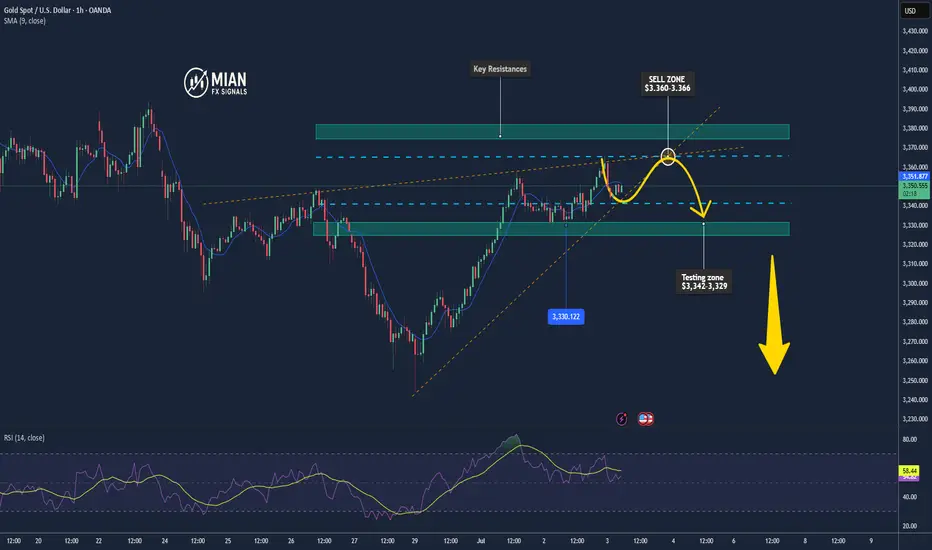
Gold May Pull Back After Day’s High📊 Market Overview:
• Gold is currently trading around $3,350/oz, with the daily high at $3,366/oz.
• The rally stalled as traders took profits near the session high, while a slight rebound in the USD and rising U.S. Treasury yields weighed on gold’s momentum.
📉 Technical Analysis:
• Key Resistance: ~$3,366 (today’s high), with next level at ~$3,375–3,380 if breached.
• Nearest Support: ~$3,342 (intra-day low), stronger support seen at $3,329–3,330.
• EMA 9/21: Price is hovering near the EMA21 (~$3,350); this area is crucial to determine the short-term trend.
• Candle/Momentum Indicators:
o RSI is around 53-55, signaling a neutral stance;
o MACD shows weakening bullish momentum after hitting resistance.
📌 Viewpoint:
Gold may see a minor pullback in the short term, possibly testing the $3,342–3,329 zone after reacting to the daily high. However, if it holds above EMA21 and EMA50, the medium-term bullish trend remains intact.
💡 Suggested Trading Strategy
SELL XAU/USD at: $3,363–3,366
🎯 TP: 40/80/200 pips
❌ SL: $3,370
BUY XAU/USD at: $3,329–3,332
🎯 TP: 40/80/200 pips
❌ SL: $3,325
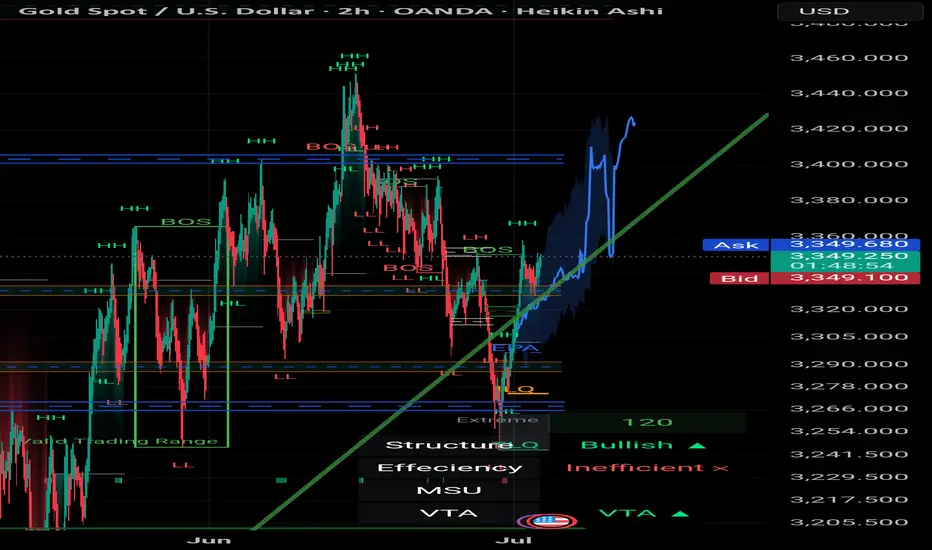
Mozafari Nejad ### Multi-Timeframe Analysis: 15min + 30min + 2# XAU/USD | Gold Market Outlook by Mohsen Mozafari Nejad
### Multi-Timeframe Analysis: 15min + 30min + 2h | July 2–3, 2025
---
## 🔍 Technical Overview:
| Timeframe | Structure | Efficiency | Context |
|-----------|-----------|------------|---------|
| 15min | Bullish ✅ | Efficient ✅ | Reverse H&S complete – price entering neckline zone |
| 30min | Bullish ✅ | Inefficient ❌ | Clean BOS – ready for potential continuation |
| 2H | Bullish ✅ | Inefficient ❌ | HL confirmed – clear bullish delivery range ahead |
---
## 🧠 Key Insights:
- **Left Shoulder - Head - Right Shoulder** clearly visible and now validated with neckline break
- Price is reacting from **last TLQ + ILQ zones** with MSU
- Strong **liquidity gap** above 3,380–3,405 likely to be targeted
- **Highs around 3,420–3,440** may act as liquidity magnet if clean break happens
- **BOS and CHoCH** confirmed across all LTFs — strong bullish intent
- Structure remains **bullish** as long as 3,312–3,320 HL holds
---
## 🎯 Price Zones to Watch:
| Zone | Action |
|--------------|----------------|
| 3,335–3,340 | OB Flip Support / Demand (Retest Possible) |
| 3,368–3,375 | Reaction Zone / Short-Term Take Profit |
| 3,404–3,420 | Major Liquidity Above / SH Grab |
| 3,428–3,440+ | Stop-Hunt Potential for Final Exit |
---
## 📌 Trade Scenarios:
### 🟢 Long Setup
- **Entry:** 3,340–3,348 (OB retest or continuation)
- **SL:** below 3,328
- **TP1:** 3,375
- **TP2:** 3,400
- **TP3:** 3,420+
### 🔴 Caution for Short
Only valid if price shows **CHoCH + strong rejection** from above 3,420–3,440.
Otherwise, trend continuation is dominant.
---
## 🧭 Summary:
> Gold continues its bullish structure in all LTFs.
> Reverse H&S has broken neckline cleanly.
> Momentum + inefficiency zones above = clear drive to liquidity.
> Patience is key – reentry on OB retest = high R/R setup.
---
🖋️ Prepared by: **Mohsen Mozafari Nejad**
*Smart Money | Liquidity Zones | Order Blocks | MSU/MSD Framework*
XAUUSD: Market analysis and strategy on July 2Gold technical analysis
Daily chart resistance 3400, support 3250
4-hour chart resistance 3355, support 3300
1-hour chart resistance 3345, support 3325
After gold adjusted to 3247, bulls launched a counterattack. This position is the 0.618 support from 3121 to 3451. It rose by $100 in two trading days. Bulls are still strong. Although the war is sometimes tense and sometimes relieved, the global geopolitical environment and economic environment are continuously getting worse step by step. This support logic has never changed. Even if it is temporarily relieved, gold will usher in a correction, but it is only a correction. Overall, the fundamental logic of the bull market has not changed.
Gold price reached 3358 and then fell back. Today, it fell below 3336 and continued to fall. The support point below is around 3325/3310. It continues to rise after the fall. It is necessary to pay attention to the specific point where it will stop falling and stabilize during the trading session. As far as the current market is concerned, it hit 3328 today to stop falling and rebound, and temporarily held the support position of 3325. It is bullish based on this position. There are ADP data today and NFP data tomorrow. Pay attention to the impact after the data is released.
BUY:3330near
BUY:3300near
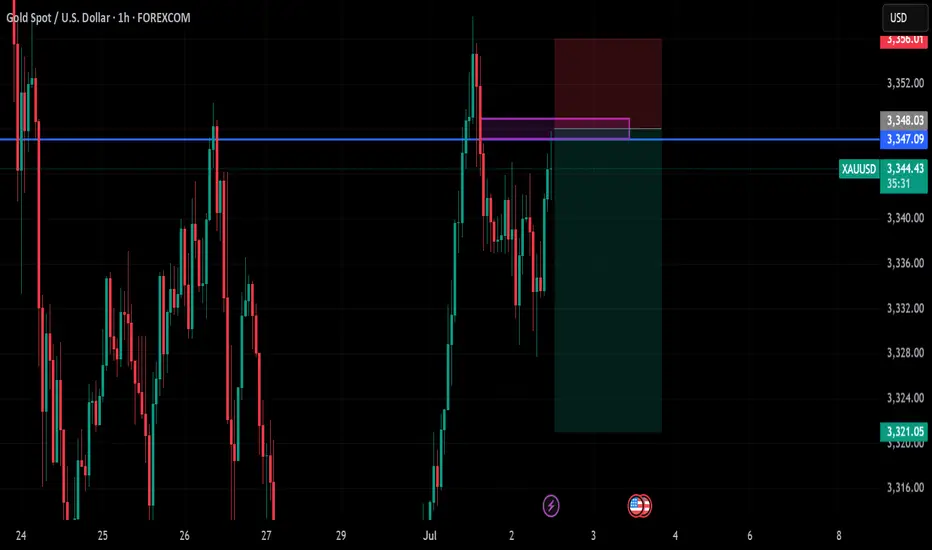
gold on sell retrace#XAUUSD still on sell reverse, between 3347-3348 holds sell reverse. But if current H1 closes above 53 then bullish starts.
Sell limit 3347-3348, target 3320, stop loss 3356.
Above 3353 have bullish on H1 closure, target 3370