XAU/USD – Long off Lower Channel + Fundamental Tailwind📌 Bias: Bullish (technical + macro alignment
🔹 Trade Setup
Entry Zone - 3 245 – 3 255
Stop-Loss - 3 240
TP1 - 3 375 (Last Month High)
TP2 - 3 475 (Upper Channel)
🧠 Technical Rationale
- Price is respecting a clean ascending channel
- Confluence at entry: lower trendline + last month’s low + hidden order block
- Liquidity sweep expected below 3 245 before bullish continuation
🌍 Fundamental Tailwinds (July 2025)
🏦 1. US Dollar Collapse
- The US Dollar Index (DXY) is down 10.8% YTD, its worst start since 1973
- Driven by:
- Trump’s erratic tariff policies and fiscal expansion
- Loss of confidence in US Treasuries as a safe haven
- Moody’s downgrade of US credit rating
“The dollar has transformed from a safe haven into a symbol of instability.” – ING strategist
🪙 2. Central Bank Gold Demand
- Global central banks continue accumulating gold to hedge against dollar devaluation
- This institutional demand underpins long-term bullish momentum
🔥 3. Geopolitical Risk Premium
- Ongoing tensions in the Middle East (Iran–Israel, Gaza) and Russia–Ukraine keep gold attractive as a safe-haven asset
- Even with temporary ceasefires, the risk premium remains embedded in price
📉 4. Fed Dovish Shift
- Fed Governor Waller signals a possible July rate cut, citing weak labor data and easing inflation
- Lower rates = weaker dollar = stronger gold
🧠 Final Thought
This setup isn’t just technically sound—it’s fundamentally explosive. You’re riding a macro wave of dollar weakness, geopolitical hedging, and central bank gold demand. If price reacts cleanly at 3 250, this could be your high-conviction entry of the month.
XAUUSD.F trade ideas
7/2 Trapped Orders from Yesterday Turned ProfitableGood morning, everyone!
Yesterday’s early-entry gold short position encountered some temporary drawdown, but thanks to flexible adjustments, the trade has now moved into profit overall.
Currently, the price is hovering near a key support area. Based on the 1H and 2H charts, there is still room for further downside. At this point, there are two strategic options:
Close the position to lock in current profits;
Hold the position and wait for further decline, keeping in mind that if support holds, the price may rebound back toward the 3350 level, introducing some risk.
You can decide whether to stay in the trade or exit, depending on your risk tolerance and trading plan.
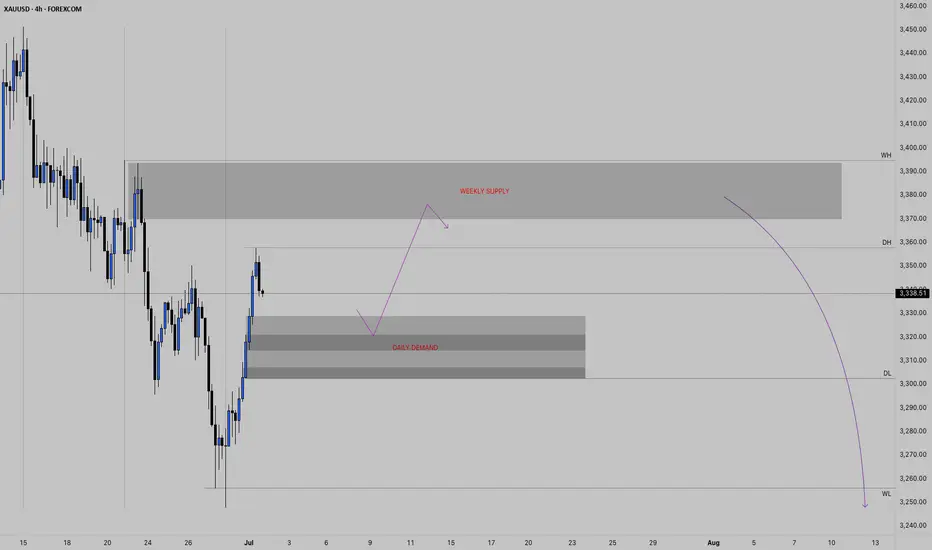
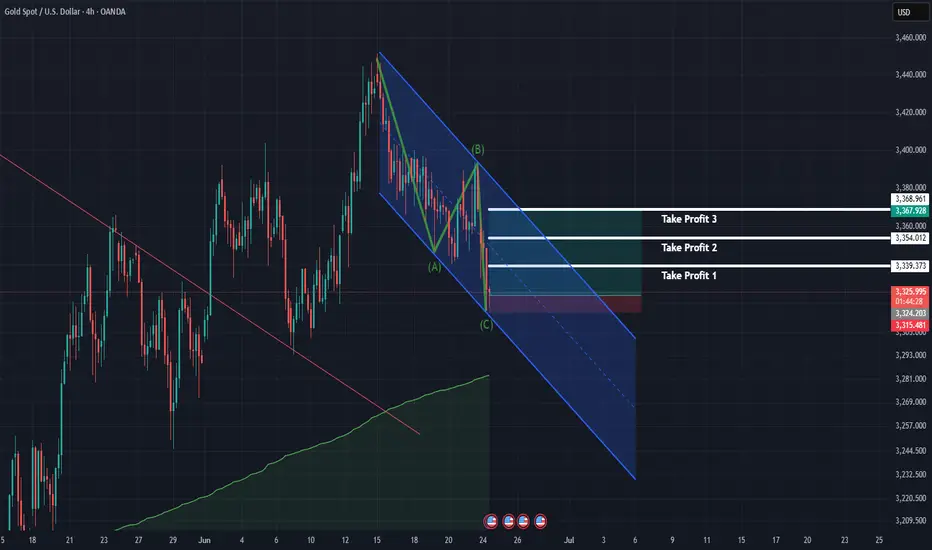
GOLD 4HAfter a strong rally, finally the promise of a pull back. This could run further into the daily demand before a continuation into the weekly highs.
Keeping an eye on the shaded regions within the daily demand.
Invalidation will be a closure on the daily timeframe beneath the daily demand region.
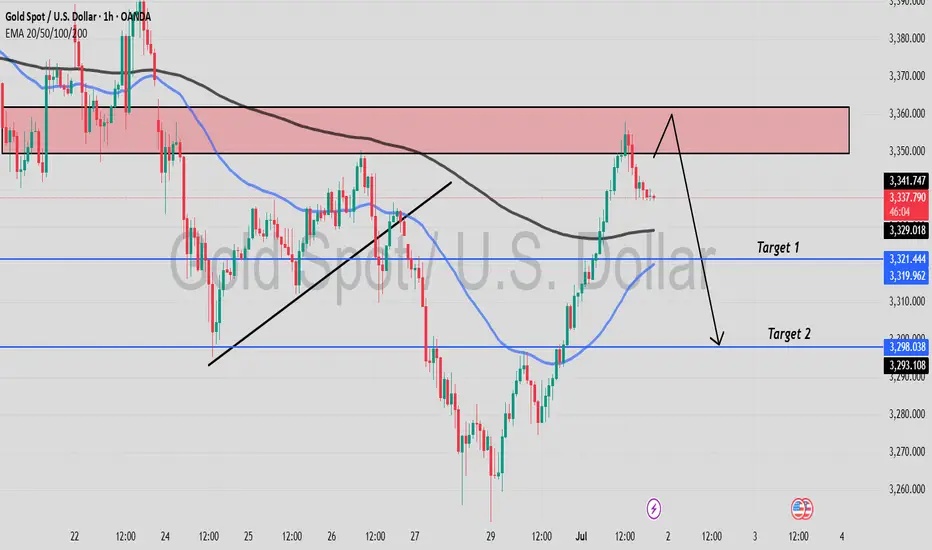
Gold is in the Bearish DirectionHello Traders
In This Chart GOLD HOURLY Forex Forecast By FOREX PLANET
today Gold analysis 👆
🟢This Chart includes_ (GOLD market update)
🟢What is The Next Opportunity on GOLD Market
🟢how to Enter to the Valid Entry With Assurance Profit
This CHART is For Trader's that Want to Improve Their Technical Analysis Skills and Their Trading By Understanding How To Analyze The Market Using Multiple Timeframes and Understanding The Bigger Picture on the Charts
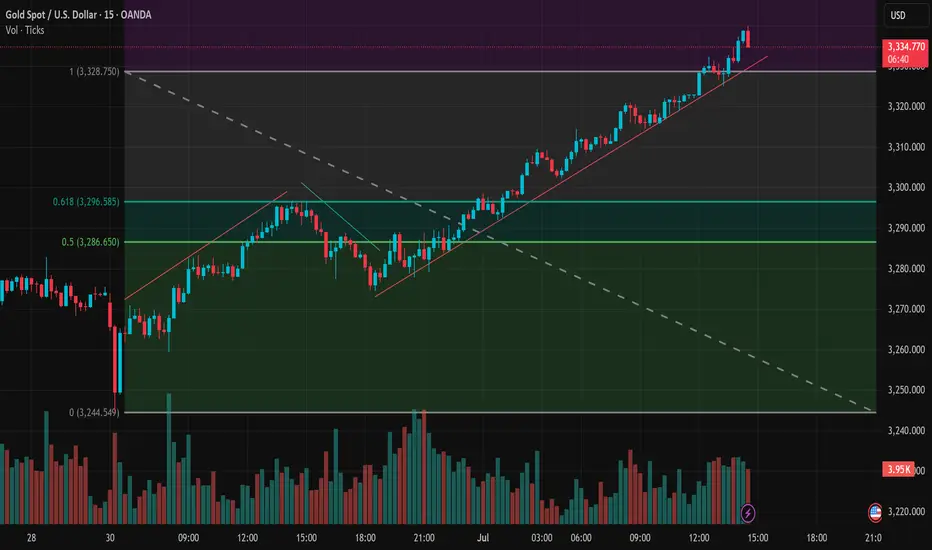
XAUUSD Maintains Bullish MomentumTechnical Analysis of XAUUSD – 15-Minute Chart – July 1st, 2025
In the latest trading session, XAUUSD continues to demonstrate a strong short-term uptrend. The 15-minute chart clearly shows a series of higher highs and higher lows, indicating that buyers remain in control.
1. Trend Structure
After a brief pullback from the June 30th high, price quickly rebounded and has been respecting the rising trendline, reflecting strong buying momentum.
From midnight (July 1st) to the present, a sequence of bullish candles—especially long-bodied green candles—has appeared, accompanied by increasing volume, confirming that strong capital inflow is entering the market.
2. Trading Volume
Volume has been gradually increasing along with the price rise, especially during minor breakout points. This suggests real buying pressure, not a false pump.
3. Key Support and Resistance Zones
Short-term support: Around 3,320 USD – a confluence of the rising trendline and recent swing lows.
Next resistance zone: Between 3,345 – 3,350 USD – previously a strong supply area. It should be closely monitored to see if price can break through.
4. Suggested Trading Strategy
Priority should be given to buying on dips, especially if price retraces to the 3,320 – 3,325 area and confirms with bullish candlestick patterns or volume support.
Avoid chasing entries near 3,345 – 3,350 without a clear breakout confirmation.
Conclusion:
XAUUSD is showing a clearly defined bullish trend in the short term. Buyers remain dominant, but caution is advised around key resistance levels. Wait for confirmation before expanding positions.
What do you think about this rally? Are you already in the trade or still on the sidelines? Drop your thoughts below – let’s discuss!
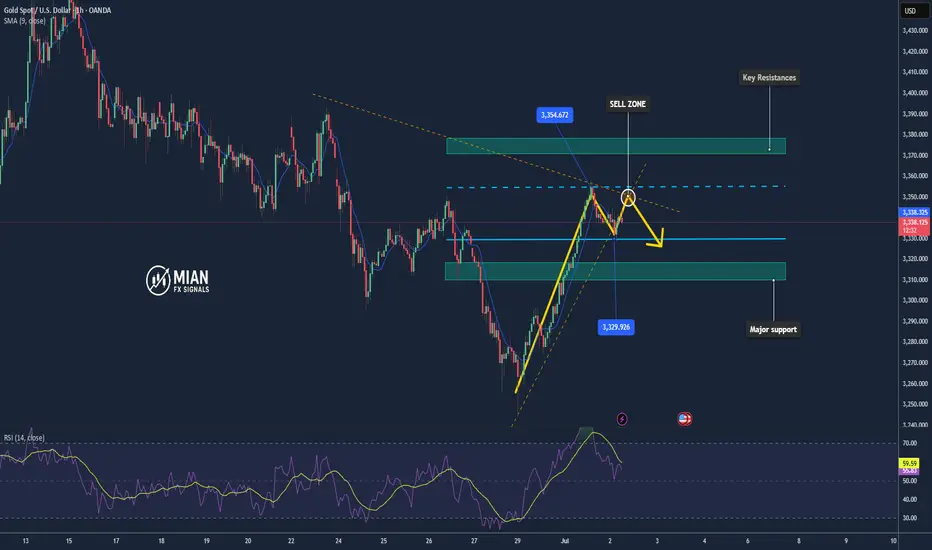
6.30 Safe haven disappears, gold loses its luster!Gold did not break through the upper pressure at midnight last Friday. Gold fell directly after opening in the morning on Friday. The bears broke through the previous 3295 support line, and the lowest reached 3255 in the evening. It closed at around 3274, and the daily line also closed in the form of a big Yin line.
From the 4-hour analysis, the upper short-term resistance focuses on the 3295-3301 line, and the 3316 line is focused on. In terms of operation, it is still rebounding and continuing to be short and follow the trend to fall. The short-term support below focuses on the 3250-3255 line. The overall high-altitude participation tone remains unchanged relying on this range. I will remind you of the specific operation strategy during the session, and pay attention to it in time.
Gold operation strategy:
1. Short gold rebounds at the 3295-3301 line, and short gold rebounds at the 3314-16 line, stop loss at 3326, target 3255-3260 line, and continue to hold if it breaks;

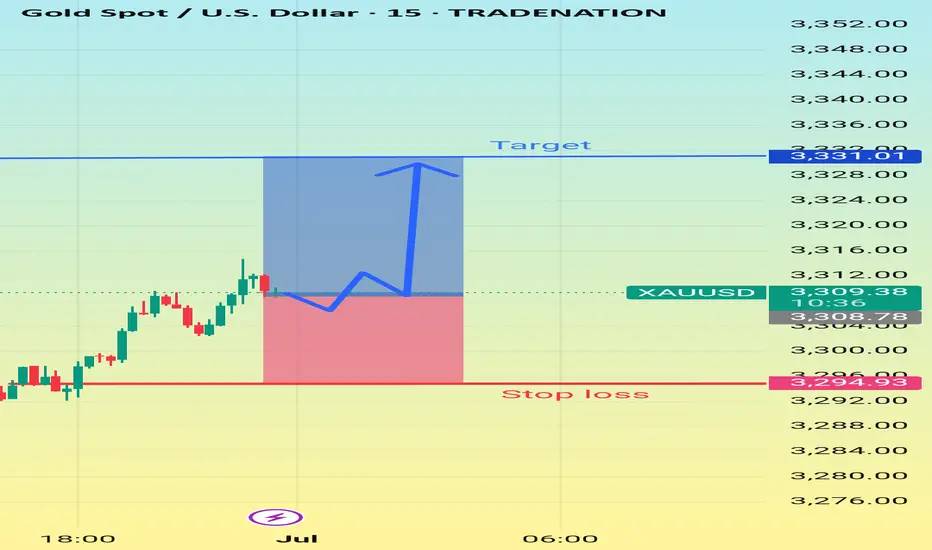
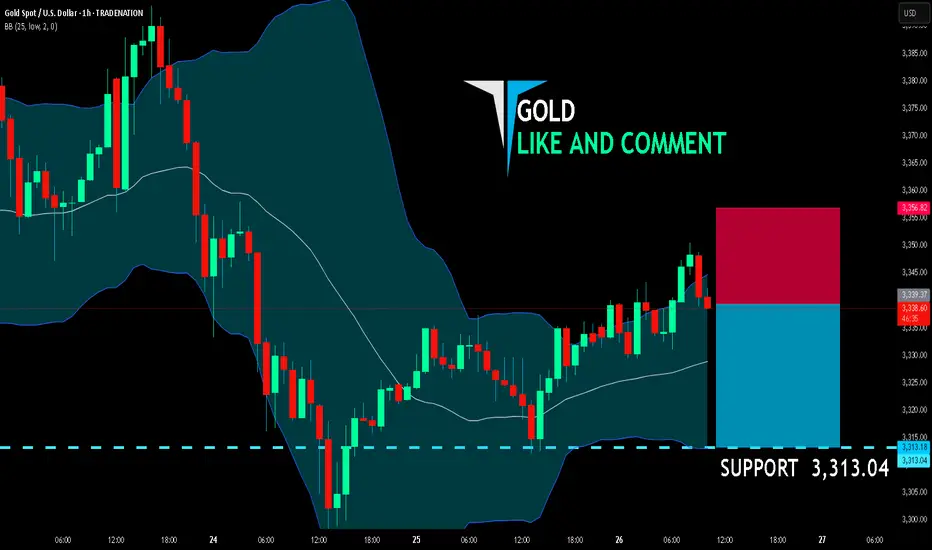
GOLD SELLERS WILL DOMINATE THE MARKET|SHORT
GOLD SIGNAL
Trade Direction: short
Entry Level: 3,339.37
Target Level: 3,313.04
Stop Loss: 3,356.82
RISK PROFILE
Risk level: medium
Suggested risk: 1%
Timeframe: 1h
Disclosure: I am part of Trade Nation's Influencer program and receive a monthly fee for using their TradingView charts in my analysis.
✅LIKE AND COMMENT MY IDEAS✅
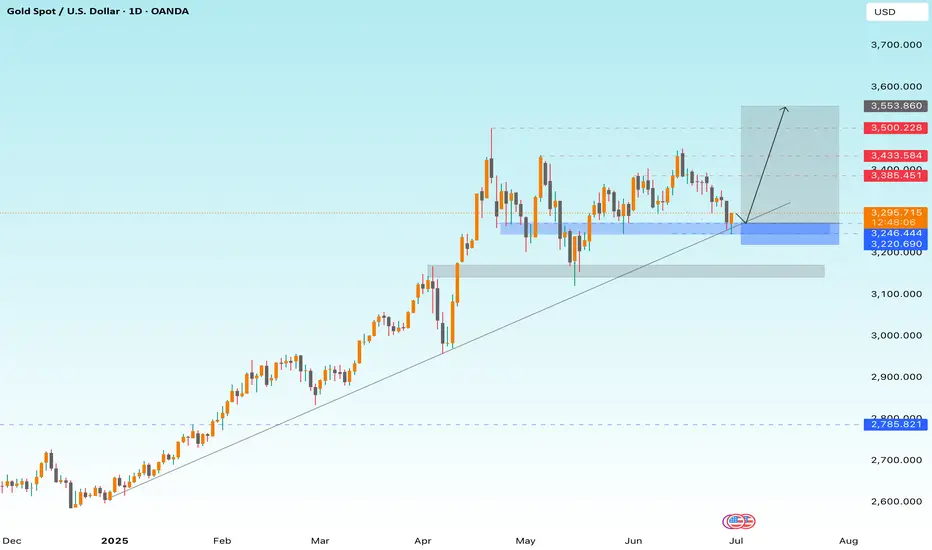
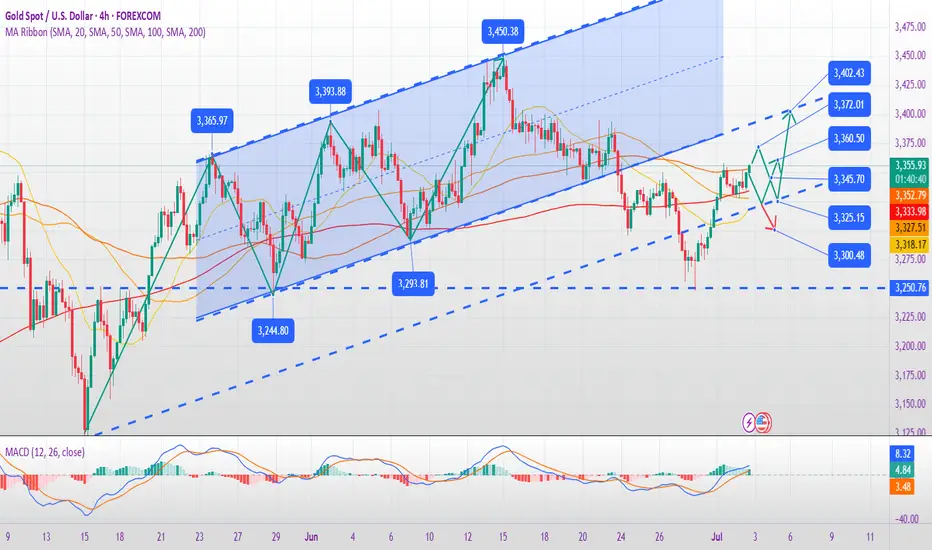
GOLD +2500 pips setup — Trendline Holds , Fed Pressure Builds !📊 GOLD XAU/USD Daily Analysis
✅ Technical View:
Gold continues to respect a strong bullish trendline, holding above key demand zones (3220 – 3290).
A solid retest of the trendline and the blue demand area supports the bullish continuation.
Upside targets are:
3385 (first target)
3433 – 3500 (next resistances)
3553 (extended target if momentum holds).
✅ Fundamental Insight:
Ongoing market pressure on the Federal Reserve to cut interest rates is boosting gold’s safe-haven appeal.
Lower US yields and increased uncertainty strengthen the bullish bias for gold in the mid-term.
🎯 Key Levels:
✅ Supports: 3220 – 3290 (main) | 2785 (long-term)
✅ Resistances: 3385 – 3433 – 3500 – 3553
📢 If you like strong, clear setups:
Don’t forget to Like 👍 – Comment 💬 – Share 📤 – and Follow 🔔 me here on TradingView for more powerful ideas every week!
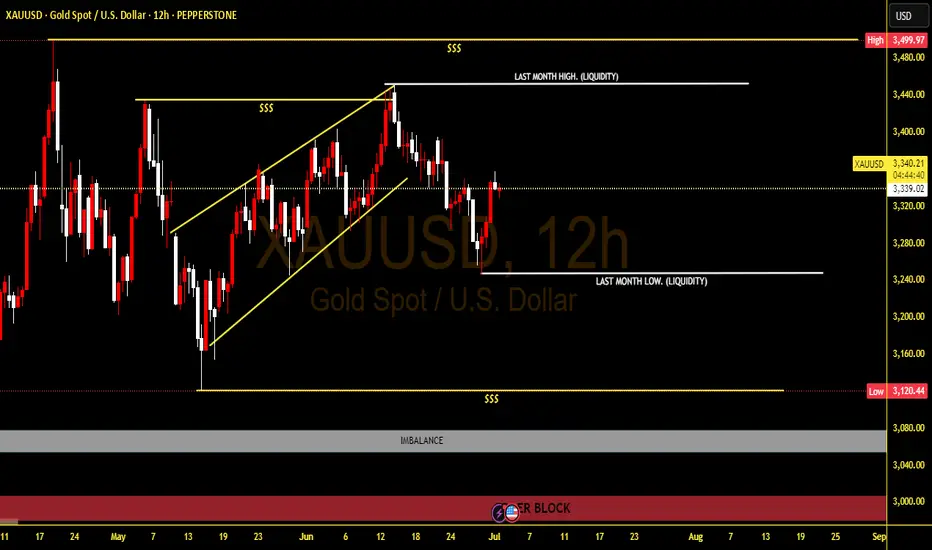
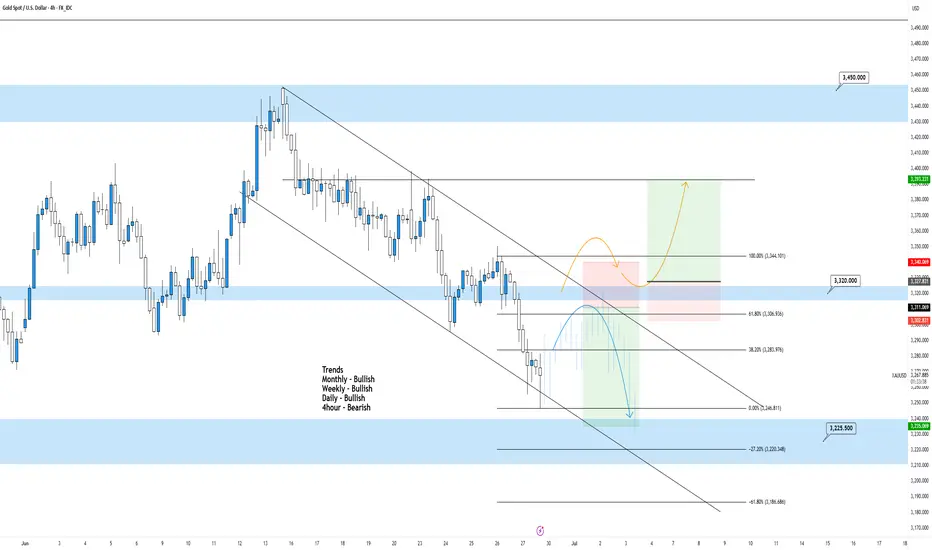
XAUUSD 4hour TF - June 29th, 2025XAUUSD 4hour Neutral Idea
Monthly - Bullish
Weekly - Bullish
Daily - Bullish
4hour - Bearish
Gold has been on the rally of a century for a while and isn’t showing too many signs of slowing down long term. For now we do have a couple opportunities I can bring to your attention.
4hour bearish continuation - For this to happen we would like to see price action come back to our pocket of confluence near the 3,320.000 level followed by bearish conviction. If this happens look to target lower toward major support levels like 3,225.500.
4hour trend reversal - If we are to see a reversal of the 4hour trend we would need to see price action pop back above the 3,320.000 resistance area. Look for strong bullish conviction above this level and target higher toward appropriate levels of resistance.
Report - 27 june1.
Bond Market Exodus: Why Investors Are Ditching US Long-Term Debt
In Q2 2025, net outflows from US long-dated bond funds hit $11 billion, marking the fastest pace since early 2020. This comes despite more than $39 billion pouring into short-dated funds, which are still yielding attractive real returns due to the Fed's high policy rate.
This flight from the long end is not just about yield differentials — it’s a clear repricing of sovereign risk and fiscal sustainability. The market is beginning to fear that the US is no longer a guaranteed safe haven at the long-duration end of the curve. President Trump’s renewed tax policies — projected to add trillions to the national debt — are weighing on confidence, while incoming tariffs and the risk of structurally higher inflation amplify concerns.
“There is a lot of concern domestically and from the foreign investor community about owning the long end of the Treasury curve.” – Bill Campbell, DoubleLine
Market Implication: The term premium is re-emerging — longer bonds must offer significantly higher yields to attract buyers. In real terms, longer-dated Treasuries are down ~1% this quarter, clawing back losses after tariff-induced volatility in April.
Strategic Allocation:
Stay overweight short-duration debt (SHY, BIL, floating-rate notes) for yield preservation and minimal duration risk.
Avoid duration extension. TLT, ZROZ, and long-dated corporates may face additional downside as issuance ramps and demand fades.
Consider non-dollar fixed income exposure (e.g., EU sovereigns, South Africa, Brazil), particularly where inflation targeting credibility is rising.
Macro Impact:
This shift jeopardizes debt affordability. With $33 trillion in debt and rising interest expense, the US could face debt spiral risks unless inflation softens or fiscal discipline returns. An elevated term premium can ripple into mortgages, corporate borrowing, and municipal finance, potentially crowding out private investment.
2.
Geopolitical Tensions: Iran's Nuclear Program and the Market's Response
Despite US claims of obliterating Iran’s nuclear capabilities in recent strikes, preliminary European intelligence indicates Iran’s 408kg stockpile of highly enriched uranium remains largely intact. It was reportedly dispersed before the attacks — undercutting the narrative of complete neutralization.
President Trump’s remarks, suggesting “nothing was taken out” of the main Fordow facility due to logistical constraints, reflect a public relations overstatement rather than a decisive strategic victory. While US defense officials stand by the attack’s symbolic impact, reports suggest the nuclear program was set back by months, not years.
“Trump exaggerated because he needed to... Anyone who heard his remarks could tell there was a different reality.” — Ayatollah Ali Khamenei
Market Implication:
The gold price remains elevated, closing at $3,328.22, up 0.15% on the day, and +26.81% YTD — a clear hedge against geopolitical instability.
Oil markets initially spiked but reversed as the Israel-Iran ceasefire held. Brent Crude ended at $67.14, down -6.1% over the week.
Defense stocks, particularly in US and Israeli names, are seeing flows as investors anticipate further defense budget expansions.
Strategic Allocation:
Hold or overweight gold (GLD, XAUUSD) in strategic portfolios as a volatility hedge.
Avoid chasing oil at interim highs unless further strikes materialize — use energy exposure as a short-term trade, not a structural bet.
Monitor Iranian retaliation risk and its effect on shipping lanes, which would impact insurance costs and transport-linked equities.
Macro Impact:
With Iran's capacity largely intact, nuclear diplomacy is effectively frozen. The uncertainty adds to regional instability, and markets may underprice the risk of a re-escalation. Meanwhile, continued weapons development forces global powers to shift attention (and potentially resources) away from economic diplomacy.
3.
US Export Collapse: Trade Policy Bites the Domestic Economy
In May, US goods exports fell by $9.7 billion (–5.2%), marking the largest monthly decline since the pandemic crash in 2020, according to the Census Bureau. Exports totaled $179.2 billion, sharply down from April’s figures.
This contraction followed President Trump’s "Liberation Day" tariff blitz, which spooked global trading partners. Despite some tariff suspensions, others — such as a blanket 10% duty and sector-specific metals tariffs — remain active.
“Amid the de-escalation phase of the tariff story, we are now seeing an unwind in both imports and exports.” — James Knightley, ING
Key Export Drivers:
Industrial supplies (crude oil, metals): Down 13.6% in May after a 16% surge in April.
Vehicle exports: Rebounded +3.5% after a 20% drop in April.
Trade deficit: Widened to $96.6 billion, above expectations.
Practical Market Implications:
Logistics & industrial names (FedEx, Caterpillar) face short-term margin pressure.
Commodities sensitive to trade flows — particularly metals — could see softening demand (watch steel and copper ETFs like SLX and COPX).
Dollar exposure may become more volatile as lower exports pressure the current account, contributing to a weaker dollar narrative.
Broader Economic Impact:
With inventories full and international demand softening, US manufacturing will decelerate.
Capex and employment in export-sensitive sectors are at risk if the trade environment doesn’t stabilize.
Investor Strategy:
Short-term caution on transportation (e.g., FedEx reported a sharp drop in China-US freight).
Reallocate toward domestic-facing sectors (utilities, consumer staples) that are more insulated from trade.
Currency traders may view this as a signal to fade the USD if combined with Fed dovishness.
4.
US Debt Avalanche: The Bond Exodus and What It Means for Markets
Investors are rapidly fleeing long-term US bonds, with net outflows reaching $11 billion in Q2, the sharpest retreat since early 2020, according to EPFR data. This comes amid growing concern over the US’s ballooning debt load, worsened by Trump’s proposed tax cuts and trade tariffs.
“It’s a symptom of a much bigger problem... concern about owning the long end of the Treasury curve.” — Bill Campbell, DoubleLine
Why It Matters:
Trump's tax plan is forecast to add trillions to federal debt, compelling the Treasury to issue a flood of bonds.
Simultaneously, tariffs are feared to fuel inflation, which erodes bond values — especially those with long durations.
Market Movement:
Long-term US debt fell ~1% in Q2 (Bloomberg index).
In contrast, short-term US bond funds gained $39 billion in inflows, driven by high yields at the front end of the curve.
“With inflation still above target and heavy government supply, this is driving skittishness about the long end.” — Robert Tipp, PGIM
Practical Investment Outlook:
Expect higher yields at the long end of the curve if debt issuance remains elevated and inflation expectations rise.
Flattening yield curve risk if short-end rates remain high while long-end selling continues.
Duration-sensitive portfolios (e.g. pensions) may suffer performance drag unless repositioned.
Global Spillovers:
A weaker long bond market raises benchmark rates globally, making it costlier for emerging markets to borrow.
Foreign investors (e.g., Japan and China) may diversify out of Treasuries, potentially moving capital into higher-yield EM debt or European assets.
The sell-off contributes to dollar weakness, especially when coupled with trade disruptions and Trump’s criticism of the Fed.
Investor Strategy:
Reduce duration exposure; consider floating-rate notes or shorter-dated fixed income instruments.
Explore international bonds, especially EM local currency debt, which is currently outperforming.
Use steepening yield curve trades (e.g., 2s/10s steepeners) as a way to hedge fiscal risks.
5.
Iran’s Nuclear Resilience: What Intel and Markets Tell Us
Despite claims from President Trump that Iran’s nuclear capabilities were “obliterated” in recent airstrikes, early intelligence assessments suggest otherwise. According to European and US officials, Iran’s 408kg stockpile of near-weapons-grade uranium remains largely intact, having been dispersed to other locations before the strikes.
“It did not achieve anything... Trump exaggerated.” — Ayatollah Ali Khamenei
Strategic Interpretation:
US and Israeli strikes targeted Fordow, Natanz, and Isfahan — key nuclear infrastructure.
While significant damage occurred, no total structural collapse was confirmed.
This reinforces that Tehran maintains breakout capacity, and could resume enrichment rapidly if it chose to.
“The nuclear programme suffered enormous damage... but not complete destruction.” — Rafael Grossi, IAEA
Market Impact and Geopolitical Outlook:
The revelation that Iran’s uranium reserves survived the assault reduces confidence in the effectiveness of US deterrence.
Oil markets remain unfazed. Traders priced in the symbolic nature of Iran’s missile response and read the US-Israel actions as limited in strategic disruption.
Brent crude fell sharply by 6.1% to $67/bbl post-ceasefire — evidence markets anticipate no extended supply shock.
What to Expect:
Volatility premium on oil is falling. No major disruption to Strait of Hormuz = no major repricing.
Increased likelihood of backchannel diplomacy, especially as Tehran seeks to assert survival and avoid regime destabilization.
However, shadow escalation (e.g., cyber, proxy strikes) remains plausible.
Practical Asset Implications:
Oil traders are in sell-the-spike mode: Risk-on reactions are now short-lived.
Defensive commodity plays (e.g., gold) saw a pullback as perceived geopolitical risk faded.
Military-industrial equities may experience cooling momentum unless new threats emerge.
Risk of sanctions rollbacks or renegotiations could reprice energy and emerging market assets tied to Iran’s trade (e.g., India, China).
6.
Export Shock: Tariffs Bite into US Trade Performance
US goods exports plummeted by 5.2% in May, marking the sharpest drop since 2020, as President Trump’s aggressive “Liberation Day” tariff strategy triggered a major disruption in global demand for American goods. Total exports fell to $179.2bn, down $9.7bn from the prior month.
Breakdown:
Industrial supplies (including oil and metals): –13.6%
Vehicles: +3.5% (recovering from a –20% collapse in April)
Trade deficit widened to $96.6bn, beating Wall Street expectations.
“This is the tariff shock starting to filter into real data.” — ING’s James Knightley
Economic Implications:
Tariff retaliation and inventory overhang are key drivers of the export decline.
Partners reduced US imports anticipating further tariffs or supply chain reshuffles.
The loss of export revenue compounds fiscal stress, especially with simultaneous tax cuts and increased military spending.
Sectoral Risks:
Energy exporters (e.g., Texas oil firms) are hit hard — crude exports falling.
Industrial metals and machinery producers face slower foreign orders.
Shipping and logistics (e.g., FedEx) flagged the US–China lane as the weakest and most unpredictable trade route.
Market Outlook:
Dollar weakness persists, with the Dollar Index near a 3-year low, reflecting investor fear over twin deficits (fiscal + trade).
Equities may remain resilient, especially domestically focused or tariff-insulated names.
However, multinationals with global exposure could underperform due to shrinking foreign sales.
What to Expect:
Volatility in trade data until clarity returns on tariff regimes.
Renewed calls for bilateral trade talks or exemptions from key US partners (e.g., EU, Mexico).
Watch for nearshoring trends to accelerate as companies avoid tariff risk.
7.
EM Rally: Emerging Markets Outshine Developed Peers Amid US Fiscal Anxiety
In a stunning reversal of past trends, emerging market (EM) assets are rallying across asset classes in 2025 — defying both the global macro gloom and the shadow of US tariff policy.
By the Numbers:
JPMorgan EM Local Bond Index: +10% YTD
MSCI EM Equity Index: +10%
MSCI World (Developed Markets): +4.8%
EM bonds in global AUM: Rising from a low 5% share
This rotation reflects a clear diversification trend away from dollar assets, fueled by erratic US policymaking, record federal debt, and a weakening dollar. The Treasury-specific risk premium is rising — and EMs are absorbing the flow.
Drivers of the Rally:
Dollar weakness: Eases FX pressure, gives central banks room to cut.
Inflation-adjusted yields in EMs at 20-year highs, making debt highly attractive.
Declining fiscal risks in EMs contrast with ballooning G7 debt burdens.
China and South Korea lead equity optimism with innovation themes and policy clarity.
“Even small inflows are having disproportionately large effects.” — Goldman Sachs’ Kevin Daly
Risks and Rotation:
Geopolitical conflict in the Middle East did not dent EM flows — a clear sign of confidence in regional resilience.
Oil prices falling reduced tail risks for EM energy importers like India and South Korea.
Still, EM equity outflows in Q1 were sizable (–$22bn), only partially reversed in May–June (+$11bn net).
Practical Strategy for Investors:
Local currency bonds in Brazil, South Africa, Indonesia — rich yields, FX tailwinds.
Tech-heavy equity plays in China and Taiwan — exposure to global AI boom.
EM corporates still lag — cautious positioning advised due to higher default risk.
What to Watch:
Further EM policy easing, especially in Asia, will support equities.
US yield volatility may occasionally disrupt flows, but the narrative has shifted.
Multi-asset portfolios should consider overweighting EM exposure tactically in H2 2025.
8.
Shell, Sovereign Risk, and the Oil Sector Outlook: BP Takeover Denied, Sector Under Pressure
Shell’s explicit denial of takeover talks with BP, despite media speculation, offers clarity but also raises key strategic questions for the European energy sector. The sector continues to grapple with sluggish price action, mounting decarbonization pressures, and a renewed focus on capital discipline.
Key Takeaways:
Shell stated it had “no intention” of acquiring BP and had not been in talks, invoking a six-month standstill period under UK takeover law.
BP shares rose 1.3%, Shell +0.5%, largely a relief rally and not based on synergies.
This quells short-term merger speculation, but it underscores the pressure on oil majors from activist investors (e.g., Elliott’s 5% stake in BP) demanding deeper cuts, higher returns, and optionality in energy transition strategy.
“Shell has preferred buybacks to acquisitions.” — Wael Sawan, CEO
Sector-Wide Implications:
BP’s aggressive renewables push has backfired, denting valuation and making it a takeover target.
Oil majors are capital-rich but investment-conservative, amid uncertain demand outlook and energy policy volatility.
High integration costs and risk of job losses are politically toxic, limiting mega-deal feasibility.
Practical Market Interpretation:
With Brent crude hovering around $68–$70, oil equities remain valuation-sensitive and vulnerable to dividend cuts or FX shocks.
Investors should favor capital-efficient names with strong free cash flow and disciplined buyback programs.
Avoid speculative merger plays; instead, track cost reduction execution and decarbonization pace.
What to Watch:
Further activist pressure on BP and Total to streamline operations.
Potential US M&A activity in smaller shale players instead of global giants.
Any signs of OPEC+ discord or US SPR use amid volatile demand expectations.
9.
New World Development: Hong Kong’s Property Giant Faces Systemic Risk
New World Development (NWD), one of Hong Kong’s largest property conglomerates, is undergoing a delicate refinancing operation amid ballooning debt, weak property sales, and a declining tourism-reliant retail economy. The implications ripple across the Asian credit markets, Chinese property sector, and Hong Kong's financial stability.
Key Financials:
Net debt: HK$124.6bn
Refinancing talks: HK$87.5bn in bank loans
Interest costs > operating profits in 2H FY2024
Annual loss: HK$20bn, the first in two decades
Shares down 22% YTD, market cap ~HK$14bn
The developer’s leverage and stalled mainland China expansion expose it to credit market deterioration, at a time when trust in property-linked balance sheets is thin.
“It won’t be a question of how much you’re willing to pay — the cover won’t be available.” — Everest CEO Jim Williamson, referring to US casualty insurance but resonant here too.
Systemic Concerns:
Barclays estimates NWD accounts for 7% of all HK commercial property loans — nearly double Evergrande’s systemic exposure in mainland China.
Property defaults or asset fire-sales could cause bank provisioning hikes, spread to retail REITs, and exacerbate deflationary pressures.
Mitigating Actions:
NWD pledged flagship assets (e.g., Victoria Dockside) as collateral.
Actively selling projects at discounts.
Chow Tai Fook Enterprises selectively buying assets, indirectly supporting liquidity.
However, refusal to engage with bondholders, deferred perpetual interest payments, and a leadership reshuffle have eroded market confidence.
Strategic Implications for Investors:
Avoid unsecured Chinese real estate debt—bondholder transparency is poor.
Favor secured exposure or government-backed REITs tied to stable rental income.
Look for HKMA guidance: policymakers are signaling banks to avoid panic provisioning, implying the government will step in to prevent contagion.
Broader Macro Read:
Reflects fragility of China’s "recovery-lite" property model, where urban development exceeds real demand.
HK real estate’s softening is also a proxy for declining mainland tourism, rising capital costs, and shifting investor preferences.
10.
Meta’s Copyright Win: Legal Green Light for AI Model Training
Meta's recent legal victory over authors suing for unauthorized use of books in AI training marks a critical turning point in the legal framework surrounding AI development. The U.S. District Court ruled that the tech giant’s use of millions of texts to train its LLaMA models constituted “fair use”, delivering a massive tailwind to AI innovation — and to equity investors betting on the sector.
Case Summary:
Plaintiffs included notable authors like Ta-Nehisi Coates.
Meta trained its AI on LibGen-sourced books without permission.
Judge Chhabria: Ruled for Meta due to “poor argumentation” by plaintiffs — not because the court inherently favored AI use.
“This ruling does not stand for the proposition that Meta’s use of copyrighted materials to train its language models is lawful. It stands only for the proposition that these plaintiffs made the wrong arguments.” — Judge Vince Chhabria
Precedent and Practical Impact:
Reinforces the fair use doctrine for transformative technologies.
Encourages aggressive data utilization strategies by other firms.
Raises the bar for future copyright suits, requiring stronger arguments like market harm (e.g., reduced author royalties).
Implications for Tech and Equity Markets:
AI development costs may fall sharply as legal uncertainty fades.
Generative AI leaders (Meta, Anthropic, OpenAI) now face fewer near-term litigation barriers.
Paves the way for AI ETF inflows, bolsters AI-leveraged tech indices (e.g., SOXX, QQQ).
Equity long positions in semis (NVDA, AMD), cloud (MSFT, GOOGL), and enterprise AI (CRM, ORCL) become even more strategic.
Regulatory Outlook:
A longer-term battle is likely over “market dilution” claims.
Courts may soon have to decide whether AI-generated outputs undermine economic incentives for human creators.
Policy frameworks from the EU or US Congress are likely within 12–18 months.
Strategic Takeaways for Investors:
Increase exposure to AI infrastructure (e.g., Nvidia, Micron, Arista).
Maintain vigilance on evolving IP litigation trends — regulatory tone may shift depending on 2025 political outcomes.
Avoid over-concentration in companies still facing unresolved copyright or data privacy battles (e.g., Open-source LLMs with gray training data).
11.
ETF Innovation: ‘Autocallables’ Go Retail – A Structural Shift in Yield Exposure
The launch of the first US-listed ETF tracking autocallable structured products by Calamos Investments, with JPMorgan support, signals a transformative shift in how retail investors access complex income strategies. Once limited to ultra-high-net-worth clients, these derivatives — with yields near 14.7% — are now democratized through a simple ticker trade.
What Are Autocallables?
Autocallables offer periodic coupons unless a linked index (e.g., S&P 500) falls below a pre-set barrier. If the barrier is breached consistently, investors risk losing principal. They are akin to structured credit instruments but are tied to equity indices, not borrowers.
Triggered by market declines.
Maturity: typically 3 years, quarterly checks.
Final protection barrier: ~60% of starting level — breach = principal loss.
ETF will hold 52+ autocallables diversified by issuance date.
Investment Mechanics:
Calamos Autocallable Income ETF (CAIY) charges 0.74% annual fee — above the average for US derivative-income ETFs (0.51%).
It’s part of a wider trend: structured outcome ETFs have exploded from $3.5bn in 2019 → $179bn today (Morningstar).
Mimics yield exposure of high-yield bonds, but linked to equity volatility.
Analyst Commentary:
Ben Johnson, Morningstar: “ETFs are taking share from all financial products — not just mutual funds, but also from bespoke structured notes.”
Elisabeth Kashner, FactSet: warned of misunderstanding risks: “Advisers will struggle to explain these. If markets fall, protection and yield disappear.”
Practical Implications:
Retail investors gain access to high-yielding structured credit proxies.
If adopted at scale, this could divert flows from traditional high-yield bonds and annuities.
Volatility derivatives embedded in autocallables will impact options markets and hedging strategies.
Risk Outlook:
In a sharp downturn, coupon stops and capital protection collapses — potentially leading to double-digit losses.
These ETFs may suffer sudden illiquidity if linked indices breach multiple trigger levels at once.
Systemic Considerations:
Broad adoption of these ETFs could amplify equity downside during sharp corrections — as dealers hedge risk via S&P futures.
Scenario: A systemic correction triggers autocallable barrier breaches, prompting delta-hedging cascades → market destabilization.
Investor Strategy:
Use as non-core, tactical exposure for income in low-volatility environments.
Monitor S&P drawdowns and ETF option volumes for stress signals.
Avoid relying on these instruments for downside protection in portfolios targeting retirement stability.
12.
Wall Street Outlook: Dollar Slide, Powell Speculation, and Inflation Signaling
Markets steadied this week as geopolitical tensions cooled with the Iran-Israel ceasefire, but underlying stress in key asset classes persists — particularly in foreign exchange and rate-sensitive sectors. Traders are recalibrating for what could be a pivot in US monetary policy, as political noise intensifies over Fed leadership and dollar weakness accelerates.
Dollar Pressure Deepens:
The US Dollar Index slid to a three-year low, falling 0.5% after the Wall Street Journal reported that President Trump may replace Fed Chair Jay Powell earlier than expected.
The euro surged to $1.1710, its strongest level since September 2021.
“We suspect that some of this narrative is seeping into perceptions,” said Macquarie’s Thierry Wizman, pointing to speculation over Fed independence.
This decline is especially concerning given the rebound in Treasury yields, which would traditionally support the greenback. Instead, we are witnessing a breakdown in classic correlations, as political interference becomes a dominant narrative.
Powell’s Job and Policy Path:
The idea of a “shadow chair” to pressure the Fed into rate cuts has unnerved institutional allocators. The White House denied imminent changes but confirmed the president’s “right to change his mind.”
This raises risk premiums around Fed credibility, especially with inflation still a threat and growth signals weakening.
Any leadership uncertainty at the Fed historically results in higher long-end yields due to perceived policy drift or political bias.
Safe Havens and Gold Dynamics:
Gold fell 0.2% to $3,324/oz, losing some haven allure post-ceasefire.
Continued outflows are expected unless inflation data surprises to the upside or Fed intervention appears politically constrained.
Equity Markets:
S&P 500 closed just under its all-time high, up 0.6%.
Risk-on sentiment is heavily liquidity-driven, with AI optimism (led by Nvidia) adding a secondary tailwind.
Oil and Inflation:
Brent crude rebounded to $68.49/bbl, up 1.2%, despite subdued supply risk.
Inflation-linked assets remain moderately priced, but any disruption to the Strait of Hormuz or further US-China escalation could reignite tail-risk pricing.
Practical Implications:
Dollar weakness can spur a rotation into EM equities, gold, and real assets.
Investors should brace for increased FX volatility and repricing of global rate differentials.
Portfolios with high USD exposure may benefit from increased geographical diversification.
TIPS and short-duration Treasuries become more attractive as stagflation hedges in case Powell is replaced with a dovish successor.
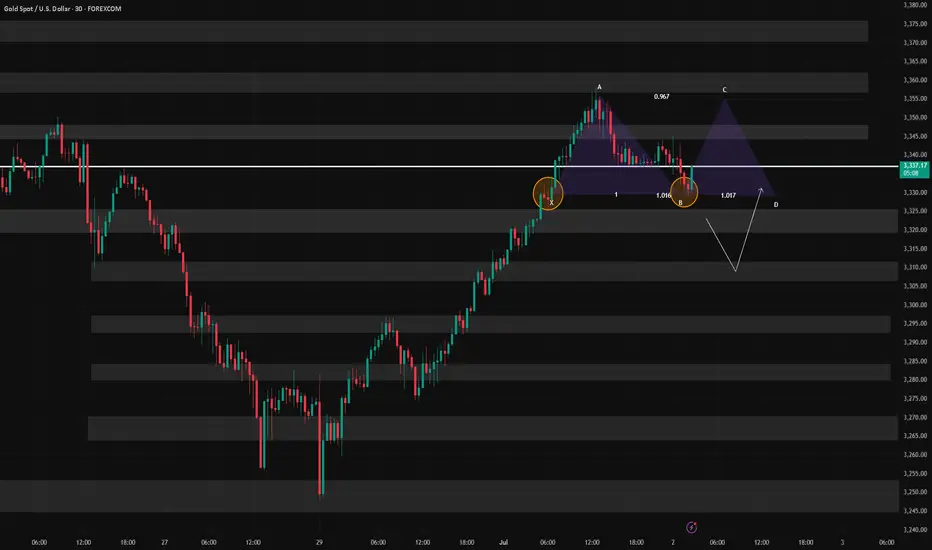
XAUUSD: Post-Crash Buy Zone and Bullish SetupHere's a structured breakdown of today's #XAUUSD (Gold) trading idea, including key levels, wave structure, and risk/reward zones for both short-term and swing traders.
---
🔹 Key Technical Zones (H1 & H4 Charts)
Support Levels
- 3,303 USD – Key support on H4; potential false breakout area
- 3,324–3,327 USD – Wave 5 completion zone and high-probability buy area
- 3,337–3,343 USD – Entry zone for early bullish setups
- 3,340–3,345 USD – Clean long entry; targeting up to 3,450 USD
Resistance Levels
- 3,363–3,365 USD – Sell zone tied to wave 4/5 overlap
- 3,375–3,383 USD – Mid-range resistance; key for short-term profits
- 3,405–3,500 USD – Long-term bullish targets; includes ATH region
---
🔹 Wave Count (H1 Structure)
- Wave X – Recent sell-off ended a potential uptrend; suggests ongoing correction (WXY)
- Wave Y – 5-wave drop toward 3,363–3,365 USD; acting as a short-term sell zone
- Wave Z – Expected final leg down toward 3,324–3,327 USD (ideal buy zone)
- Retracement Setup – Anticipated bullish retrace post-wave 5, with targets back at 3,363–3,376 USD
---
🔹 Order Blocks & FVGs
Buy Zones
- 3,343–3,330 USD – FVG within an order block; strong bullish entry area
- 3,319–3,317 USD – Deep support with short-term target at 3,349 USD
Sell Zone
- 3,363–3,365 USD – Key area for short setups, with targets at 3,342–3,330 USD
---
🔹 Strategy & Key Takeaways
1. Bullish Structure Still Intact
- Rising channel remains valid on H4
- Holding 3,303 USD is critical for confirming bullish continuation
2. Trade Setup
- Long entries near 3,340–3,345 USD
- Target range: 3,450 USD and above
- Tight stops around 3,325 USD recommended for low-risk exposure
3. Wave Completion Zones in Play
- Monitor 3,324–3,327 USD (buy zone) and 3,363–3,365 USD (sell zone) for end-of-wave activity
4. Risk Management Is Key
- Scale into positions
- Respect intraday volatility and breakout traps
XAU/USD Gold LONG 1:1 XAU/USD Gold LONG 1:1
Let's try to catch the low of the 4h candle, limit order.
Enjoy!
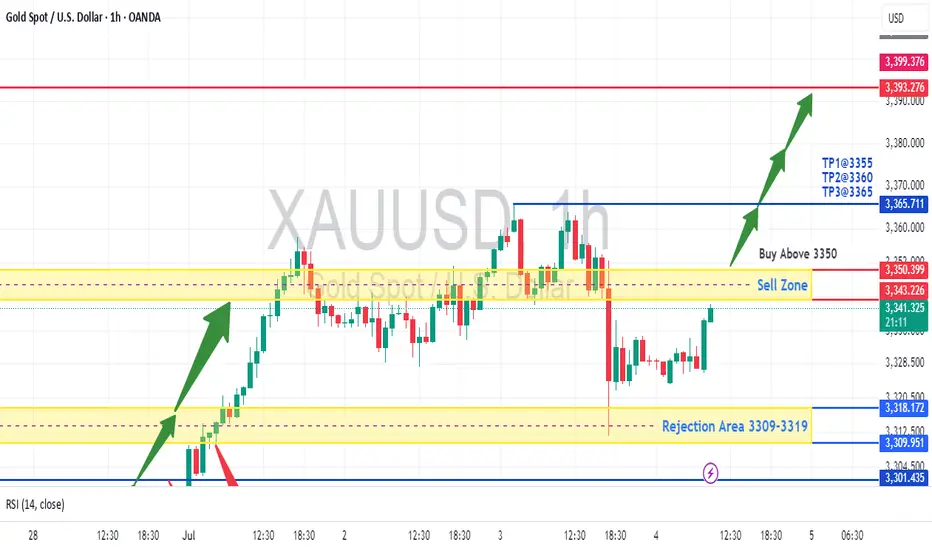
XAUUSD - Retesting 3400 before DeclineThe chart shows a potential buy setup for gold (XAUUSD) with the following key points:
Price Action: Gold is trading at 3,341.465, above the suggested "Buy Above 3350" level, indicating a bullish bias.
Support/Resistance: The rejection area at 3309-3319 held as support, and price has moved higher, confirming buyer interest.
Take Profit Levels: TP1 (3355), TP2 (3360), and TP3 (3365) provide clear upside targets.
RSI Confirmation: The RSI (14) at 54.21 shows moderate bullish momentum without being overbought.
Volume & Close: The slight increase in price (+0.09%) with supportive volume suggests accumulation.
Trade Idea: Enter long above 3350 with stops below 3309, targeting TP1-TP3. The rejection zone and RSI support further upside.
Disclaimer: This is not financial advice. Please consult with a financial advisor before making any investment decisions. We are not responsible for your loss because we are not SEBI registered and this analysis based on technical aspects and only for educational practice. Do your own research.
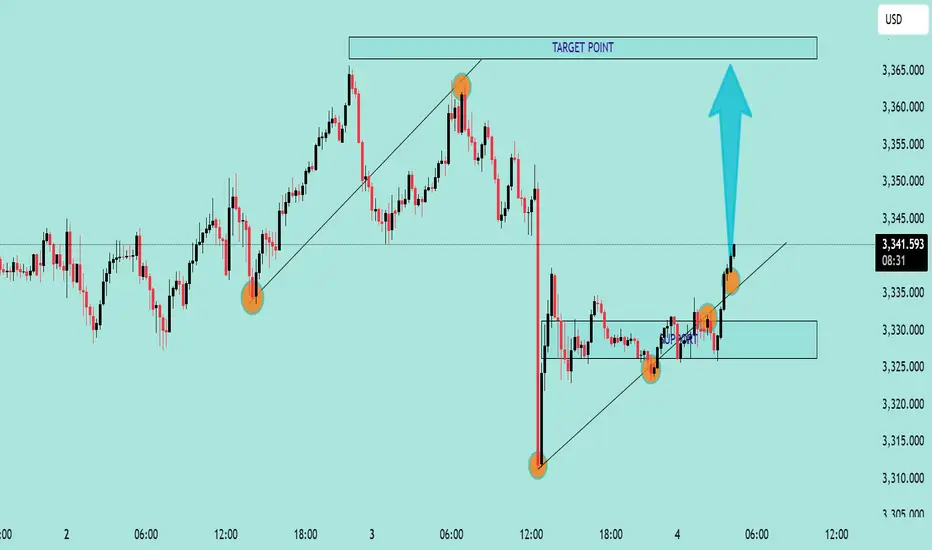
Gold/USD Bullish Breakout Toward Target Zone Gold/USD Bullish Breakout Analysis 🚀🟢
The chart illustrates a strong bullish breakout from a consolidation zone, signaling upward momentum:
🔍 Key Technical Observations:
Support Zone: The price respected the support area around 3,325 – 3,330 USD, forming a solid base for reversal.
Bullish Structure: Series of higher lows and higher highs indicate a bullish trend formation.
Breakout Confirmation: Price broke above short-term resistance with a strong bullish candle, indicating buying pressure.
Trendline Support: The ascending trendline has held well, confirming trend continuation.
Target Point 🎯: Projected target is near 3,365 USD, which aligns with a previous resistance and Fibonacci confluence zone.
✅ Conclusion:
The breakout above resistance, supported by a bullish structure and momentum, suggests further upside potential toward the 3,365 USD target zone. As long as price holds above the breakout level, bullish bias remains valid.
🛑 Watch for invalidation if price falls back
GOLD 15M BULL CONTINUATIONBull still in control to at list 3390
I will hold this trade till tomorrow and if we are not there by the time of NFP will close it manual
Will update here
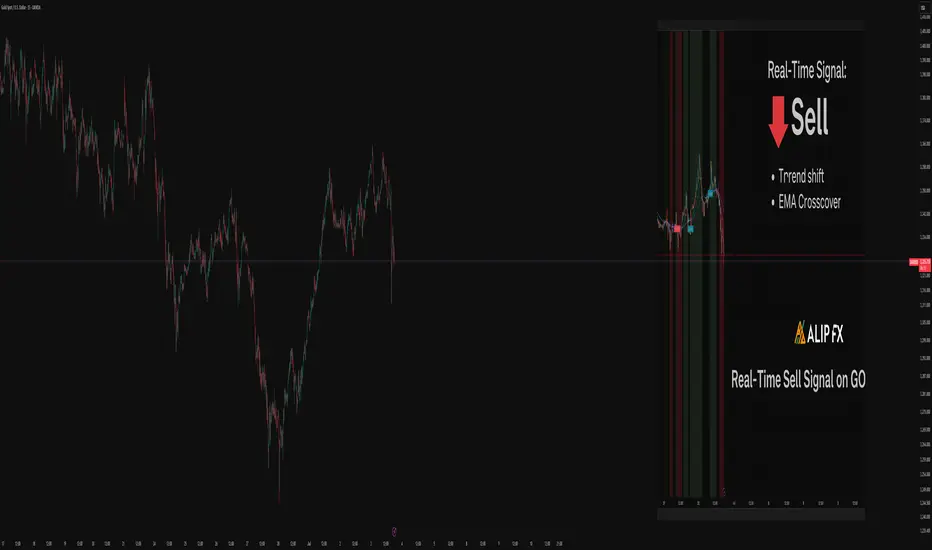
Live Signal from ALIP FX Smart Scalper | XAUUSDThe ALIP FX Smart Scalper indicator just issued a SELL signal on XAUUSD (Gold) on the 15-minute timeframe.
The trend filter turned red, EMA structure aligned to the downside, and the signal confirmed by strong momentum.
📉 Scenario: Short bias while the trend remains bearish.
🕒 Timeframe: M15
📌 Reminder: Wait for candle close and confirmation before entry.
Analysis and strategy of the latest gold trend on July 3:
1. Analysis of gold news
The current market focus is as follows:
Trump tax reform is advancing & trade agreement is approaching
The tax reform was passed by the Senate, and the deadline for trade negotiations on July 9 is approaching, which has triggered a rise in risk aversion.
The Fed's attitude is subtle
Although Powell did not explicitly support the July rate cut, he emphasized that more data is needed for support, and did not rule out the possibility. This "dovish" attitude supports the medium- and long-term bullish expectations for gold.
The upcoming big non-agricultural data (July 3 US trading session)
This means that the market will quickly reflect the gap between expectations and reality in the next 24 hours, and volatility may increase.
2. Gold technical analysis
Summary of recent trends:
Gold rose strongly on Tuesday, reaching a high of $3,358;
Stagflation signals appeared on Wednesday, and the risk of chasing long positions at high levels is extremely high;
The current market bullish sentiment is high, but the technical side has entered the overbought zone, and the bullish momentum is weakening.
Key resistance/support levels:
Resistance zone: 3357-3367 USD: Near Tuesday's high, it is an important defensive position for short sellers;
Support zone: 3325-3315 USD: If it falls below, short sellers may further exert their strength, with the target directly pointing to 3300 USD.
Today's operation strategy suggestion:
Main idea: short selling on rebound
Currently in a high-level oscillation stage, it is recommended to short sell at high levels and buy at low levels, and be cautious in chasing up.
Short order strategy:
Entry position: short near $3365
Stop loss: above $3375
Target: 3326 / 3315 / 3300
Long order strategy (conservative):
If it pulls back to around $3315 and stabilizes, you can short long with a small position
Stop loss: below $3305
Target: 3326 / 3340
III. Comprehensive judgment and suggestions
Gold is currently in a news-intensive & technically overbought stage, and volatility will increase;
There is a high probability that the intraday Asian and European sessions will fluctuate weakly, waiting for the US non-agricultural guidance direction;
If the ADP and Challenger layoffs data are strong, gold will face obvious downward pressure in the short term;
Don't chase the highs, follow the trend, and risk control is the key.
📌Warm Tips:
Maintain trading discipline and do not trade with emotion;
Before the non-agricultural data, appropriately reduce positions or stop profits;
Pay more attention to the linkage changes between US bond yields and the US dollar index, which have a great impact on gold.
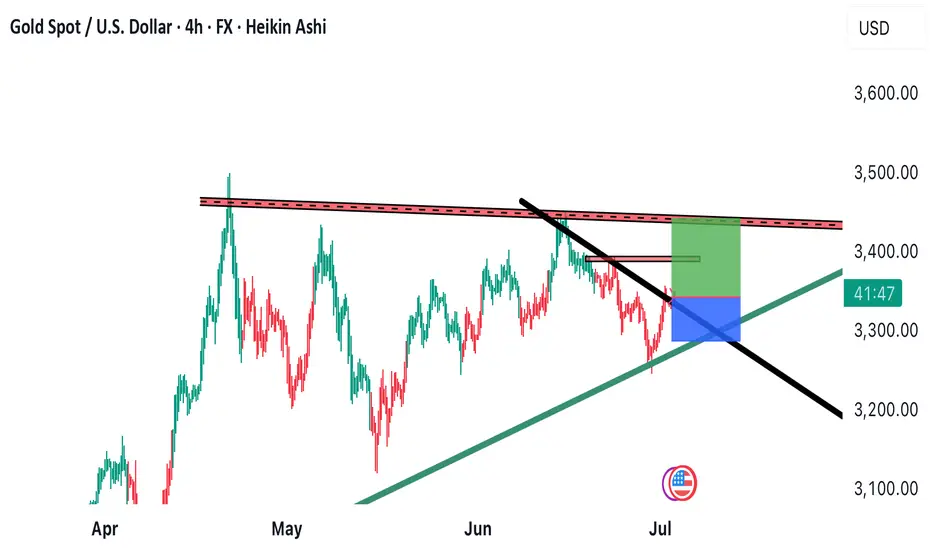
BUY. gold against the dollar using "Heikin Ashi" Analysis
The chart for the price of gold against the dollar using "Heikin Ashi" candles on a 4-hour timeframe. Here are the details:
Price Analysis:
1. Ascending Triangle:
- The price is fluctuating within an ascending triangle, indicating the possibility of a continued uptrend.
- The upper level of the triangle acts as resistance at around $3,350.
2. Support Line:
- The ascending support line (green line) supports the price movement, enhancing the chances of the uptrend continuing.
3. Resistance Level:
- The level indicated by the red line represents the resistance that, if broken, could lead to a significant price increase.
Opening a Buy Position:
1. Confirmation of Breakout:
- Wait for confirmation of a breakout above the resistance level ($3,350) before starting to open a buy position.
- Closing a candle above the resistance level can be used as a confirmation signal.
2. Risk Management:
- Set a stop-loss below the support line of the triangle to minimize risks in case of a pullback.
3. Price Target Advice:
- Entry Price: $3,350.00
- First Target: $3,375.00
- Second Target: $3,400.00
- Third Target: $3,430.00
- 🚨 Stop Loss: $3,329.00
4. Ongoing Technical Analysis:
- Periodically review the analysis to ensure the trend continues and to identify potential changes.
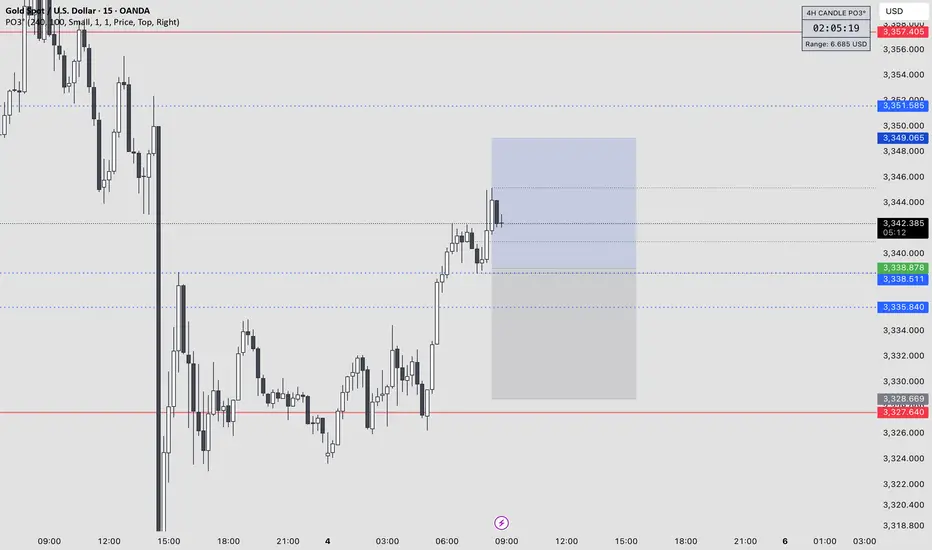
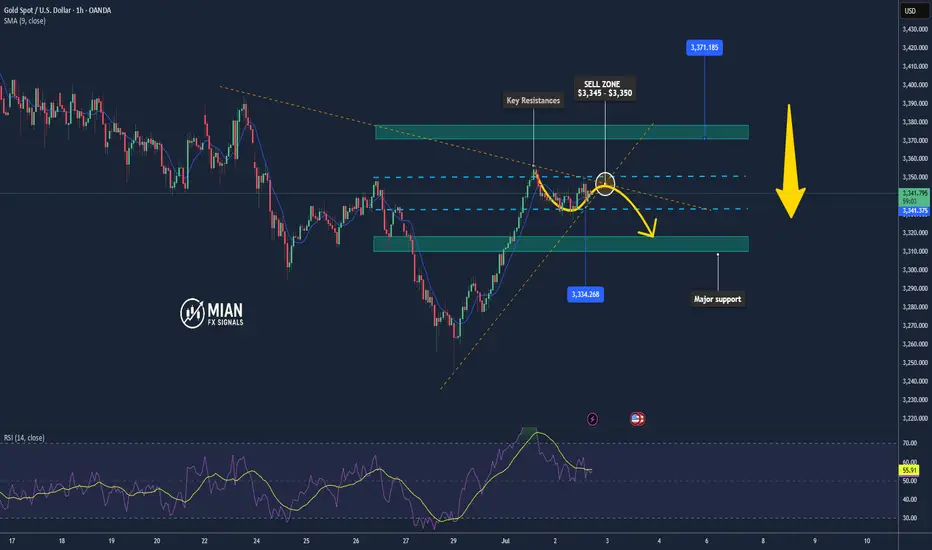
Gold Sees Volatile Swings – Pullback Risk Remains📊 Market Highlights:
Gold surged to $3,351 earlier today after weaker-than-expected US ISM manufacturing data, which boosted expectations of a Fed rate cut. However, profit-taking quickly pushed prices down to $3,334 before recovering to $3,342.
📉 Technical Analysis:
• Key Resistance: $3,351
• Nearest Support: $3,334
• EMA: Price is above EMA 09 → uptrend still intact.
• Candles / Volume / Momentum: H1 candle shows a long upper wick, indicating selling pressure near the recent high. Bullish momentum is slowing, and volume has started to normalize.
📌 Outlook:
Gold may face a short-term pullback if it fails to break above $3,351 and the USD strengthens during the US session.
________________________________________
💡 Suggested Trading Strategy:
🔻 SELL XAU/USD at: $3,345 – $3,350
🎯 TP: $3,334
❌ SL: $3,353
🔺 BUY XAU/USD at: $3,332 – $3,334
🎯 TP: $3,350
❌ SL: $3,323
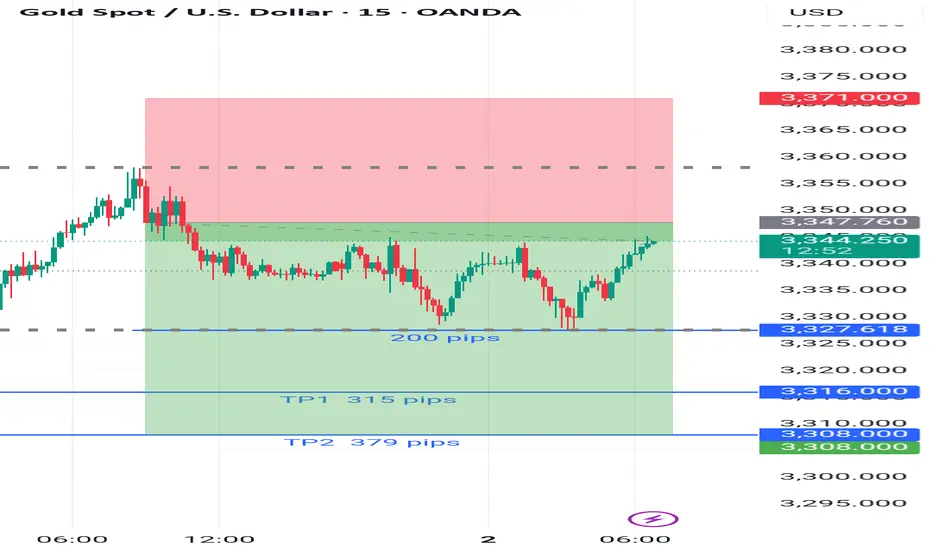
AFTER - XAU/USD - Jul 1,2025 DoneCongratulations guys 200 pips profits
✅ XAU/USD Trade Recap – Jul 1,2025
Bias: Short (Sell Position)
🔹 Entry Price: Around $3,348
🔻 Stop-Loss: $3,371
🎯 Take-Profit Target: $3,327 (✅ Hit – 200 pips)
📉 Result: First target partially reached – trade closed with +200 pips in profit.
Price rejected the resistance area and moved downward, allowing for a clean exit before reaching TP1 and TP2. Conservative profit-taking secured gains without risking reversal.
💡 Summary:
Smart and disciplined execution. The market respected the setup, and you locked in profits safely at 200 pips before any retracement.
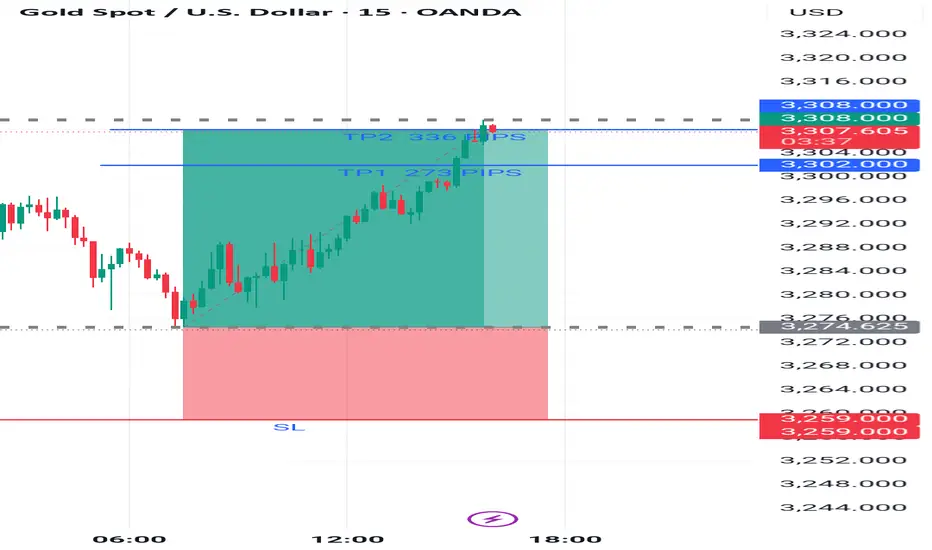
Congratulations everyone all targets done__ June-30,2025
CONGRATULATIONS EVERYONE
✅ XAU/USD Trade Recap – June 30, 2025
Bias: Long (Buy Position)
Result: ✅ Take-Profit Hit
📌 Entry Zone: Around $3,363 – $3,370
🎯 Target 1 (TP1): Hit at $3,302 (273 pips)
🎯 Target 2 (TP2): Hit at $3,308 (336 pips)
🛑 Stop-Loss (SL): $3,259 (Not triggered)
📈 Outcome:
The price moved strongly in favor of the long trade after entry, reaching both profit targets successfully.
The setup was executed with high precision, and the bullish momentum carried price past TP2, confirming the trade idea.
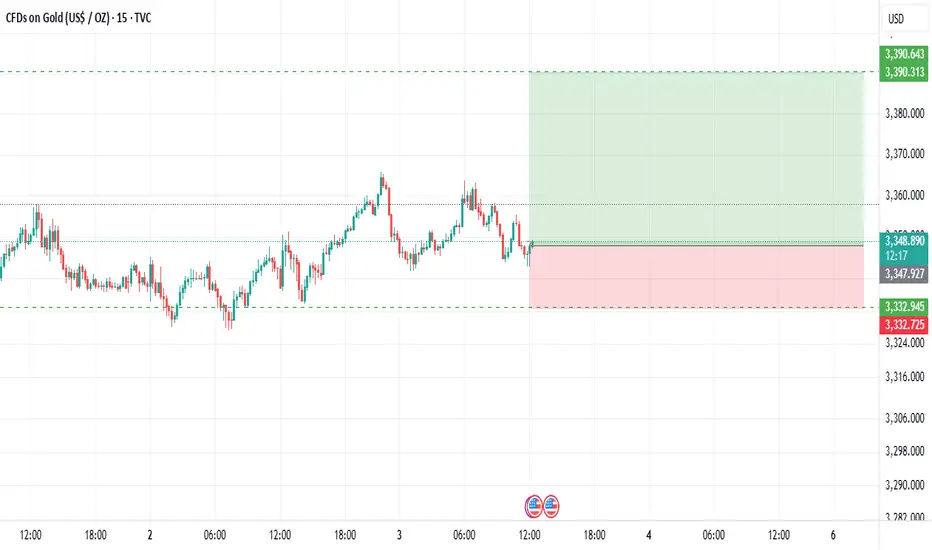
Gold Pulls Back Slightly After Peaking at $3,357📊 Market Overview:
Gold rallied to $3,357 yesterday following weak US manufacturing PMI, sparking expectations of an upcoming Fed rate cut. This morning, prices are pulling back to around $3,340 as traders await the FOMC meeting minutes for further guidance.
📉 Technical Analysis:
• Near resistance: $3,357
• Key resistance: $3,370
• Near support: $3,330
• Major support: $3,318
• EMA: Price is still above the 09 EMA, but starting to slope downward → short-term weakness emerging.
• Candlestick & momentum: Doji candle with a long upper wick on H4 chart around $3,357 → showing fading bullish momentum. RSI dropping out of overbought zone confirms potential short-term pullback
📌 Outlook:
Gold is currently in a mild downward correction, and may continue to decline toward $3,330 – $3,318 if the FOMC minutes do not suggest strong dovish intent.
💡 Suggested Trading Strategy:
🔻 SELL XAU/USD at: $3,350 – $3,354
🎯 TP: $3,330
❌ SL: $3,359
🔺 BUY XAU/USD at: $3,328 – $3,332
🎯 TP: $3,350
❌ SL: $3,318